
Say the cart abandonment rate that sat around 70% until last week crossed into the 80s from one day on. Nothing changed in the checkout fields or the shipping display. There is no sign that shoppers started behaving differently. When only the rate goes up, what grew isn't the people who gave up on buying — it's the number of failed payments.
Contents
TL;DR#
- In a week where the cart abandonment rate jumped, check first whether failed payments started rising from the same day
- Card testing repeats small payments over a short window, so only the count of sessions that reached the cart goes up
- The numerator, the purchase count, doesn't move, so the rate rises even when shopper behavior is unchanged
- Bots skew by entry point. On our own site over the last 30 days, the two main entry points (Direct and Google search) sat about 7x apart
- Before you pick a fix, check once whether bots are riding on the denominator that makes the rate
1. Check Failed Payments First When Cart Abandonment Rises#
In a week where the cart abandonment rate jumped, check first whether failed payments started rising from the same day.
Once you know abandonment is up, where your hand reaches is fairly fixed. Cut form fields, show shipping cost earlier, send an abandonment email. None of these is wrong as a way to reduce abandonment. What is wrong is the order. Unless you first check whether something other than a human is mixed into the denominator of that rate, you keep working on a counterpart that never changed.
A common background to a sudden rise in failed payments is card testing: an attempt to determine whether stolen card information is still valid so it can be used to make purchases[1]. In Japanese it is sometimes called "credit master"[1]. Stripe lists three symptoms to look out for[1].
- A spike in failed or blocked payments
- A spike in requests with 402 errors
- A spike in suspicious payments with low transaction amounts, often with nonsensical customer names and emails
All three happen on the payment side and never surface in how the site looks. Shopify likewise lists carts that keep filling without purchases following, and payment failures running back to back over a short window, as signs of bots[2].
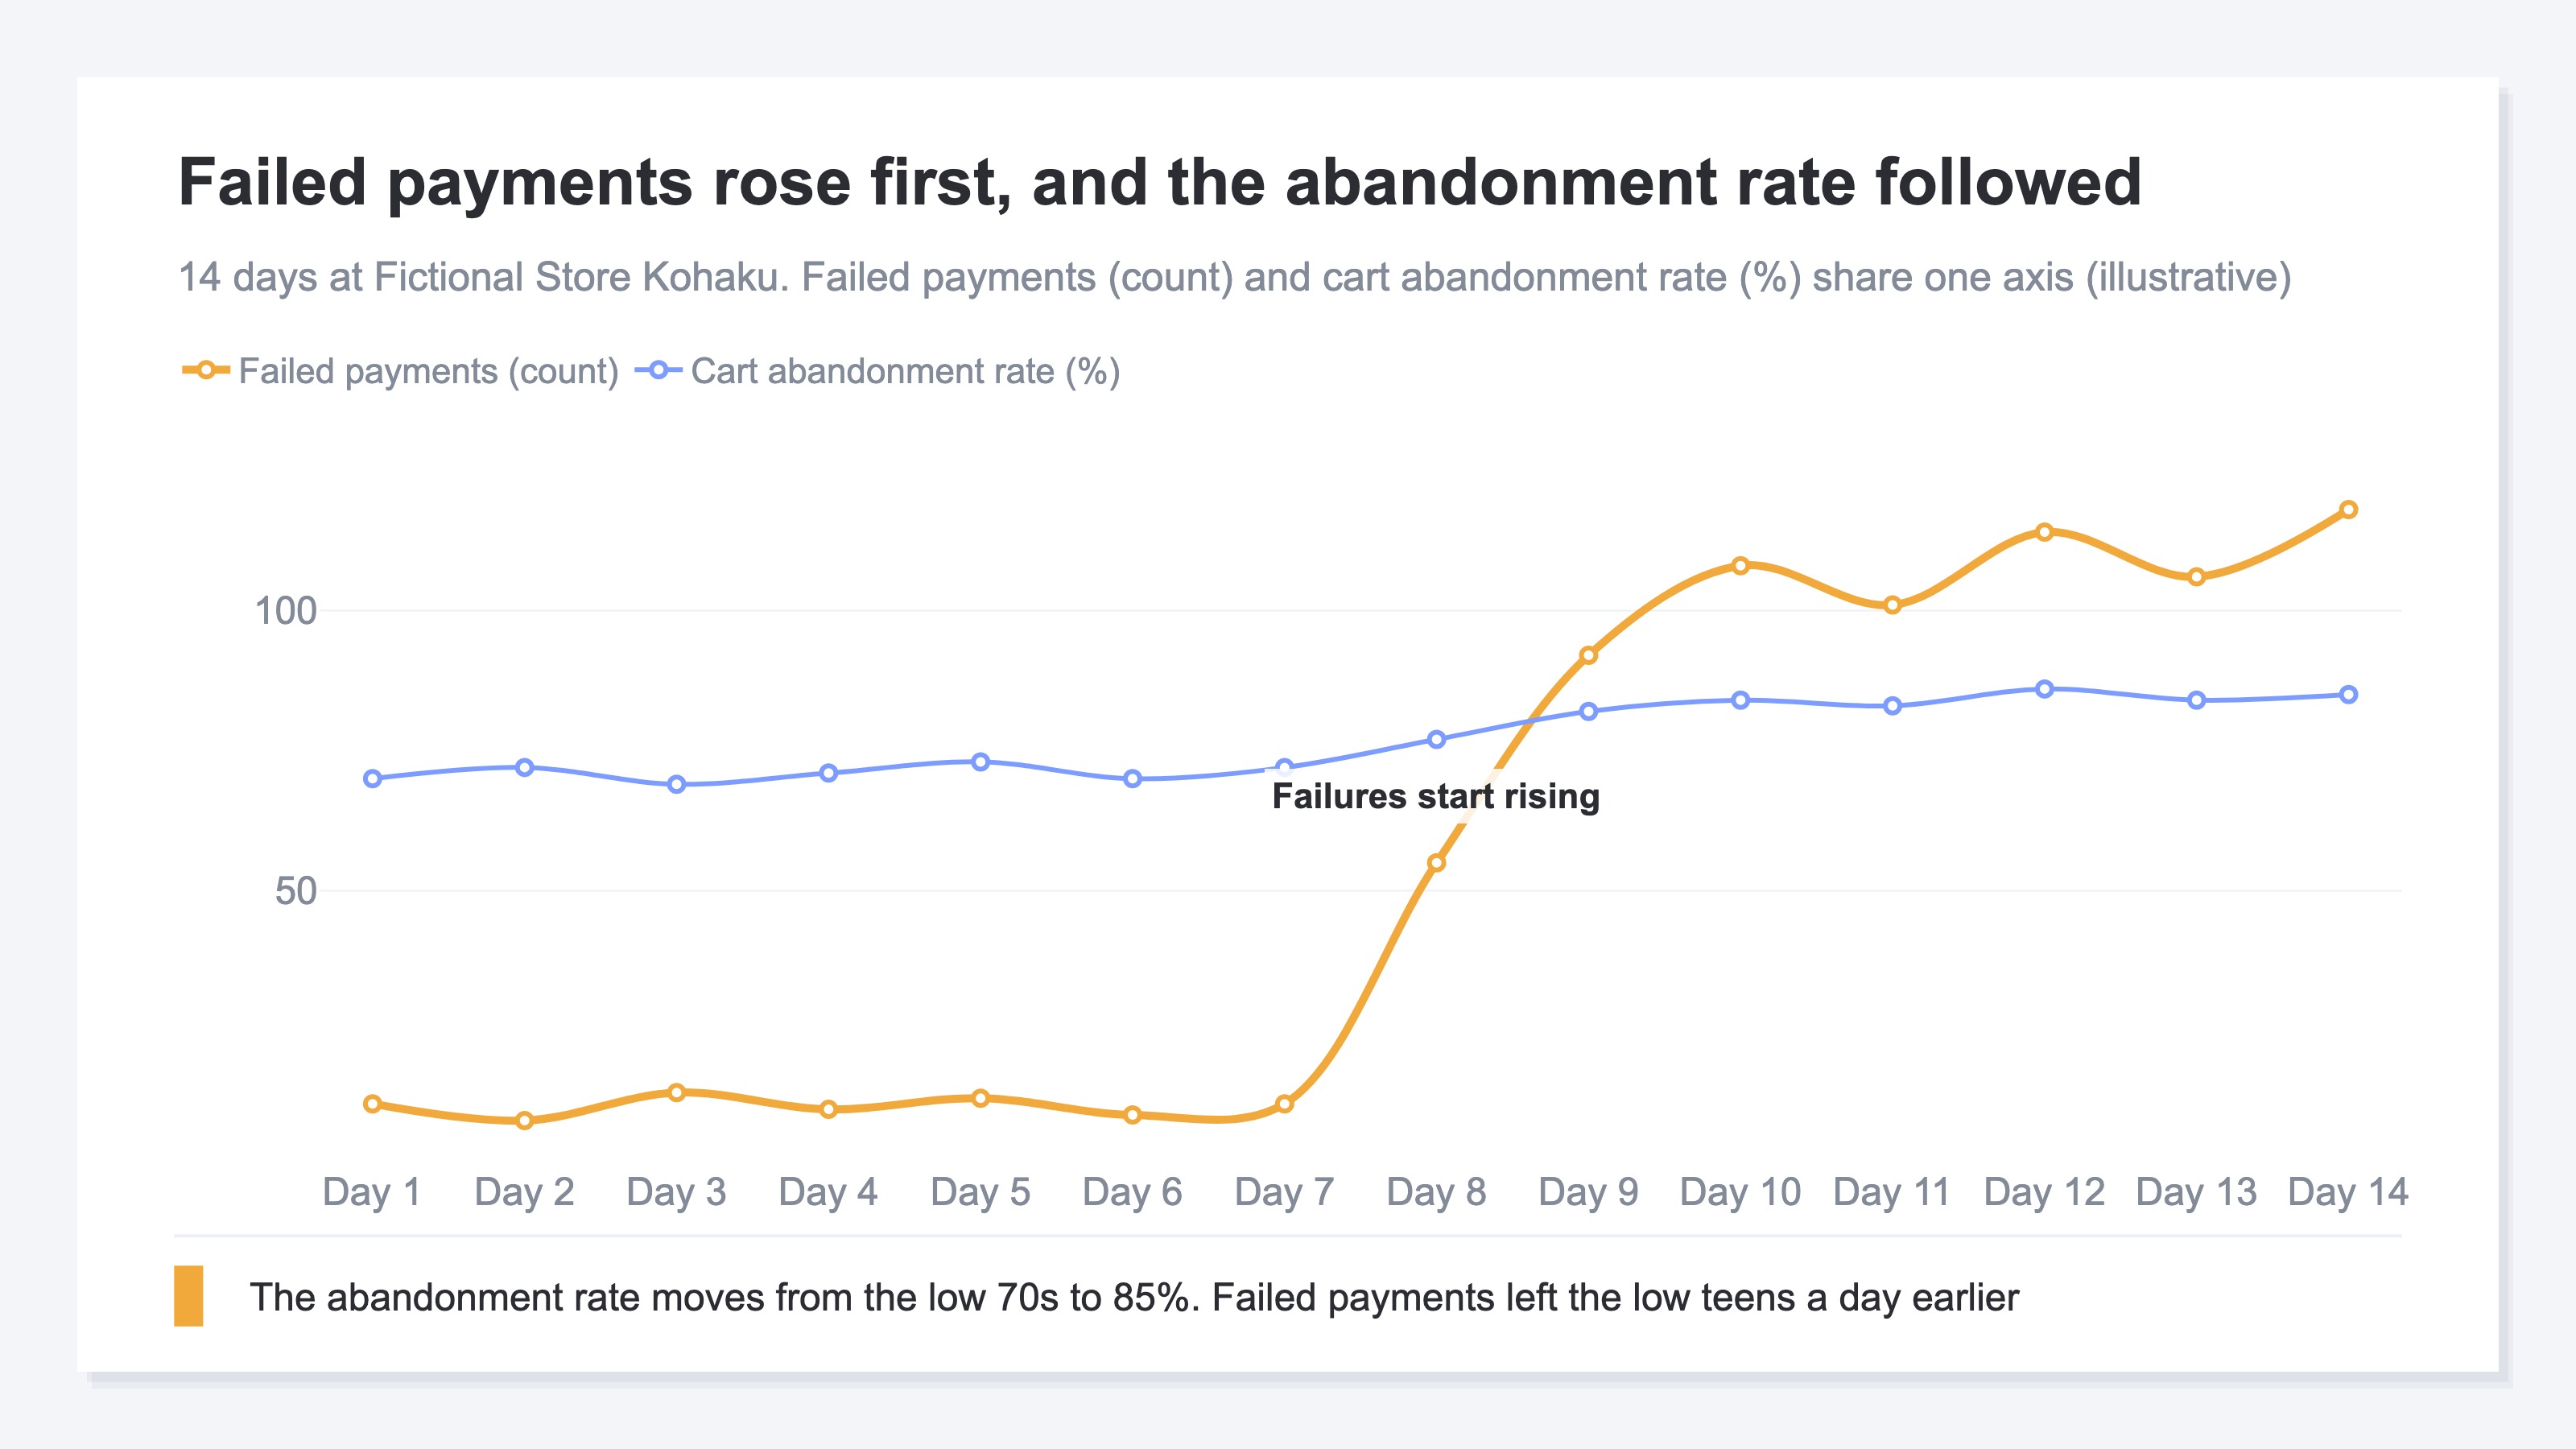
Failed payments rise first, and the abandonment rate follows after. The order looks reversed when you read the abandonment rate weekly or monthly. Line up rounded periods and it can only read as both rising in the same week.
This isn't the first time a payment count and a measurement-tool count have disagreed. That the same purchase counted by two separate mechanisms won't add up is covered in GA4 purchase counts higher than orders. How to check when traffic itself suddenly rises is laid out in traffic suddenly spiked. This article isn't about that upstream point but about the kind of increase that happens inside the purchase funnel.
2. Shopping Behavior Didn't Change but the Rate Went Up#
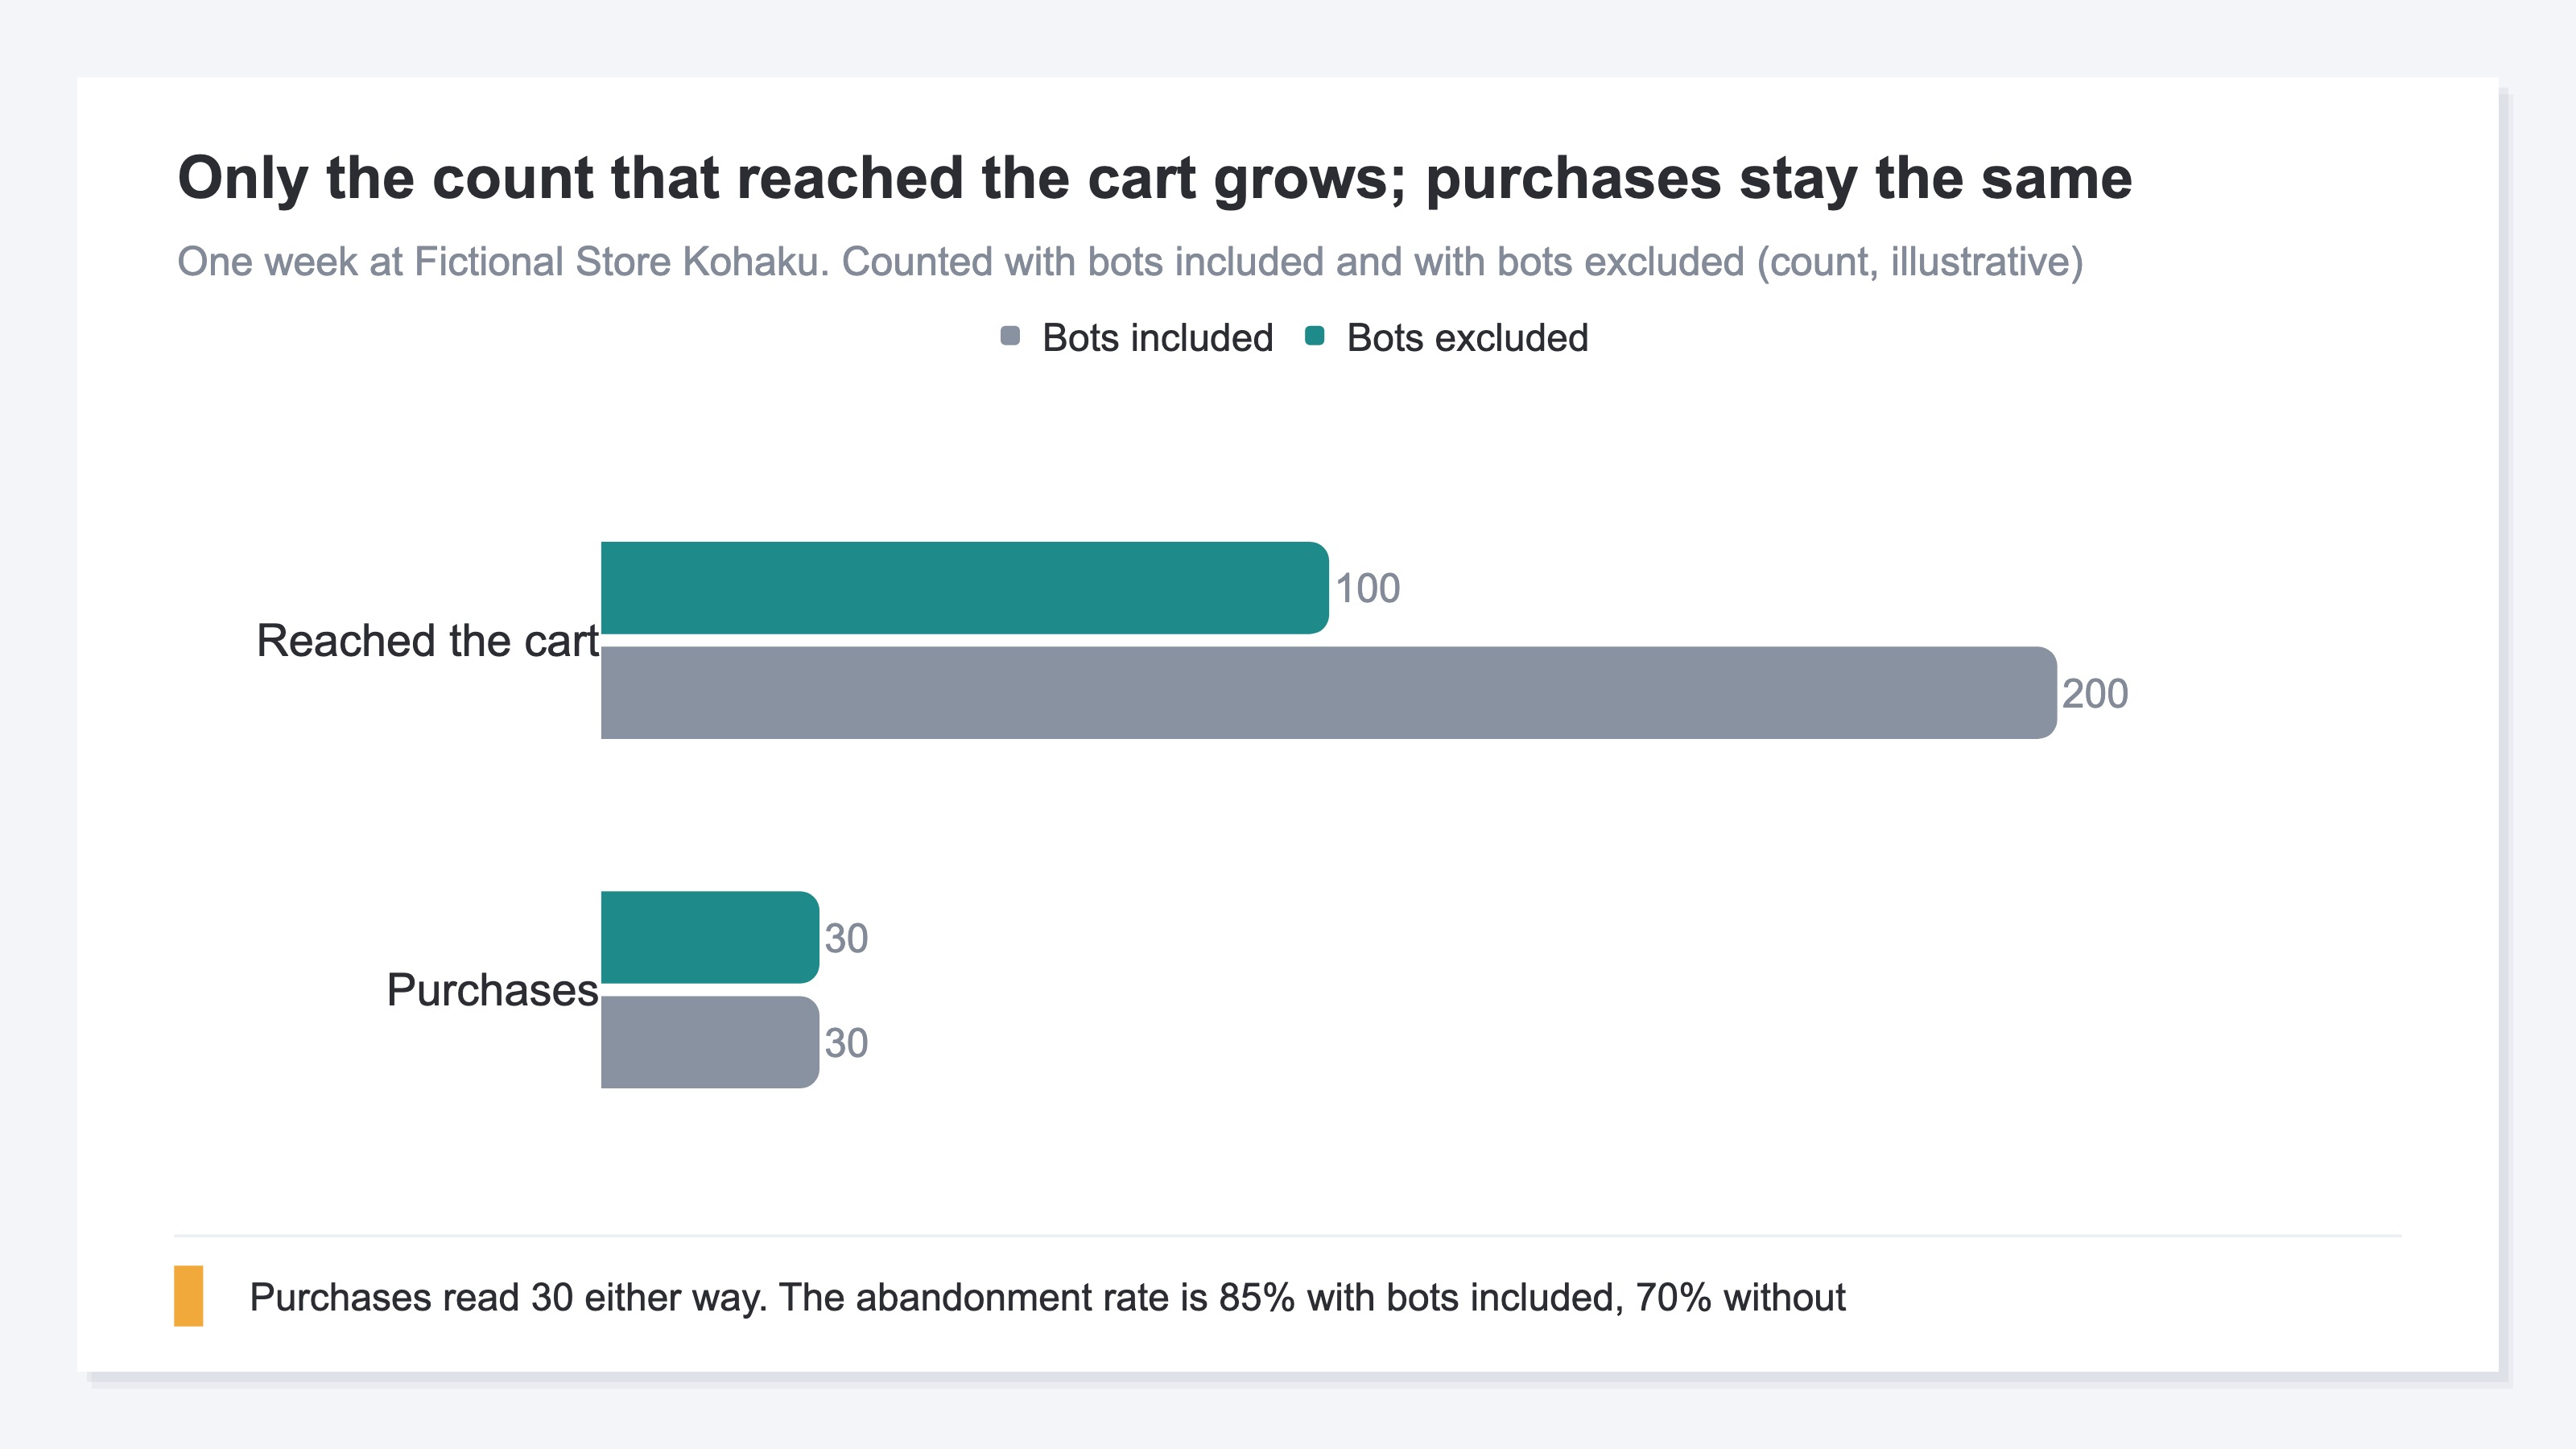
The numerator, the purchase count, stays as it was, while the denominator — the count that reached the cart — grows on bot attempts, so the rate alone goes up.
The formula for cart abandonment rate, and the roughly 70% level generally quoted, are covered in stop chasing cart abandonment rate. What we look at here is what sits inside that formula.
Card testing repeats small payments over a short window. Small amounts are chosen because cardholders are less likely to notice them and report them as fraudulent[1]. The attempts travel through the cart to the payment step, so the count that reached the cart goes up. Meanwhile the purchase either doesn't complete, or completes and gets refunded right after. Only the denominator grows.
When the denominator is dirty, the rate isn't the only thing that breaks. Stripe lists reduced quality of the data a business needs to operate as one of the harms of card testing[1]. Revenue born from card testing can look like good, new customers in the data, which makes a clear line of sight on real growth harder to hold[1]. Shopify likewise explains that when analytics are inflated by bots, CVR reads lower than it really is and traffic reports show growth that doesn't exist[2].
Everything up to here can be sized up by opening a single payment provider dashboard. Have payment failures been rising from one particular day? Do small orders for the same cheap product keep coming? Is there anything unnatural in the buyer names or email addresses? One check is worth the time. But what the payment side can tell you stops at the failed payment. From which entry point on the site, and on top of how many visits, that failure occurred isn't recorded on the payment side.
3. Bots Don't Arrive Evenly From Every Entry Point#
As long as you are looking at one site-wide number, the skew never surfaces. It surfaces only once you split by entry point.
On revenuescope.jp, the site I run, I checked the breakdown by channel. Over the last 30 days, the share of sessions excluded as bots was 38.6% for the site as a whole. Open the same period by entry point and Direct reads 70.6%, Google search 10.1%. On the same site over the same period, the two main entry points that carry the sessions sit about 7x apart.
Both of these are main entry points. In traffic before exclusion, Direct and Google search alone account for more than 80% of the site. Which is to say, this isn't a lineup of shares from entry points that only got a handful of visits. Per-entry-point shares swing wider the thinner the denominator gets, so when you read a gap, look first at how large a denominator that entry point carries.
Widen the period to 90 days and the site-wide share barely moves, at 39.9%. By entry point, though, Direct reads 75.4% and Google search 8.1%, and the gap opens to about 9x. The order doesn't change places either. Which means this isn't a one-off wobble in a particular week.
Note: the figures come from RevenueScope's get_breakdown(dimension=channel), for the site revenuescope.jp. The periods are the last 30 days and the last 90 days, the attribution model is last_touch, bot detection is behavior-based, and the measurement date is August 17, 2026.
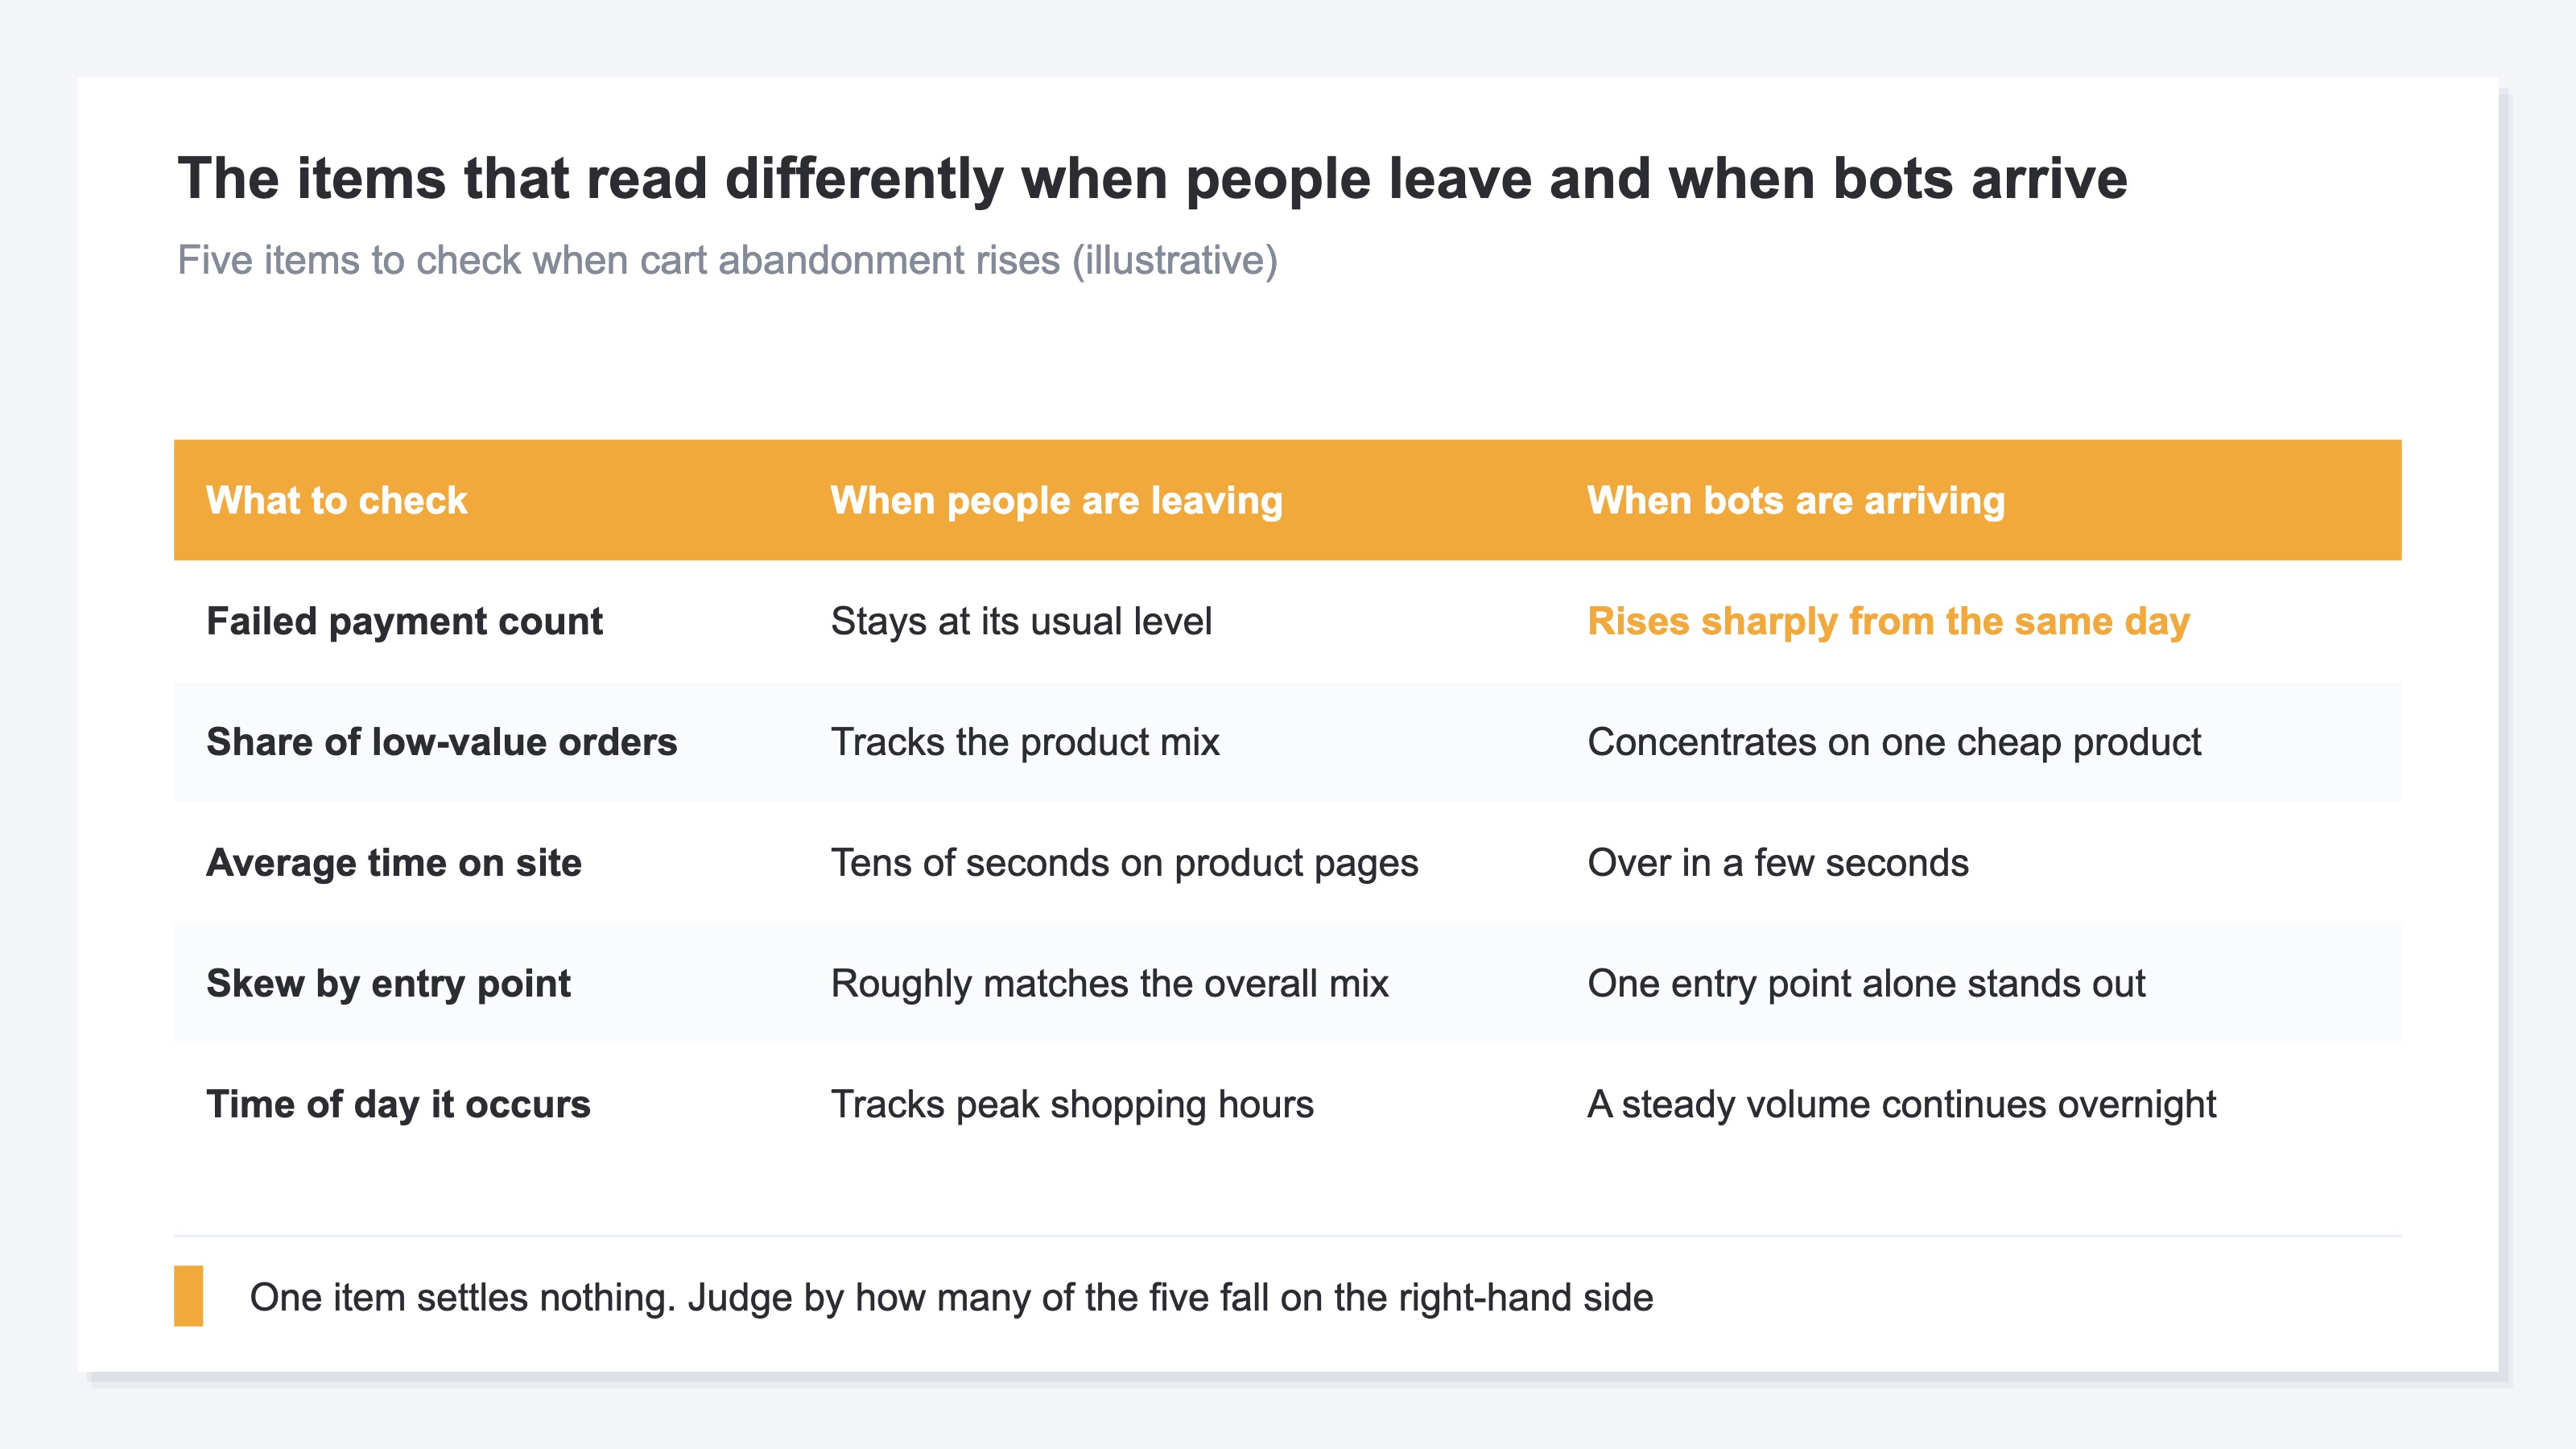
The same "cart abandonment went up" splits differently, item by item, depending on whether people are leaving or bots are arriving.
How the numbers change after you block bots is covered in sessions dropped after blocking bots. The premise itself, counting humans and bots separately, is laid out in the age of agentic shopping.
Back to that measurement once more. Google search, the pillar of traffic, read 10.1%, while Direct read 70.6%. Visits that carry no referrer information have no identifiable origin, so they tend to get treated as ordinary traffic. Nobody looking only at the site-wide 38.6% gets to that skew on their own. You can name it only once human sessions and excluded counts sit in the same list for each entry point.
RevenueScope solution
What RevenueScope aggregates by entry point is the sessions left after bots are excluded, together with the count excluded at that time. CVR, average time on site, bounce rate, revenue and RPS (revenue per session) are shown in the same list, as the breakdown for that entry point.
Say you ask an AI assistant such as ChatGPT or Claude, over MCP, "for the last 30 days, what are the sessions and bot exclusions by entry point, plus CVR and average time on site?" What comes back takes the form below. For the sake of explanation, it is written out with rounded figures for Fictional Store Kohaku.
Fictional Store Kohaku's breakdown by entry point (illustrative)
| Entry point | Sessions | Bots excluded | CVR | Avg. time |
|---|---|---|---|---|
| Site total | 7,000 | 5,000 | 1.8% | 50s |
| Google search | 4,000 | 400 | 2.7% | 75s |
| Direct | 2,000 | 4,400 | 0.4% | 10s |
| Referral | 1,000 | 200 | 1.0% | 30s |
Note: the table above is a fictional example built for explanation, with the figures rounded. The demo screen runs on the sample store's sample data (refreshed daily), so neither the entry point names nor the figures match the values written here.
Add sessions and bot exclusions together and you get the raw visit count before exclusion. For the site as a whole, that means 5,000 were excluded out of 12,000; for Direct alone, 4,400 out of 6,400.
The site-wide CVR is 1.8%. Open it by entry point, though, and Google search is 2.7%, Direct 0.4%. There is no entry point buying at 1.8%. And Direct's average time on site is 10s, with the count piling up without any trace of a product page being read. Direct's denominator before exclusion is 6,400, so against the same 8 purchases the rate comes out at less than a third. The site-wide CVR gets dragged toward that value too.
The next move is to split what sits inside Direct. Visits with no referrer information put people who typed the URL directly and bot attempts into the same entry point. The denominator of the cart abandonment rate is the count that reached the cart, so what can split that content directly is the payment side and the cart side. Once you have the excluded count per entry point and the purchase rate after exclusion, you can tell whether enough volume arrived in that period for bots to reach the cart at all. That is where you separate things, before you attribute the rise in the rate to shopper behavior. Whether the thing to fix is the cart side or the entry point side gets decided right there.
FAQ#
Frequently asked questions#
Q. When the cart abandonment rate goes up, can I always assume card testing is the cause?
A. No. What you look at first is whether failed payments started rising from the same day. Don't decide on that alone, though — judge by whether several of the five items above line up together. Failures also rise when you have a mechanism that retries payments, so a spike in failures is not decisive on its own. If failures are sitting at their usual level and only the rate has gone up, the cause is on the site side. The symptoms Stripe lists are a spike in failed or blocked payments, a spike in requests with 402 errors, and a spike in suspicious low-value payments[1].
Q. Why are cheap products the ones targeted?
A. Because cardholders are less likely to notice small amounts and report them as fraudulent[1]. Which is to say, they suit testing stolen numbers over a short window. Whether orders are concentrating on cheap products can be checked by sorting the order list by amount.
Q. How large is this in Japan?
A. Take the tally from the Japan Consumer Credit Association. From January to March 2026, credit card fraud losses came to ¥11.36 billion, of which ¥10.60 billion came from stolen card numbers, a share of 93.3%[4]. The figures were published on June 30, 2026 and are based on 48 major issuers. Fraud using stolen numbers accounts for most of the damage, and card testing is one of the methods for finding out whether such a number is still valid.
Q. If payment failures keep going, is there any other impact?
A. Shopify explains that payment failures lower a bank's trust and make legitimate payments more likely to be declined even after an attack ends[3]. The company also states that its own machine learning blocks approximately 90% of card testing attacks on credit card use in guest checkout[3].
Summary#
When the cart abandonment rate suddenly goes up, what you check first is the count of failed payments. If failures have been rising from the same day, what grew may be bot attempts rather than shoppers who gave up on buying. Testing whether a stolen card number still works, over a short window, shows up as a spike in failed payments[1]. The attempts travel through the cart, so only the denominator grows, and the rate rises even though the purchase count is the same.
Bots skew by entry point. On our own site, the measurement over the last 30 days put the two main entry points about 7x apart, and about 9x apart over 90 days. The site-wide share barely moves between 38.6% and 39.9%, so as long as you are looking at one site-wide number, this skew never surfaces.
Shorter forms and abandonment emails are both effective ways to reduce abandonment. Before that, check once whether bots are riding on the denominator that makes the rate. Skip the check and you keep improving a counterpart that never changed.
See which ads actually drive revenue, at a glance
Free up to 2,000 sessions/month, AI connection included. No credit card required. Up and running in 5 minutes.
References#
- [1] Stripe "Protect yourself from card testing" (2026)
- [2] Shopify "Bot Traffic Detection: Protect Your Site from Bad Bots" (2026)
- [3] Shopify "How Shopify's Machine Learning Blocks Approximately 90% of Card Testing Attacks to Protect Merchant Sales" (2026)
- [4] Japan Consumer Credit Association "Credit Card Fraud Losses (Quarterly, Major Issuer Basis)" (2026)