You tried free shipping on bulk orders and bundle deals to lift your average order value. And still, the average AOV that shows up at month's end barely moves. Run an online store and you hit this kind of dead end. It starts to feel like your tactics are wrong — but the cause usually sits a step earlier than that.
Here's the first thing this article wants to say. The reason the cause of a flat AOV stays hidden is, more often than not, that you're watching the site-wide average. A single average number melts low-value and high-value customers together, so you can't tell which group is holding the figure down. The cause only shows its face the moment you split the average into segments — new versus returning, desktop versus mobile. This article walks through, in order, how to read the cause of a flat AOV by segment rather than by the average, and how to decide which group to fix first.
Table of contents
Key takeaways#
- The reason a flat AOV (average order value, the average revenue per order) keeps its cause hidden is, usually, that you're watching the site-wide average. An average blends low-value and high-value customers into one number, hiding which group is holding it down.
- The cause appears once you split the average into segments — new vs. returning, by device. New and returning customers in particular often differ sharply in order value, so when new customers surge the average naturally falls — yet it's easy to misread that as "AOV dropped."
- Once you've spotted it, don't try to fix everything. Start with the segment that has both a high share of orders and a low order value — set that priority, and only then does your limited time actually move revenue.
1. Why the average AOV hides the cause#
When the average AOV won't move, the first thing to question isn't your tactics — it's the very lens of the average itself.
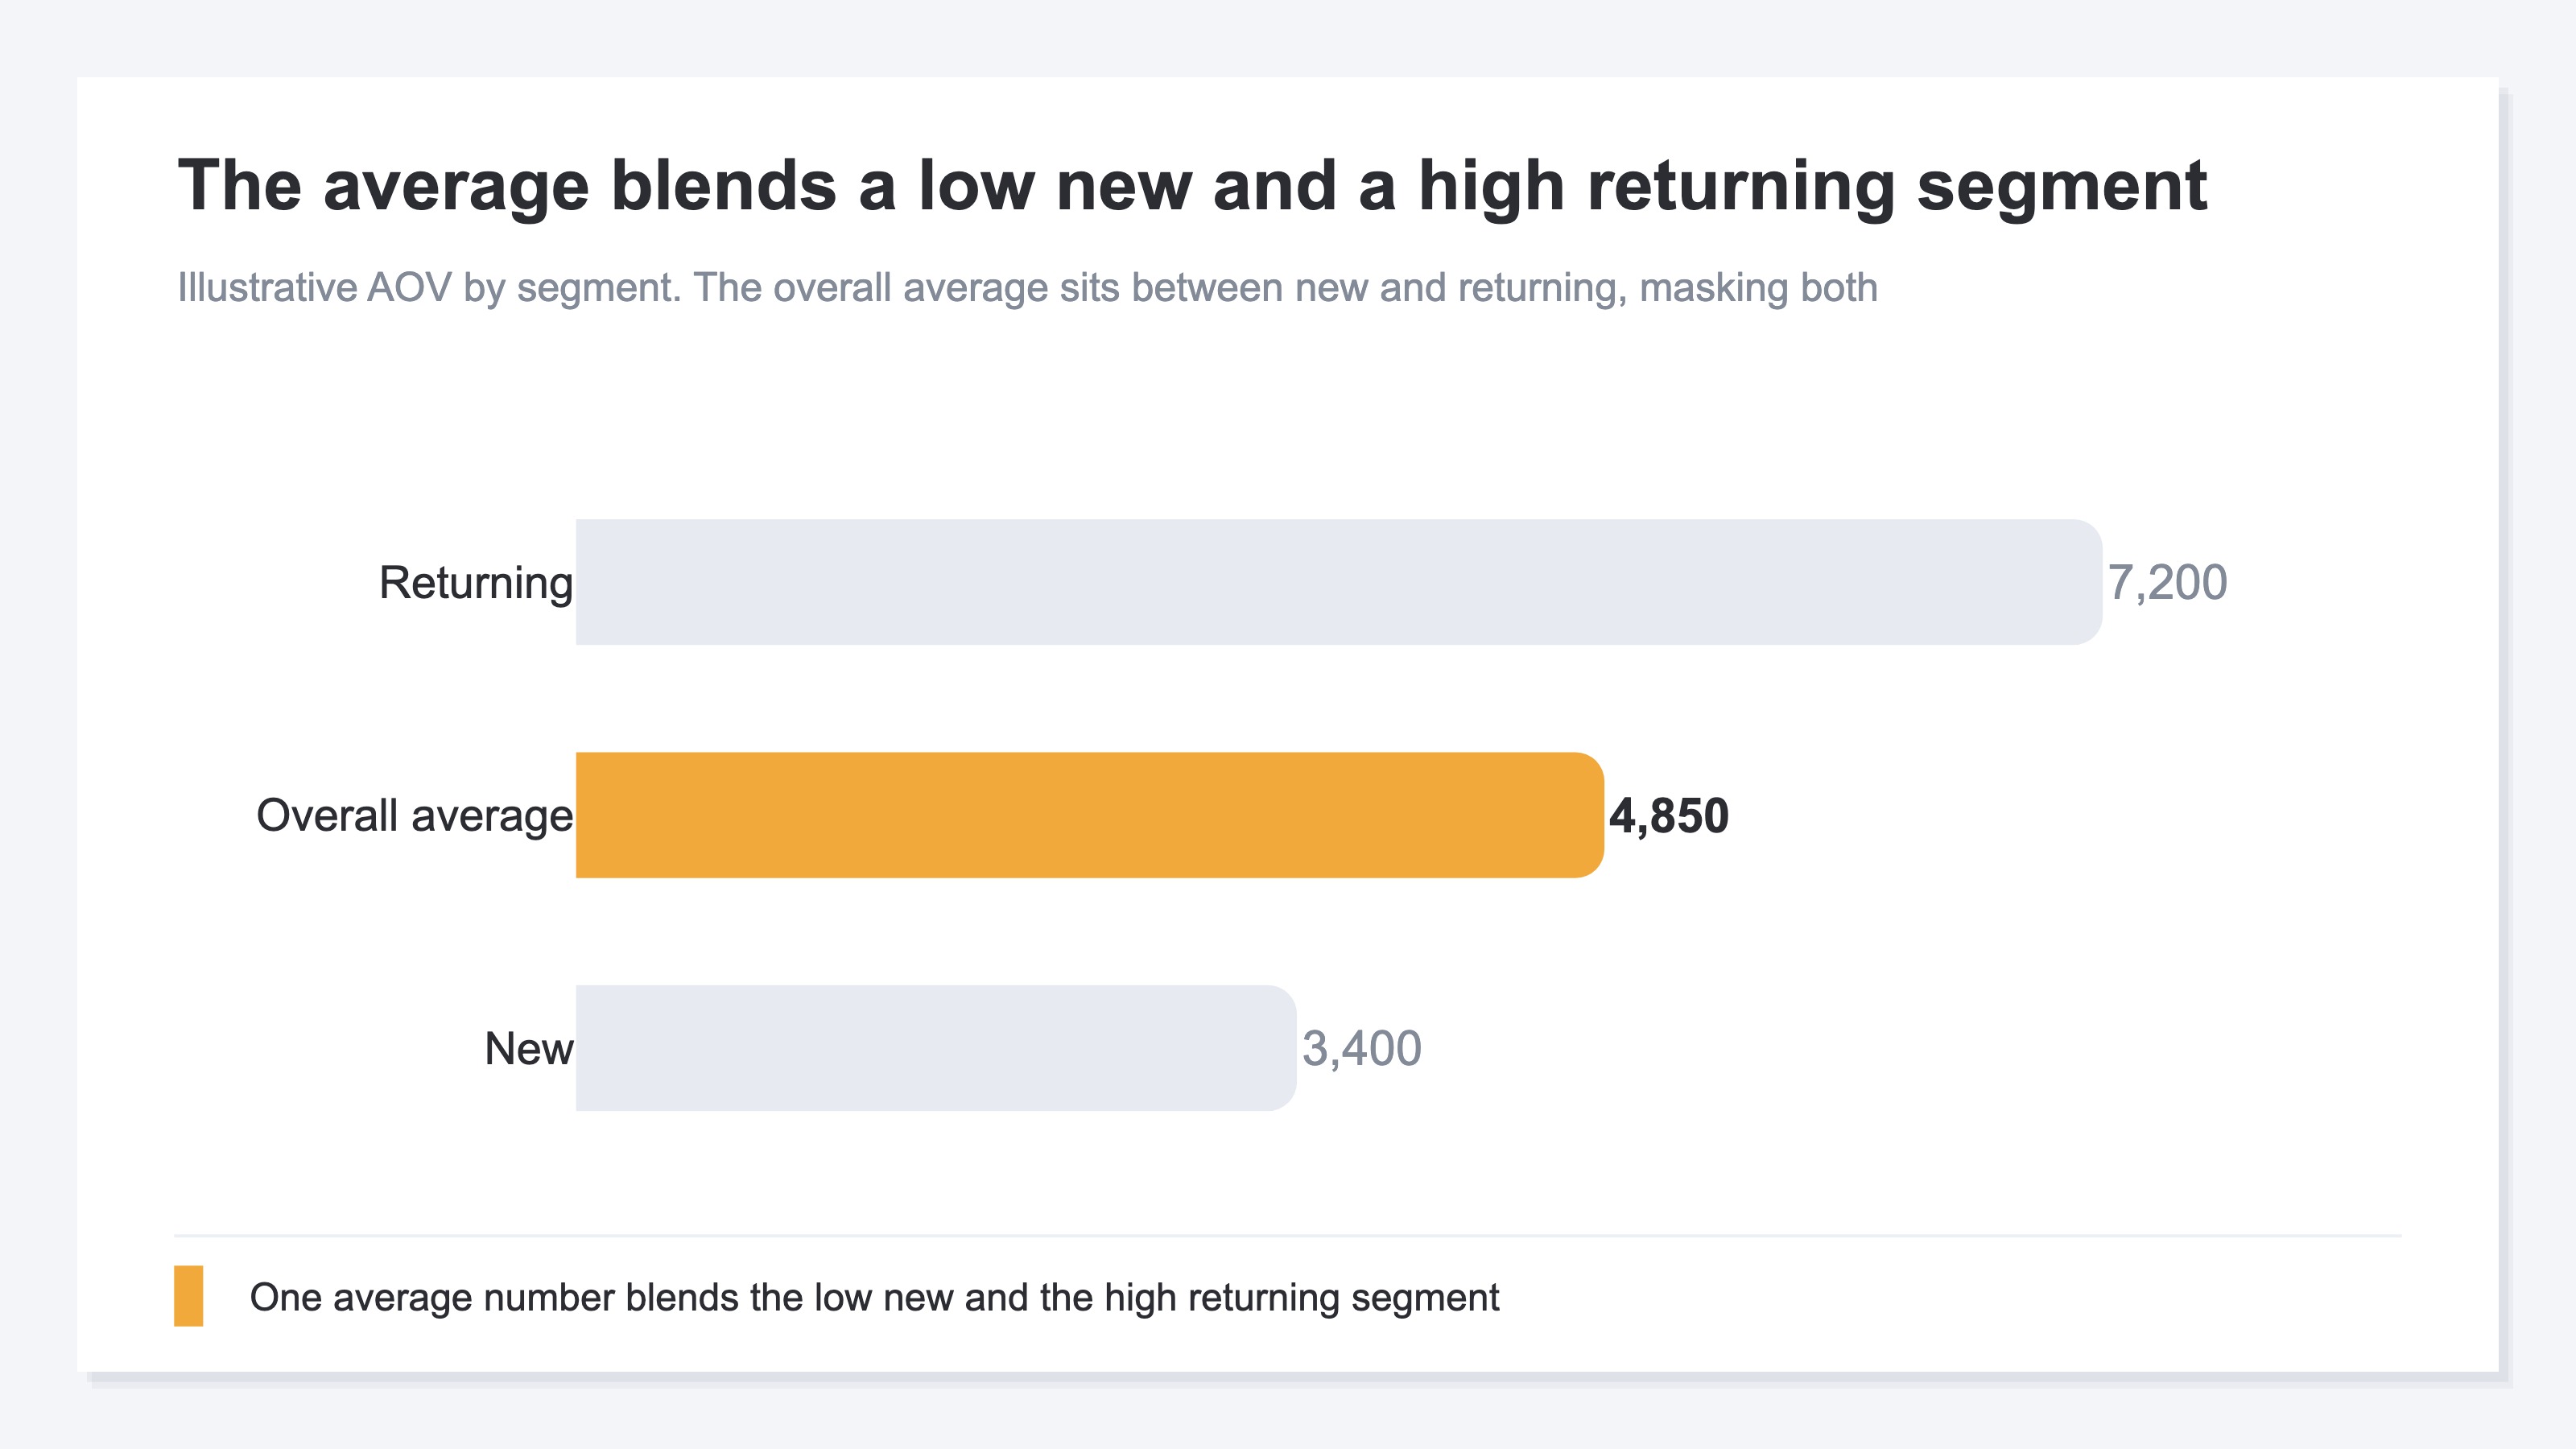
AOV is the average revenue per order. You find it by dividing revenue by the number of orders, so customers of completely different kinds all dissolve into a single number. A first-time visitor who buys one item to try you out, and a returning customer who has bought many times and buys in bulk, have wildly different order values. An average that blends these two groups reflects the reality of neither.
The real trouble is when the average doesn't "fail to rise" but instead "appears to fall." Push your traffic harder with ads or articles and new customers pour in. New customers are a low-value group, so when their share grows, the overall average drops even if returning customers' order value hasn't changed at all. Read that as "the AOV measures aren't working" and you risk hitting the brakes on traffic growth that's actually succeeding. From the average number alone, you can't separate whether it moved because of a change in order value or a change in the customer mix.
So if you're hunting for the cause of a flat AOV, staring at one clouded average number won't give you the answer. You start by splitting the average into meaningful groups.
2. Spot the segment dragging it down#
The key to spotting the cause is to split the average with two lenses. One is new vs. returning, the other is device. Just separating these two brings the differences hidden behind the average into clear view.
The new-vs-returning lens works best. At most stores, new customers' AOV comes in lower than returning customers'. A customer with no relationship to you yet won't suddenly make a big purchase. Look at AOV by segment here and the cause of a flat average splits cleanly into "new customers' value is simply low" versus "even returning customers' value has fallen." The former points you toward tactics that raise the first-time order value of new customers; the latter, toward checking whether returning customers' bulk buying has thinned out. Where the cause lives changes the tactic entirely.
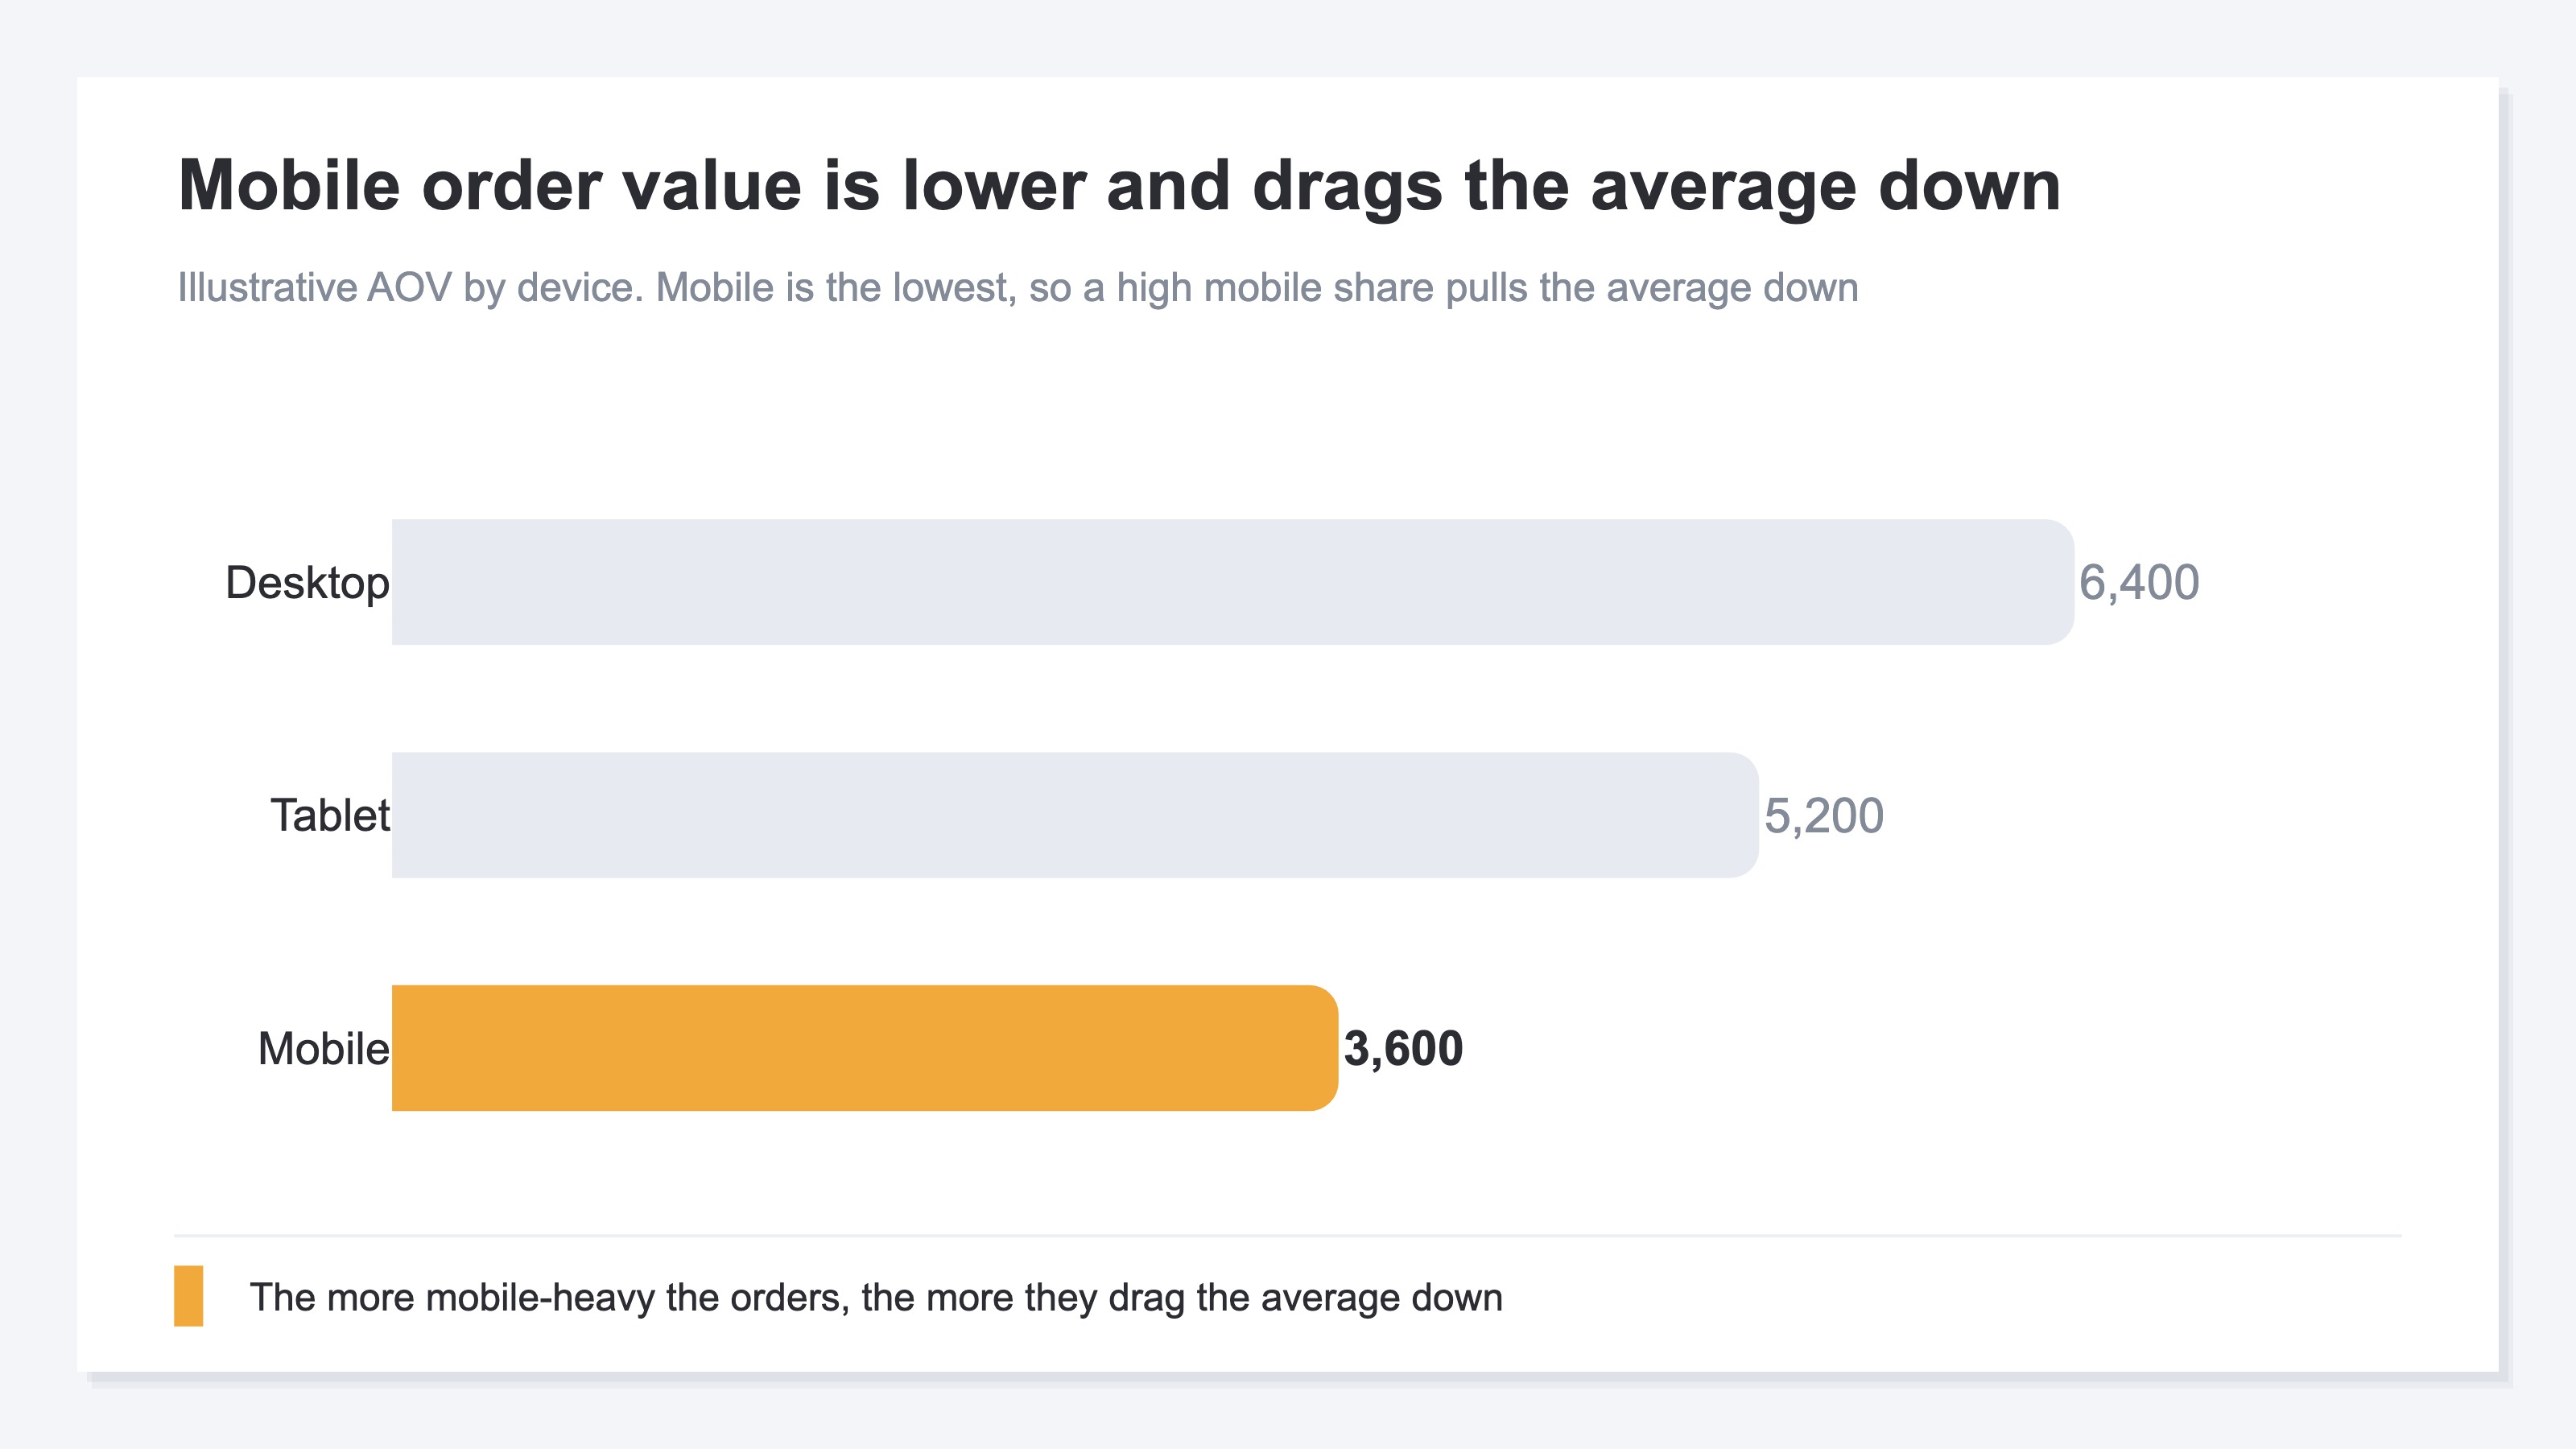
The other is the device lens. People who buy on a phone and people who buy on a desktop often have different order values per purchase. A phone has a small screen, ill-suited to browsing and comparing carefully, so order values tend to run lower. The more phone orders grow, the more the overall average gets pulled down toward them. Look at AOV by device and you learn whether a falling average is really a manufactured decline driven by a rising mobile share.
One word of warning here. View these two lenses separately. Multiply them together into fine slices like "mobile new customers only" and each segment gets too small, leaving you at the mercy of random ups and downs. First cut once by new vs. returning, then once by device, each on its own. The big read on the cause comes almost entirely from those two single cuts.
3. Which segment to fix first#
Once you've spotted the segment dragging it down, the next thing is order. Try to fix every cause you found at once and they all end up half-done. Narrow it to one.
The criterion for narrowing is a cross of two axes. Put AOV on the vertical and the segment's share of total orders (volume) on the horizontal, and split it into four cells. What you target is the cell that's high in volume and low in AOV. That's the group with many people but low value per person — in other words, the single biggest cause pulling the overall average down hardest.
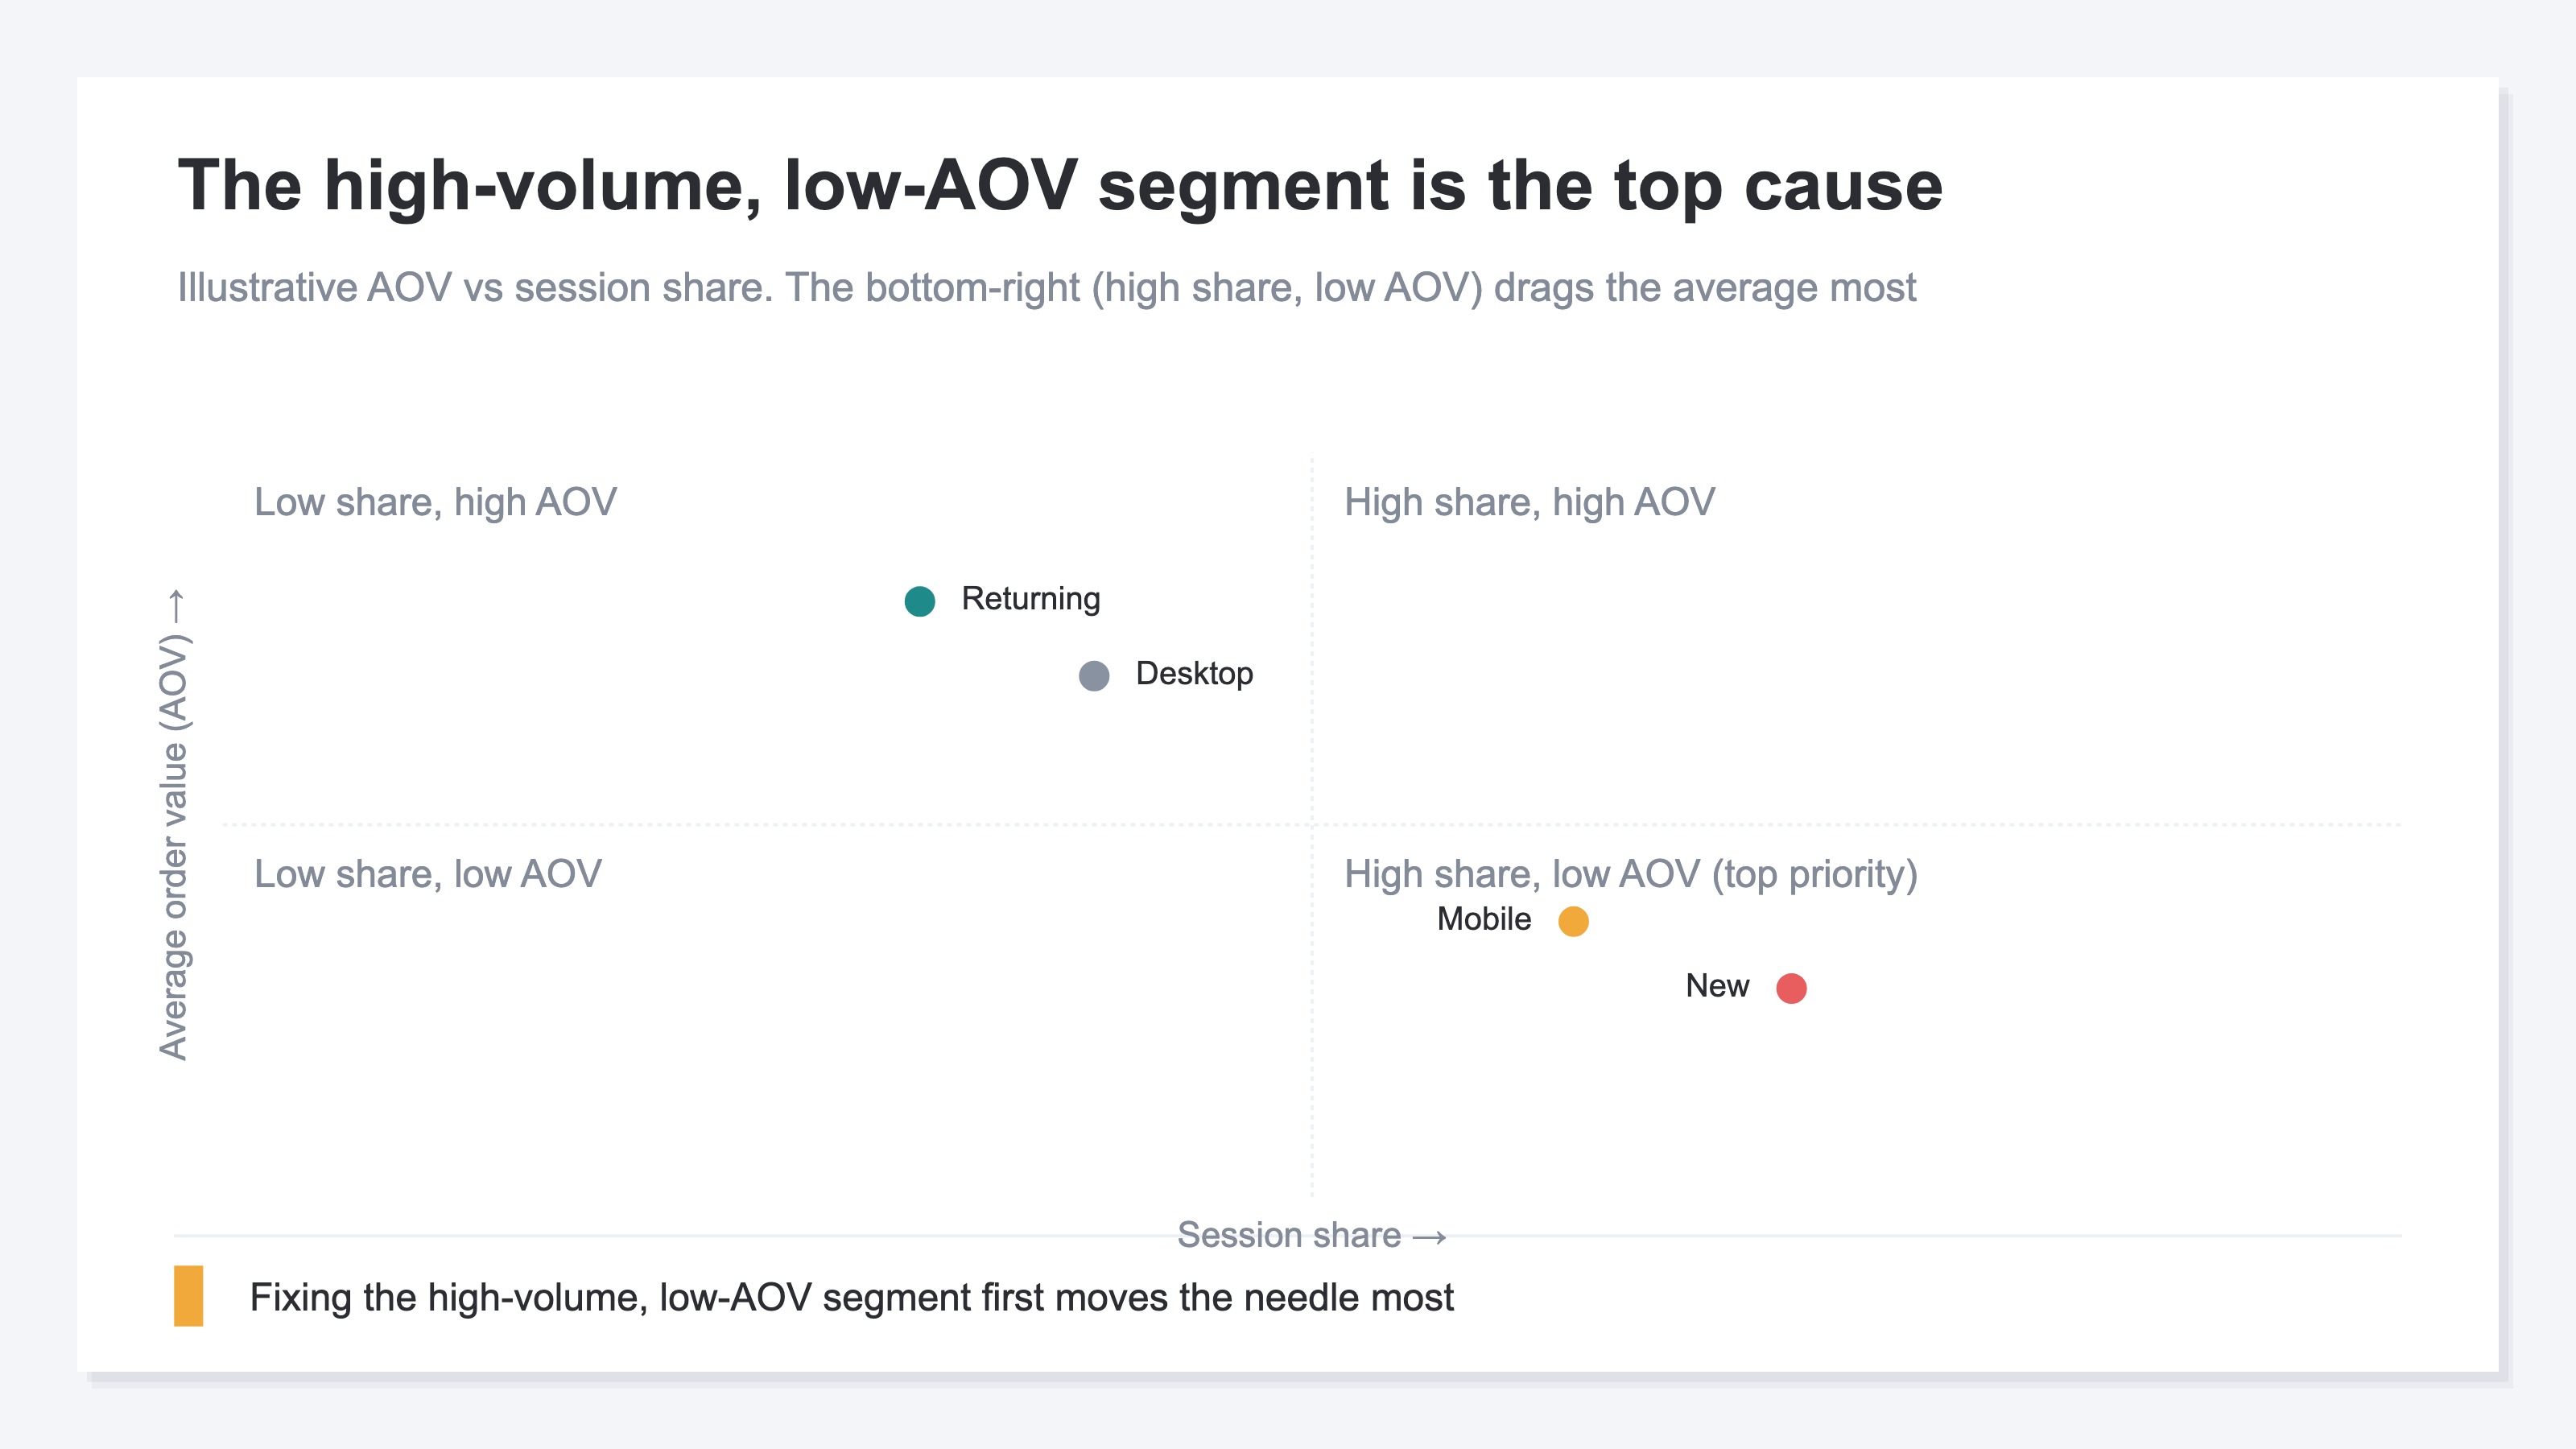
Say you find the lowest AOV belongs to "mobile new customers." If that's only 3% of all orders, fixing it barely moves the whole. Conversely, a segment whose value is only somewhat low but that makes up half of all orders — a slight lift there becomes a large difference in revenue. Don't jump at low AOV alone; multiply it by volume and rank by "how much fixing it would matter." That's the trick to not wasting your limited time.
Let me make one boundary clear. What this article covers is diagnosis only — where the cause lies. How to actually raise a found segment's order value — bundle deals, a free-shipping minimum, steering toward subscriptions — those tactics are laid out separately in "How to raise average order value." If you want to see how total revenue splits between new and returning customers, "Splitting revenue between new and returning customers" is the entry point; for how to use AOV versus the similar metric of revenue per session (RPS), see "RPS versus AOV."
The idea itself isn't hard. What's hard is keeping it up every time. New or returning, which device, which period — you have to flip the segment axis one by one in your analytics tool and redo the tally each time. On top of that, many tools don't offer AOV as a headline metric, so it won't appear unless you build the "revenue divided by orders" calculation yourself. A simple idea, yet the effort grows with every angle you want to see.
RevenueScope's solution
When you try to hunt down the cause of a flat AOV, you end up against the same wall. You know the cause shows up if you read it by segment, not the average — yet flipping axes by hand across new vs. returning, device, and period, and recalculating a metric that's never made the headline, is heavy enough that you run out of energy before you reach the actual diagnosis.
RevenueScope holds that split from the start, as AOV by segment. It outputs AOV separately for new and returning customers (display uses demo data), so you can see in one screen which group is pulling the overall average down, and by how much. Ask it, and it comes back like this.
| Segment | AOV | Session share | Revenue |
|---|---|---|---|
| New | ¥3,400 | 62% | ¥2,108,000 |
| Returning | ¥7,200 | 38% | ¥2,736,000 |
| Overall average | ¥4,850 | 100% | ¥4,844,000 |
The most telling read in this table is that the overall average of ¥4,850 reflects the reality of neither group. New customers (¥3,400) sit far below it, returning customers (¥7,200) far above. Watch the average alone and try to "raise AOV," and you'd really be prescribing the same medicine to two groups of different natures. From here the next move comes into view: new customers make up 62% of all sessions — the bulk of the volume — yet their value is low, so the first thing that will work is a tactic to raise new customers' first-time order value. Flip to the device view and you can trace, on the same screen, whether those low-value new customers are skewed toward mobile.
Let me make one thing clear. What RevenueScope outputs is AOV, conversion rate (CVR), and revenue per session (RPS) by segment, along with their breakdowns. It does not output profit after cost, or a customer's lifetime value (LTV). It assembles the material for where the cause lies, but the final call on how to move that group is yours.
FAQ#
Q1. My average AOV dropped after I pushed traffic harder. Does that mean the campaign was bad?
Don't conclude that right away. Pushing traffic brings in more low-value new customers, so the overall average falls even when returning customers' value hasn't changed. That's actually a sign your traffic growth is working. Look at AOV split by new and returning, not the average. If returning customers' value is holding, the campaign is, if anything, working.
Q2. The finer I split segments, the better I understand the cause — right?
Too fine and it gets harder to read, not easier. Multiply axes into slices like "mobile new customers, last month only" and each segment's order count shrinks, leaving you at the mercy of random swings. Start by cutting once by new vs. returning and once by device, each on its own. The big causes show up almost entirely from those coarse cuts.
Q3. I found several segments behind the cause. Which do I fix first?
Don't pick by low AOV alone — multiply it by the segment's share of total orders (volume). Fixing a low-value group with few people barely moves the whole. Start with the group that has both many orders and low value. That's where fixing it matters most.
Summary#
The reason a flat AOV keeps its cause hidden is, usually, that you're watching the site-wide average. An average melts low-value and high-value groups into one, hiding which is holding it down. And when new customers surge the average naturally falls — misread that as "value dropped" and you'll stop the very traffic growth that's working.
The cause appears the moment you split the average by new vs. returning and by device. Once you've found it, don't try to fix everything — start with the segment that has both many orders and low value. Begin by taking your recent AOV and splitting it into just two, new and returning. Split one average into two and the cause that wouldn't move — where it actually lives — shows its face clearly.
See which ads actually drive revenue, at a glance
Free up to 5,000 sessions/month, AI analyst included. No credit card required. Up and running in 5 minutes.
References#
- [1] Ministry of Economy, Trade and Industry "Survey on Electronic Commerce" (2024)
- [2] Shopify "What Is Average Order Value (AOV)?" (URL unconfirmed)
- [3] Google Analytics Help "About segments" (URL unconfirmed)
- [4] Baymard Institute (2024)