Traffic from Google search is down 30% against the same month last year. Before you report that number, there is one thing to confirm: whether the cause sits in your own work, or whether Google's search environment changed. Get the two mixed up and you spend a month rebuilding pages that never needed fixing.
Contents
TL;DR#
- Start from rewriting pages on the day you see a year-over-year decline and, in the case where you never lost position, the move swings at nothing
- Isolation needs only this: look at impressions in Google Search Console, then check average position. If position held, it isn't a failure of your work
- A changed environment leaves two markers: whether AI-referred traffic exists, and the difference in how branded and non-branded keywords fell
- In one example from a fictional store, search clicks were down 30% against the same month last year. Branded terms held flat in total while non-branded alone fell about 40%, and the top keyword changed hands
- What Google Search Console answers reaches only as far as where the cause sits. Which decline cost how much revenue gets its order only when the landing pages of the keywords that lost clicks are joined to the measured revenue of those pages
1. The First Move on a Down Year Is to Go Back to Last Year#
The first move most teams pick on the day they see a year-over-year decline is restarting the work they did last year and dropped this year.
Turn the paused ads back on. Push publishing frequency back up to last year's level. Revert the titles you rewrote. The thinking is that getting closer to last year's state should bring back last year's numbers.
When this opening move misses, it ends with nothing learned. If the environment changed, the same input as last year does not return the same result as last year. And restarting the work costs money and effort, and judging whether it worked takes another month on top. Two months in, you are writing the year-over-year report again with the location of the cause still unknown.
The order in which to confirm is fixed. Whether you lost position comes first. If position is about the same as last year, content quality is not what fell. If you keep appearing at the same position and traffic is still down, what changed is something other than your own pages.
The phenomenon itself, position held while clicks fall, is covered in detail in Same rank, fewer clicks. This article starts one step before that, at the isolation.
2. Isolation Starts With Impressions#
Taking the fall in clicks as the starting point, look at impressions, then check average position. These are the two you compare against the same month last year.
The Search performance report in Google Search Console shows these three plus click-through rate[1]. Impressions are how often a link to your site was viewed in Google, clicks are how often that link was clicked, and average position is the relative ranking of the link[2].
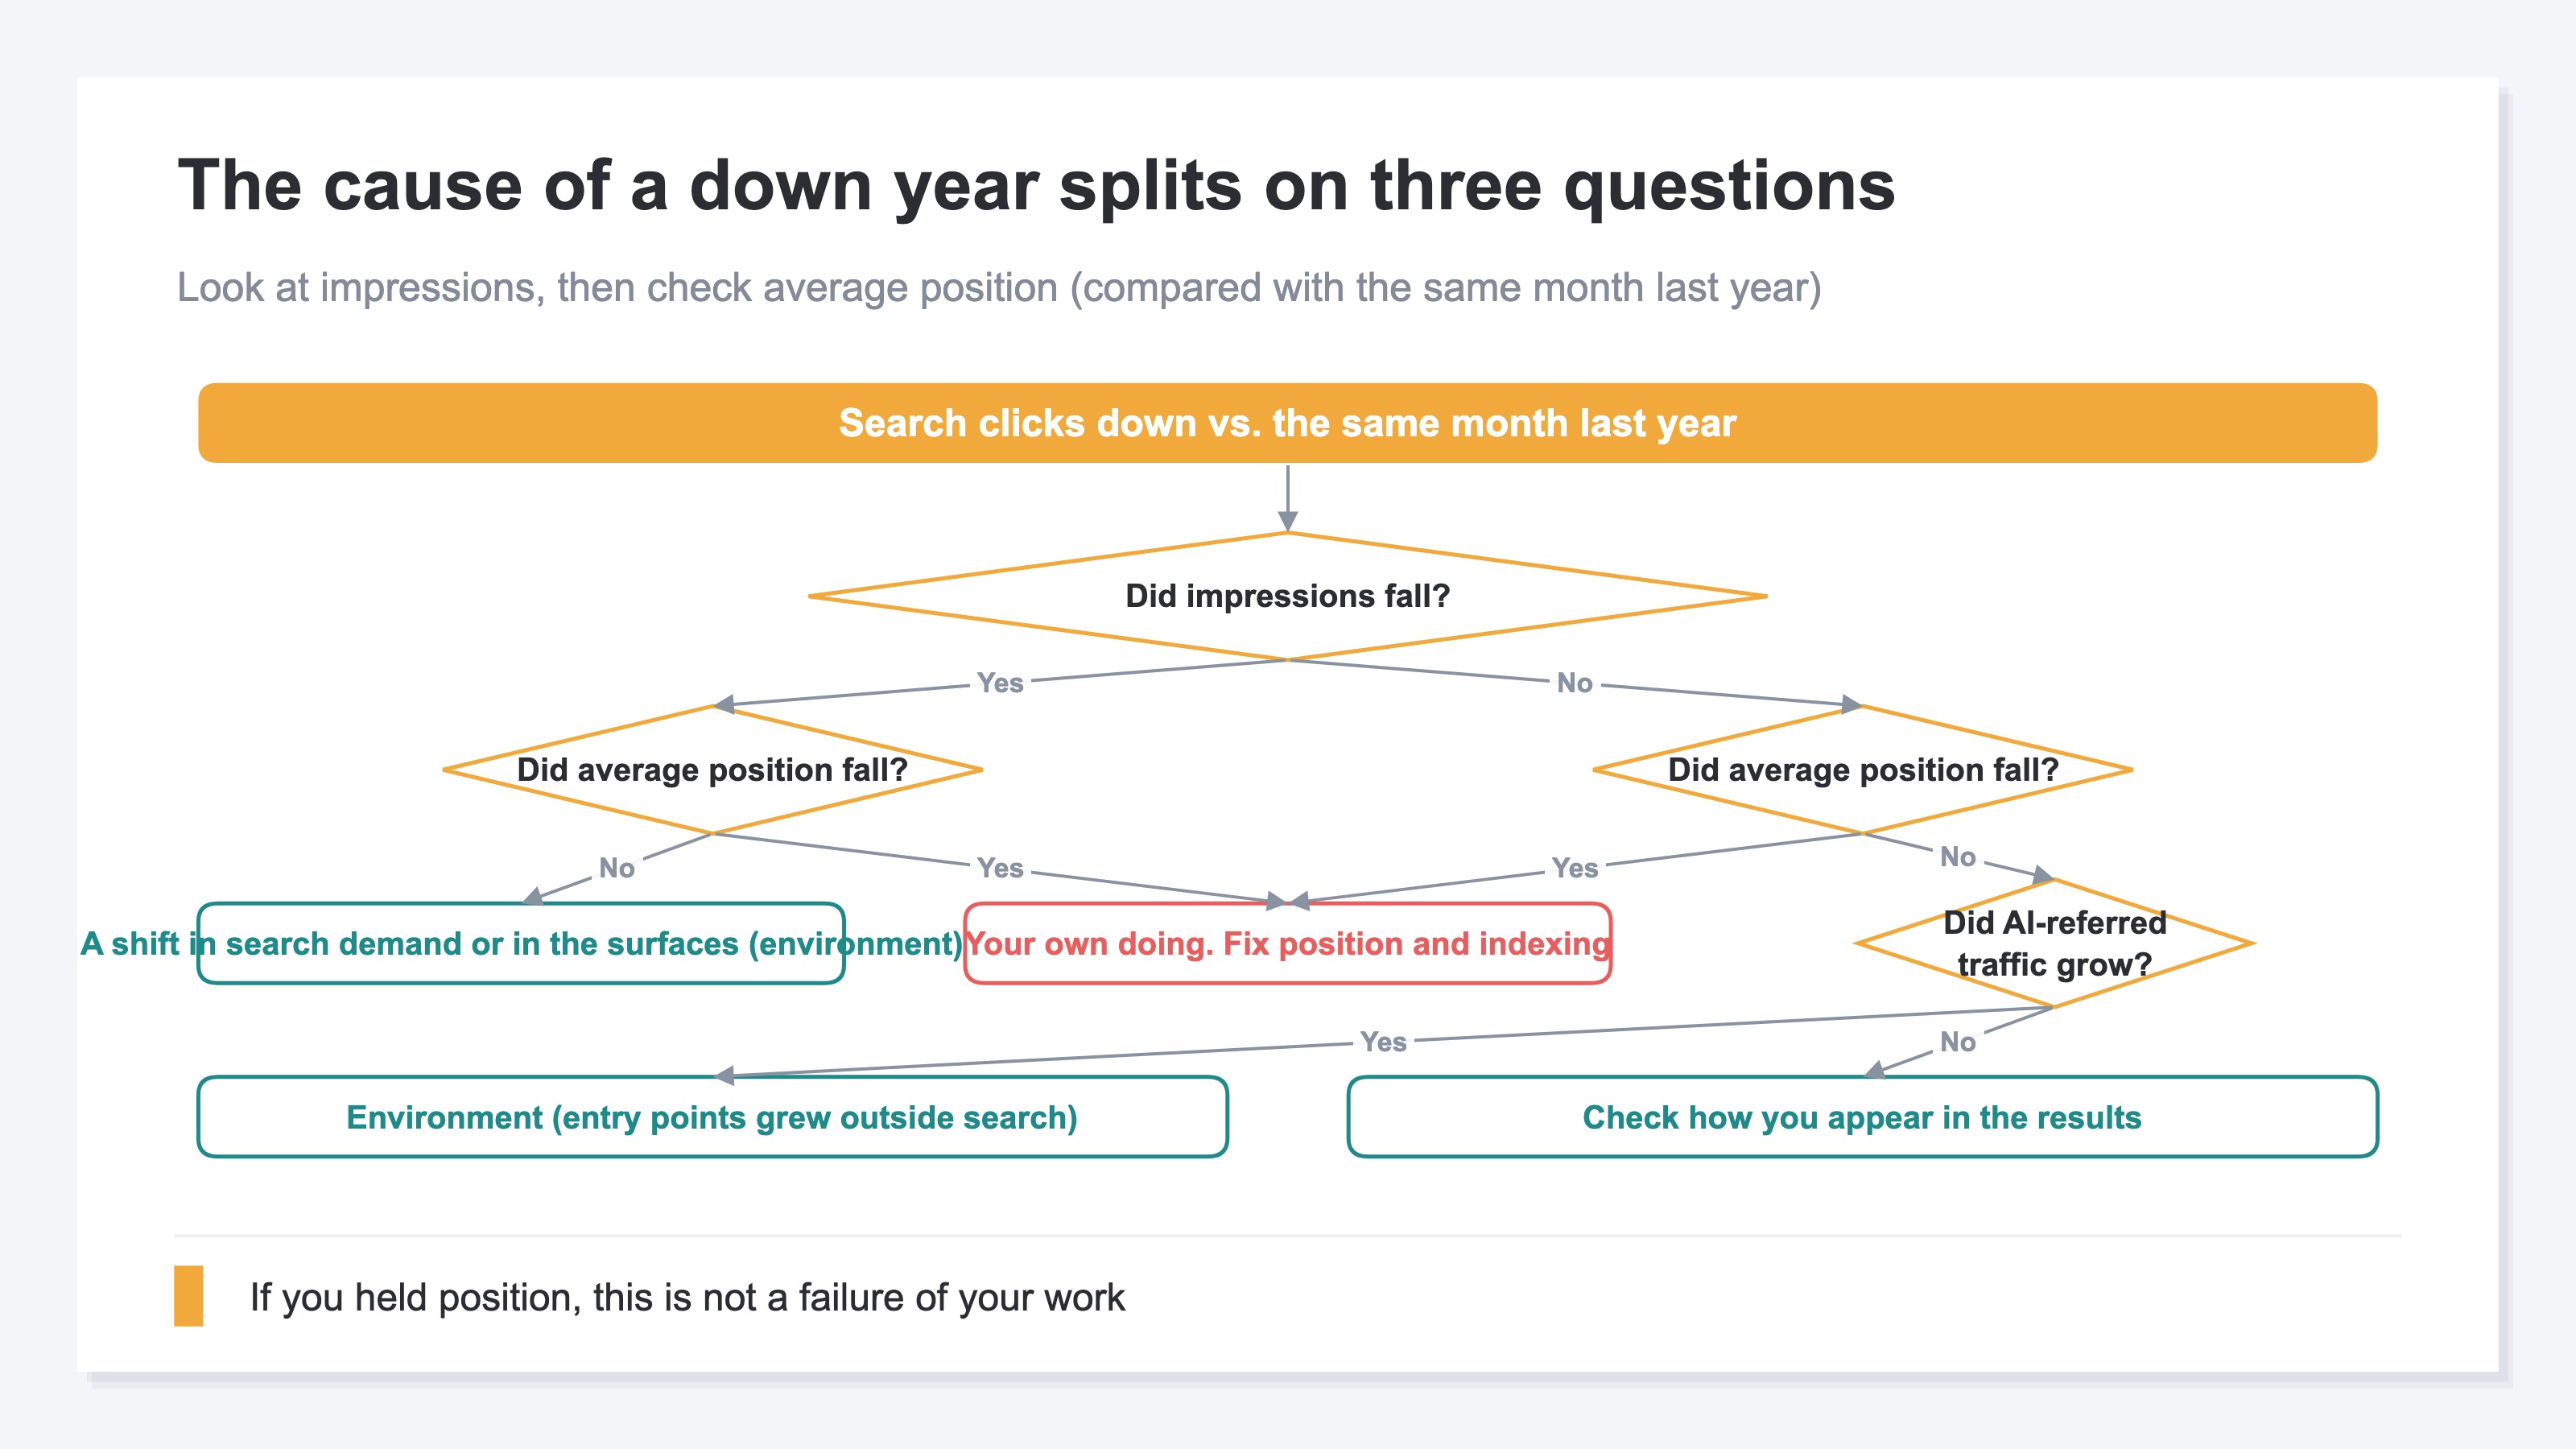
The order carries meaning. Impressions are the number of times you appeared in the results at all. If that number fell sharply, the story is not that you were not chosen, it is that the chance to appear got smaller in the first place.
That said, a fall in impressions does not let you call it the environment on the spot. When average position drops hard, or when pages fall out of the index, impressions fall in a block as well. A fall in impressions is exactly the case where you should check average position first. If position held while only impressions fell, that is the environment. Either fewer people searched, or the surfaces shown in the results changed, and both are something other than the quality of your pages. If position is what fell, the thing to fix is on your own side.
Where impressions are flat with last year, or higher, and clicks alone fell, you are no longer being chosen inside the results. This shape appears when an AI summary answers the question in full at the top of the results, or when other search features occupy the space above you. How to read the case where impressions have instead risen is covered in Search Console impressions spiked: Google's AI Mode is mixed in.
Average position is what you check because only a fall there makes this a story about your own side. If you lost position, either a competitor moved above you or the page's evaluation dropped. Only at this point do rewriting and rebuilding come onto the list of moves. Conversely, if position held, this is not a failure of your work.
One assumption to add. What Google Search Console aggregates is Google search only, and traffic from Bing or Yahoo! search is not included. Clicks here and sessions in an analytics tool are also aggregated from different sources, so they never match exactly. Neither gets in the way of the isolation, but as figures to put in a report they are different things.
3. Two Markers That Confirm the Environment Changed#
Whether the environment changed can be confirmed with two markers: AI-referred traffic, and the difference in how branded and non-branded keywords fell.
The first is AI-referred traffic. Visits that reached the site from answers in ChatGPT or Gemini, absent last year and present this year. In that case, the entry point for readers has grown outside the search results. Even with search traffic down, total visits to the site are not necessarily down by the same amount.
That said, AI assistants do not always hand over a mark of origin. What you can capture here is only the portion that left a mark. Read this number as the lower bound of the actual AI-referred traffic. How this traffic came to be treated on the GA4 side is laid out in GA4 referral traffic dropped in May.
The second is the difference in how they fell. If your own work is the cause, the keywords tied to the pages that lost position fall together. The decline gathers around specific pages. If the environment changed, the shape of the fall is different. Keywords whose answer fits in a few lines are easily satisfied by the AI answer alone, which puts them in position to fall first. Branded keywords, where people search by store name or product name, tend to hold, because reaching that store's page is the point of the search itself.
Where it is the branded keywords alone that fell, the cause is a different one from anything covered here. That shape is handled in Why branded search is falling.
Google explains performance in search including AI experiences this way. Prioritizing click counts too heavily may leave you unable to draw out the full value of the search traffic that really matters. On top of that, it advises weighing conversion metrics such as sales and signups as well[3]. Build the year-over-year report on click counts alone and you head the opposite way from that advice.
4. Split by Period, and the Top Keyword Had Changed Hands#
Build the same table split by period and it becomes clear that the fall is not even.
Here is one example from Fictional Store T (coffee beans sold online). Clicks for each search keyword, split into the same month last year and the same month this year, look like this.
| Search keyword | Type | Same month last year | Same month this year |
|---|---|---|---|
| best coffee beans | Non-branded | 3,000 | 1,200 |
| how to store coffee beans | Non-branded | 2,200 | 1,300 |
| dark roast coffee beans online | Non-branded | 1,600 | 1,300 |
| how to grind coffee beans | Non-branded | 1,200 | 1,200 |
| T Coffee | Branded | 1,400 | 1,600 |
| T Coffee subscription | Branded | 600 | 400 |
| Total | All | 10,000 | 7,000 |
The total moves from 10,000 to 7,000, down 30% against the same month last year. This far it matches the symptom at the top of the article.
The contents are not even. Last year's top keyword was "best coffee beans" at 3,000 clicks. This year it fell to 1,200, and the top spot changed hands to the branded keyword "T Coffee" at 1,600. Grouped by type, non-branded went from 8,000 to 5,000, a fall of about 40%. Branded stayed at 2,000.
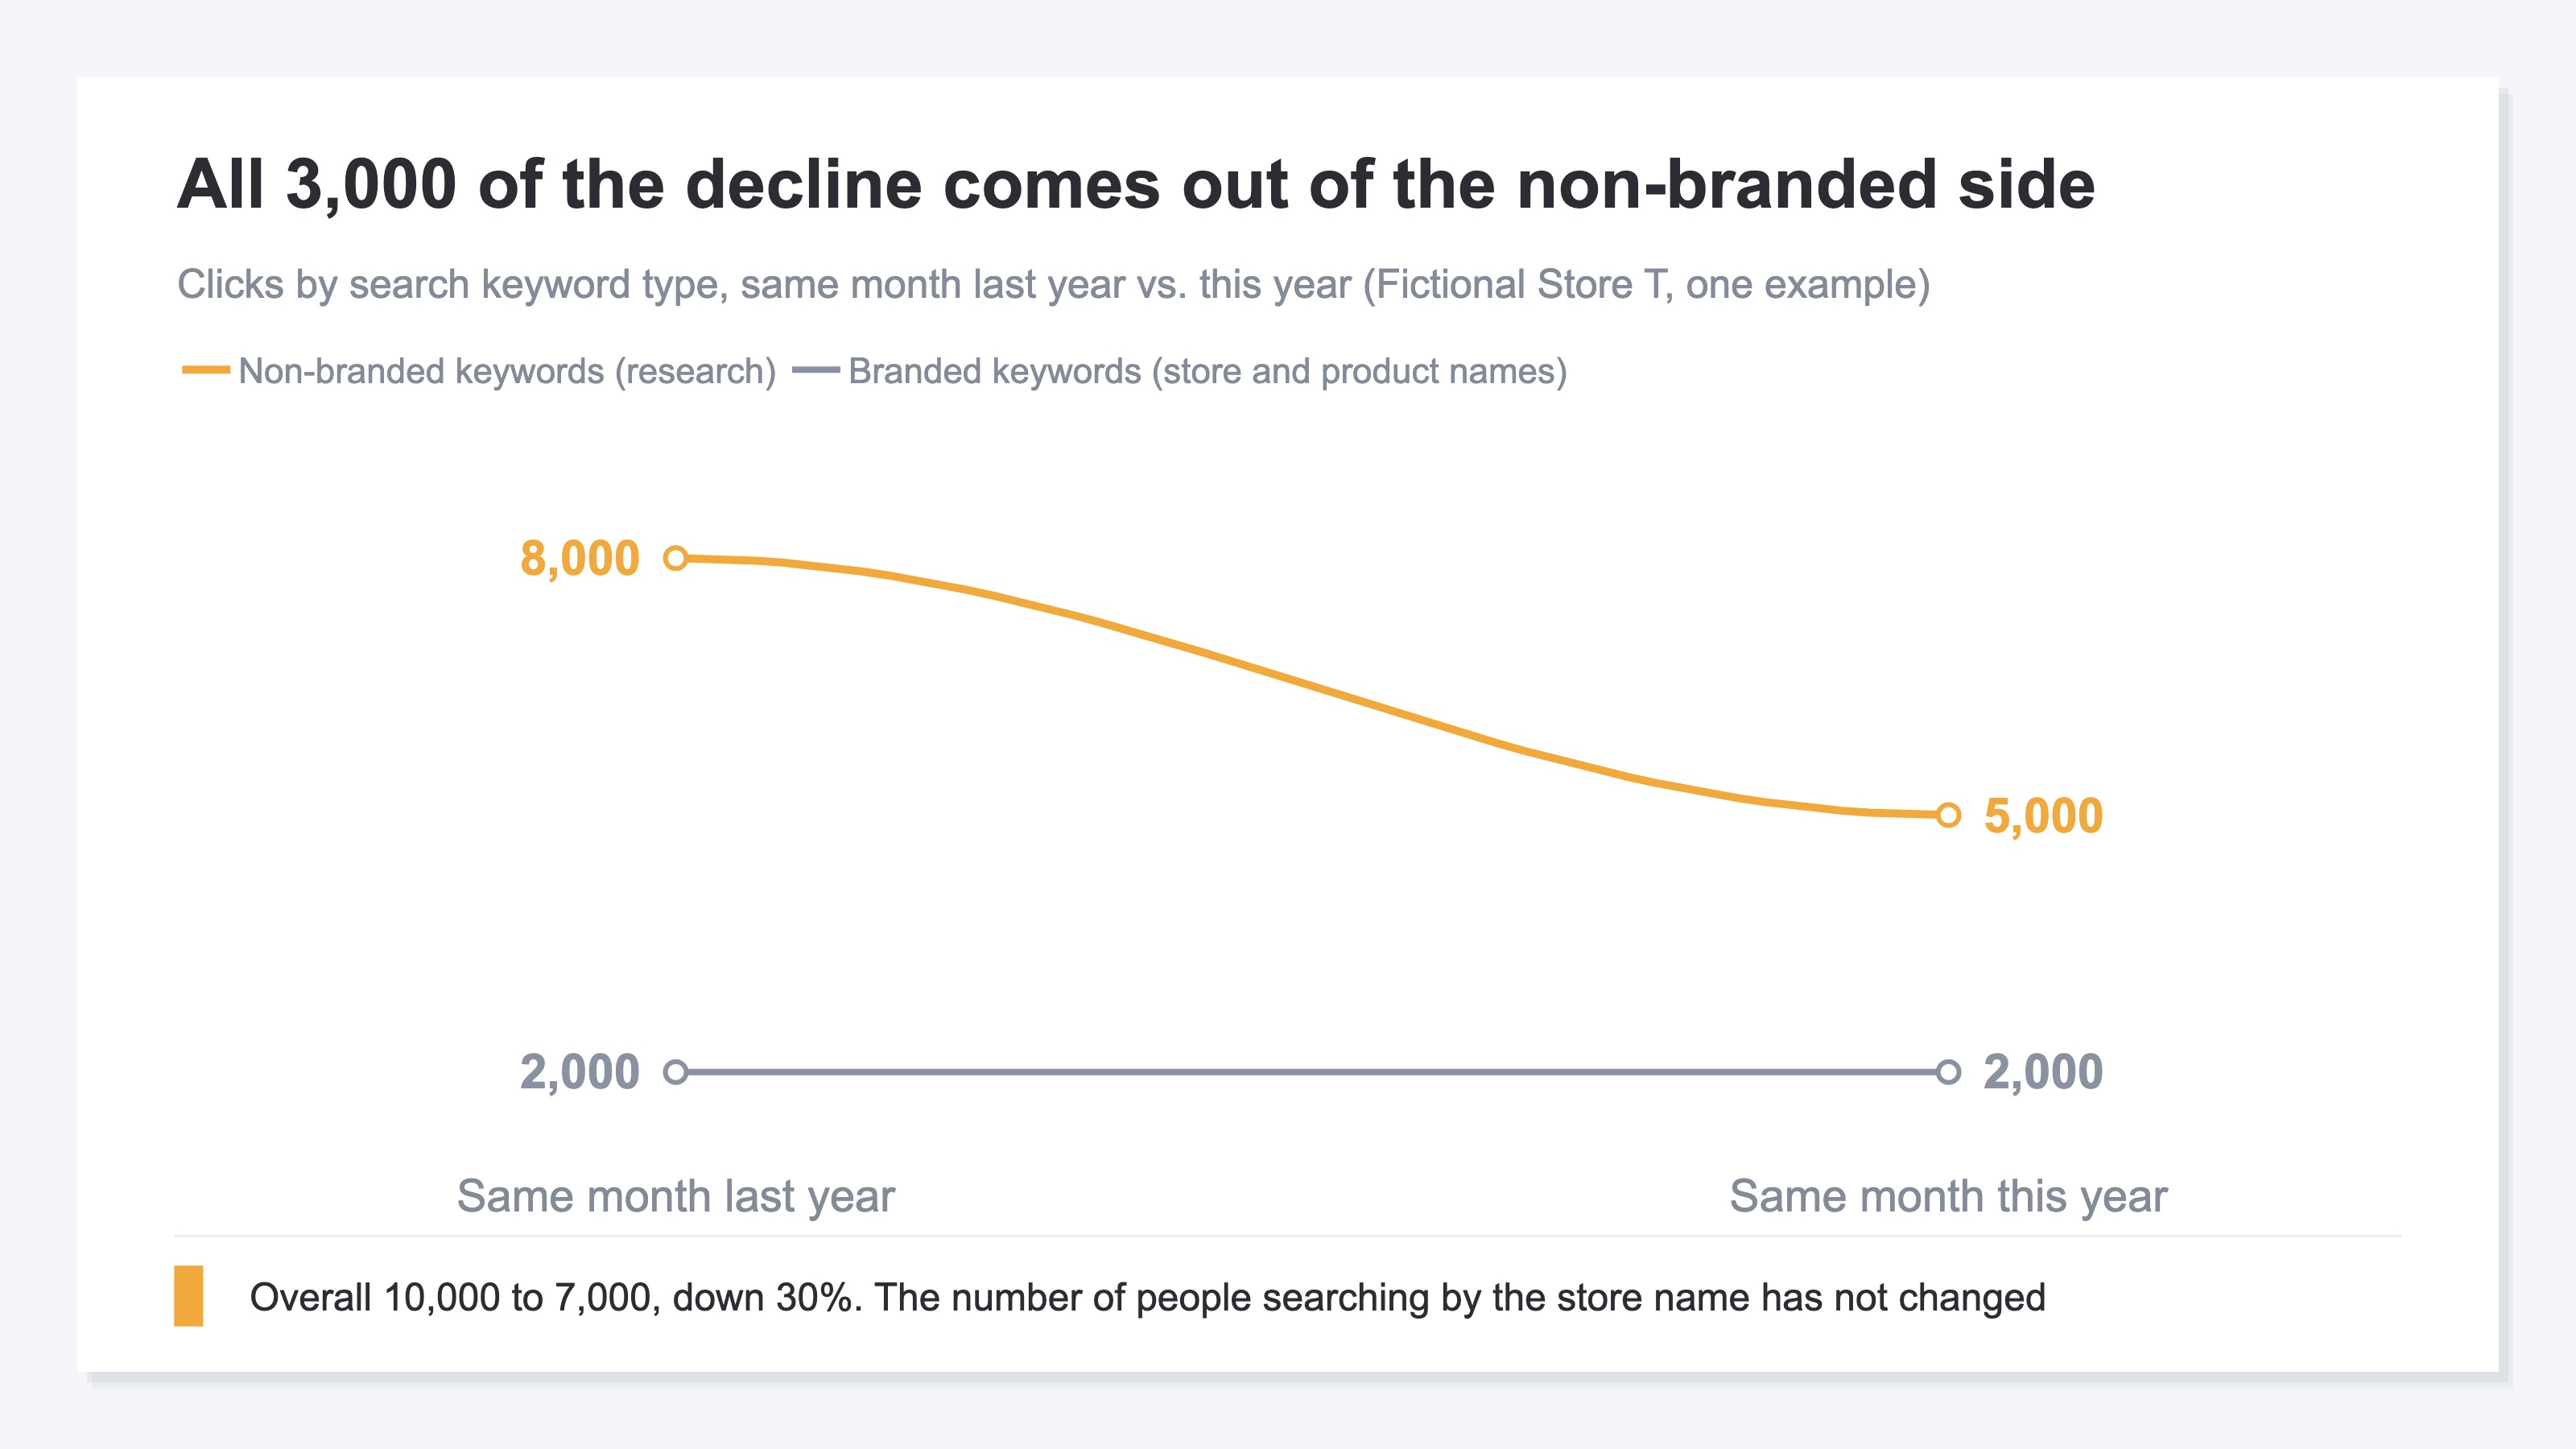
All 3,000 of the decline came out of the non-branded side. Branded held flat at 2,000 in total. In the breakdown, though, "T Coffee" gained 200 and "T Coffee subscription" lost 200, so the flat total was the result of those two cancelling each other out. The number of people searching by the store's name has not fallen. What fell is the route people took when they did not know the store yet and came in to look something up. Where the shape is this one, the cause is not how well the pages were made.
What to be careful about is not deciding from this year's table alone. Looked at on its own, this year's table makes the site look strong on branded terms and weak on research terms. Decide the allocation of content or budget on the basis of a single point in time and you will redo the same decision next year, when the non-branded side comes back. What you decide with is not one table but the difference between two periods built in the same shape.
Note that where revenue broke down before traffic did, the entry point of the isolation changes. That order is laid out in How to pinpoint why your ecommerce revenue dropped.
The answer is already out: the research-intent, non-branded keywords fell. But what belongs in the year-over-year document is not the cause, it is the order in which to start the recovery. The table above does not tell you how much revenue those 3,000 lost clicks took with them. Next to the click counts you need which page each click landed on, and how much that page was selling.
RevenueScope solution
Which of the lost traffic cost you revenue gets its order from the measured revenue of each landing page. RevenueScope measures purchases with a single tag placed on your site and assigns that revenue to the page the buyer first entered from. Connect Google Search Console and, next to the click count for each search keyword, it shows the pages actually being landed on for that keyword. You can follow it in order: the keyword that lost clicks, its landing page, that page's measured revenue.
Amounts come out measured at the page level, not at the keyword level. People enter a single page from several keywords, so that page's revenue cannot be split out per keyword. Landing revenue is an assignment to the entry page, so purchases made after browsing around the site also land on the entry page.
At the page level, it displays the trend of average position on daily and weekly graphs. Whether you are holding position or sliding down bit by bit can be confirmed on the same screen. AI-referred traffic is shown as one channel too, with revenue alongside.
Connect to RevenueScope from ChatGPT or Claude and the AI reads your own ecommerce data before it answers. That page-level prioritization requires neither a complex setup nor SQL. Ask it to take the pages whose search clicks are falling and put them in order of landing revenue, and it comes back with the landing pages and their measured landing revenue side by side. The comparison RevenueScope adds automatically is against the immediately preceding period of the same length.
The one table for the year-over-year document you build yourself from here. Click counts for the same month last year and this year come from Google Search Console, this year's landing revenue from RevenueScope's measurement, and last year's landing revenue from last year's records. Built for Fictional Store T, it looks like this.
| Landing page (search keyword that drove it) | Clicks last year → this year | Landing revenue last year → this year | Revenue lost |
|---|---|---|---|
| Subscription signup page (T Coffee subscription) | 600 → 400 | ¥360,000 → ¥240,000 | ¥120,000 |
| Dark roast product listing (dark roast coffee beans online) | 1,600 → 1,300 | ¥480,000 → ¥390,000 | ¥90,000 |
| Recommendations article (best coffee beans) | 3,000 → 1,200 | ¥90,000 → ¥40,000 | ¥50,000 |
| Storage article (how to store coffee beans / how to grind coffee beans) | 3,400 → 2,500 | ¥30,000 → ¥20,000 | ¥10,000 |
Note: the table above is one example (illustrative), assembled for explanation. The screen behind the button aggregates the sample data of the sample store (refreshed daily), so both the pages and the amounts shown there are different ones.
The bottom row shows exactly why amounts can only be produced at the page level. People come into the storage article from two keywords, "how to store coffee beans" and "how to grind coffee beans," and which of them gets the credit for this ¥20,000 cannot be split apart. What you know reaches this far: the people who landed on this article bought ¥20,000 this year.
What marks this case is that the page that lost the most clicks and the page that lost the most revenue are different pages. The recommendations article lost 1,800 clicks, and the revenue it lost was ¥50,000. The subscription signup page lost only 200 clicks, and yet it lost ¥120,000. Per click, the former works out to about ¥28 (just under ¥30), the latter to ¥600.
The next move is to start from the side that holds position for the signup page landed on from "T Coffee subscription." Branded terms were flat in total, but the largest revenue lost sat on this page. Set priorities by the size of the click decline and this order reverses. The storage article lost 900 clicks, and the revenue it lost was ¥10,000. Starting on it can wait.
FAQ#
Frequently asked questions#
Q. Should I compare against the same month last year, or against last month?
A. For products with seasonality, the same month last year. A comparison against last month mistakes the peaks and troughs of the season for a cause. But the same month last year also carries last year's one-off events. If there was a sale or a mention in an outside publication that month, read the figure with that portion subtracted.
Q. Impressions and average position are both unchanged, and clicks alone have fallen. What is happening?
A. You are no longer being chosen inside the search results. Either an AI summary is answering the question in full at the top, or other search features occupy the space above you. In this case rebuilding the page will not increase impressions. What to check instead is how many visits and how much revenue are arriving via AI.
Q. Can revenue be produced for each keyword?
A. Amounts come out measured at the page level. People enter a single page from several keywords, so revenue cannot be allocated to keywords. Landing revenue on the page side is a measured figure that assigns actual purchases to the entry page, and purchases made after browsing around also land on the entry page. Estimated revenue does appear alongside on the keyword side, but that is an approximation, revenue per search session multiplied by click count, and it swings toward reading low. When you decide the order of recovery, use landing revenue on the page side.
Q. I want to judge on gross profit. Is that possible?
A. What RevenueScope measures is revenue; cost of goods and gross profit are not handled. If gross margin differs widely by product, produce the order by revenue and then apply your own margins for the final call.
Summary#
The cause of a year-over-year decline splits on whether you lost position or whether the search environment changed. Look at impressions, then check average position. Compare those two against the same month last year and one of the two is all but settled. If position held, this is not a failure of your work.
A changed environment has a shape. AI-referred traffic that was not there last year is there this year. Keywords whose answer fits in a few lines fall first, and branded terms tend to hold. In the one example from Fictional Store T, behind an overall decline of 30%, non-branded alone fell about 40% and the top spot changed hands from non-branded to branded.
This far you can confirm in Google Search Console. What it does not answer starts after that. The landing pages of the keywords that lost clicks: how much were those pages selling? The size of the click decline and the size of the revenue lost do not line up.
There is only one thing to do. This week, before you build the year-over-year document, check the landing pages of the keywords that lost clicks in order of how much those pages sell. The order in which to start the recovery is decided there.
See which ads actually drive revenue, at a glance
Free up to 5,000 sessions/month, AI connection included. No credit card required. Up and running in 5 minutes.
References#
- [1] Google Search Console Help "Performance report (Search results): Overview and basic setup" (2026)
- [2] Google Search Console Help "What are impressions, position, and clicks?" (2026)
- [3] Google Search Central "Top ways to ensure your content performs well in Google's AI experiences on Search" (2025)