You want to estimate next month's revenue from your traffic. The math itself is just expected sessions multiplied by revenue per session. Forecasts still miss, and the reason is that the RPS being multiplied is the site-wide average. Change how that one number is calculated and the accuracy changes with it.
Contents
TL;DR#
- The shape of a revenue forecast is expected sessions × revenue per session (RPS). The multiplication is easy, and almost every miss comes from how RPS was calculated
- A site-wide average RPS is a number decided by the mix of traffic sources. Campaigns that grow traffic change that mix, so a forecast holding the average fixed misses more the more you do
- There are two ways to raise accuracy. Build the weights from per-channel RPS, and correct the value applied to the increment toward the new-customer side. New and returning customers can sit around 2x apart
- Place the session side on evidence, not hope. Keywords stuck between positions 4 and 20 give the increment its basis, and the forecast is held as a range rather than a single number
1. The Same 10% Traffic Lift Doesn't Give the Same Revenue#
Even when traffic rises by the same 10%, how much revenue rises with it depends on where the increase comes from. A forecast that places a single site-wide average RPS cannot carry that difference.
The math itself fits on a calculator#
The shape of a revenue forecast is a multiplication. Next month's revenue = next month's expected sessions × RPS. RPS is short for revenue per session, revenue divided by session count, and it says how much a single visit earns (see Revenue per session and how to pull it from GA4 for the details). A calculator covers everything up to here. The hard part is what you place in the RPS slot.
The average RPS assumes the traffic mix won't change#
A site-wide average RPS is an average in which the channels with the most sessions pull hardest. So when the breakdown of traffic changes, the average itself changes. Dropping last month's average straight into that slot is the same as assuming next month's mix will look like this month's.
And the campaigns that grow traffic are exactly the ones that change the mix. Spend more on ads and the ad share rises; SEO starts working and the search share rises. You are moving, under your own steam, in the direction that breaks the assumption. That is why forecasts miss in precisely the months you did something.
When placing the average actually works#
Estimating by hand with a site-wide average RPS does have conditions under which it works. First, the month's traffic mix does not shift much from the previous month. Second, return visits that lost their cookie are not being recounted as new. Third, bot visits are not mixed into the session side. Read the other way, the month you ran a campaign, the month you cannot read the effect of cookie deletion, and the month traffic jumped are all outside those conditions. The months you actually want a forecast for usually fall into one of them.
What this article covers is the part before the forecast is made. For the steps to isolate which channel was responsible after a forecast has already missed, see Traffic up but revenue flat.
2. Forecast Accuracy Is Set by How Far You Split RPS#
What sets accuracy is not how complicated the formula is, but how far you split RPS. Split it by channel, then correct the value applied to the increment toward the new-customer side, and the weights in the forecast move closer to reality.
Build the weights from per-channel RPS#
Start with the channel split. Build next month's revenue by summing, for each channel, its expected sessions × that channel's RPS.
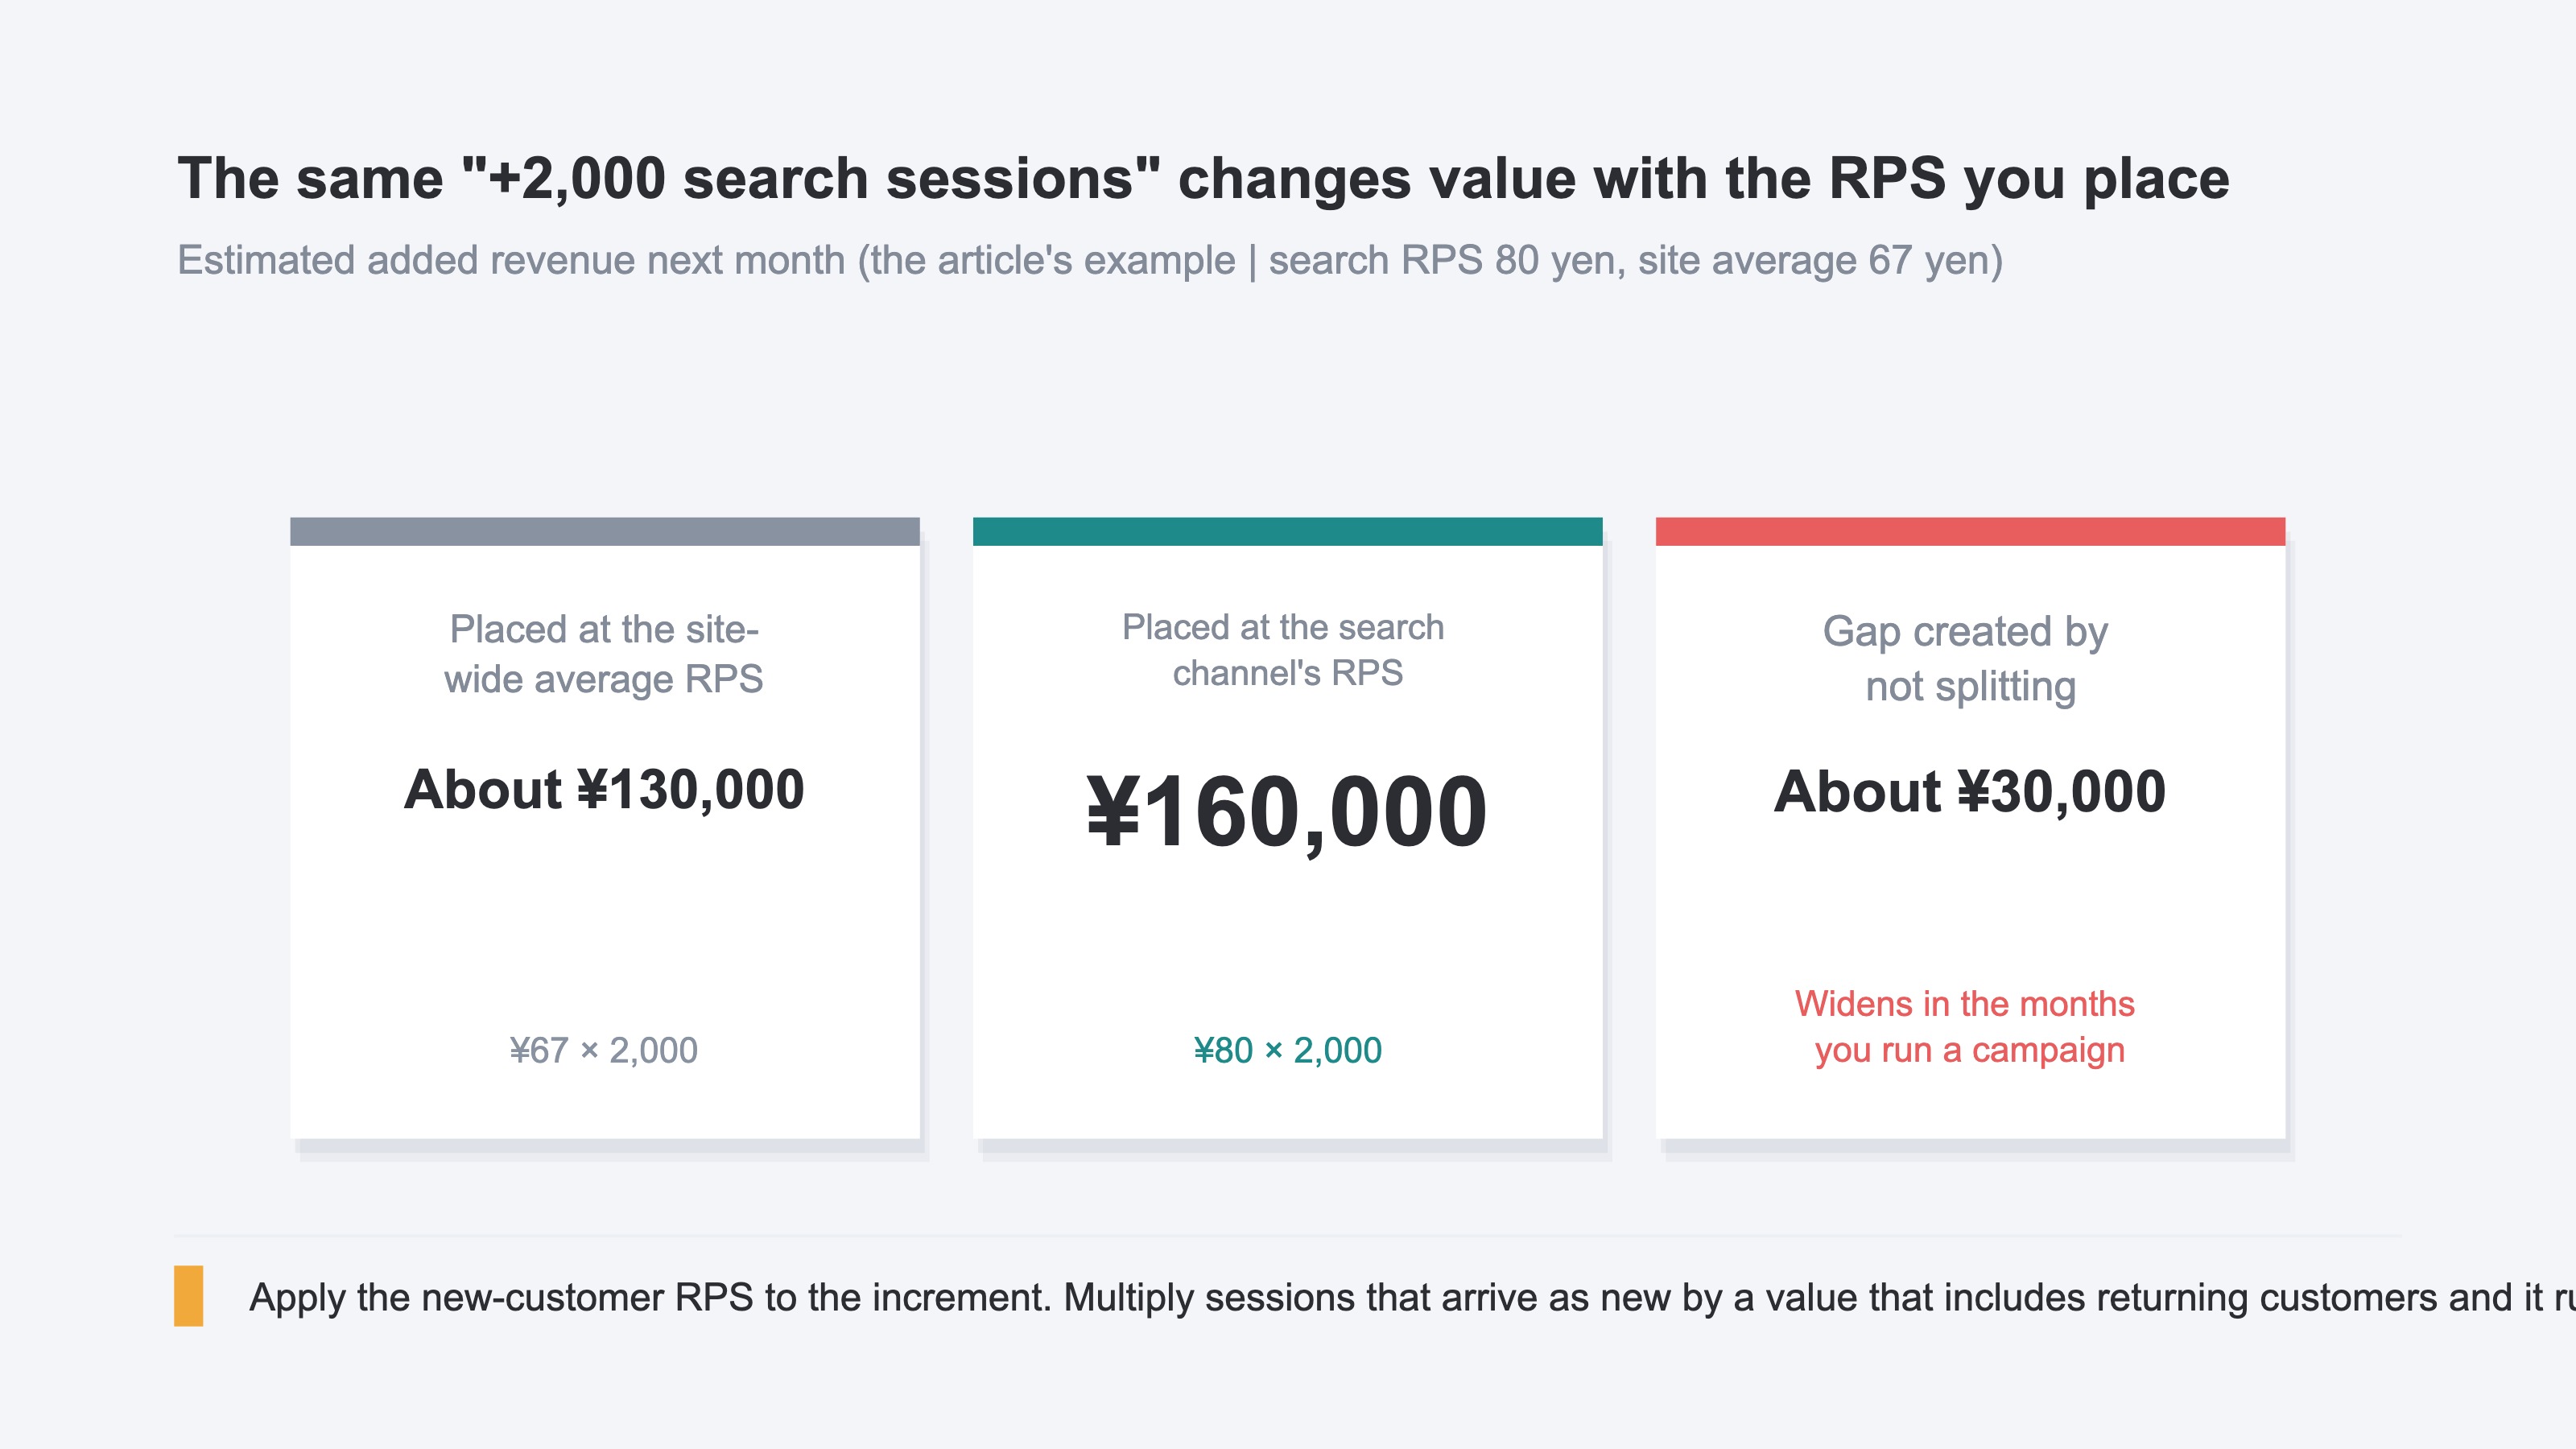
Take an EC site where Google search brings 10,000 sessions at an RPS of ¥80 and Google Ads brings 5,000 sessions at an RPS of ¥40. This month's revenue is ¥800,000 and ¥200,000, ¥1,000,000 in total, and the average RPS is about ¥67. Now suppose Google search is expected to add 2,000 sessions next month. Placed at search's own RPS of ¥80, the increment is ¥160,000; placed at the ¥67 average, about ¥130,000. Not splitting by channel — that alone moves the number by ¥30,000.
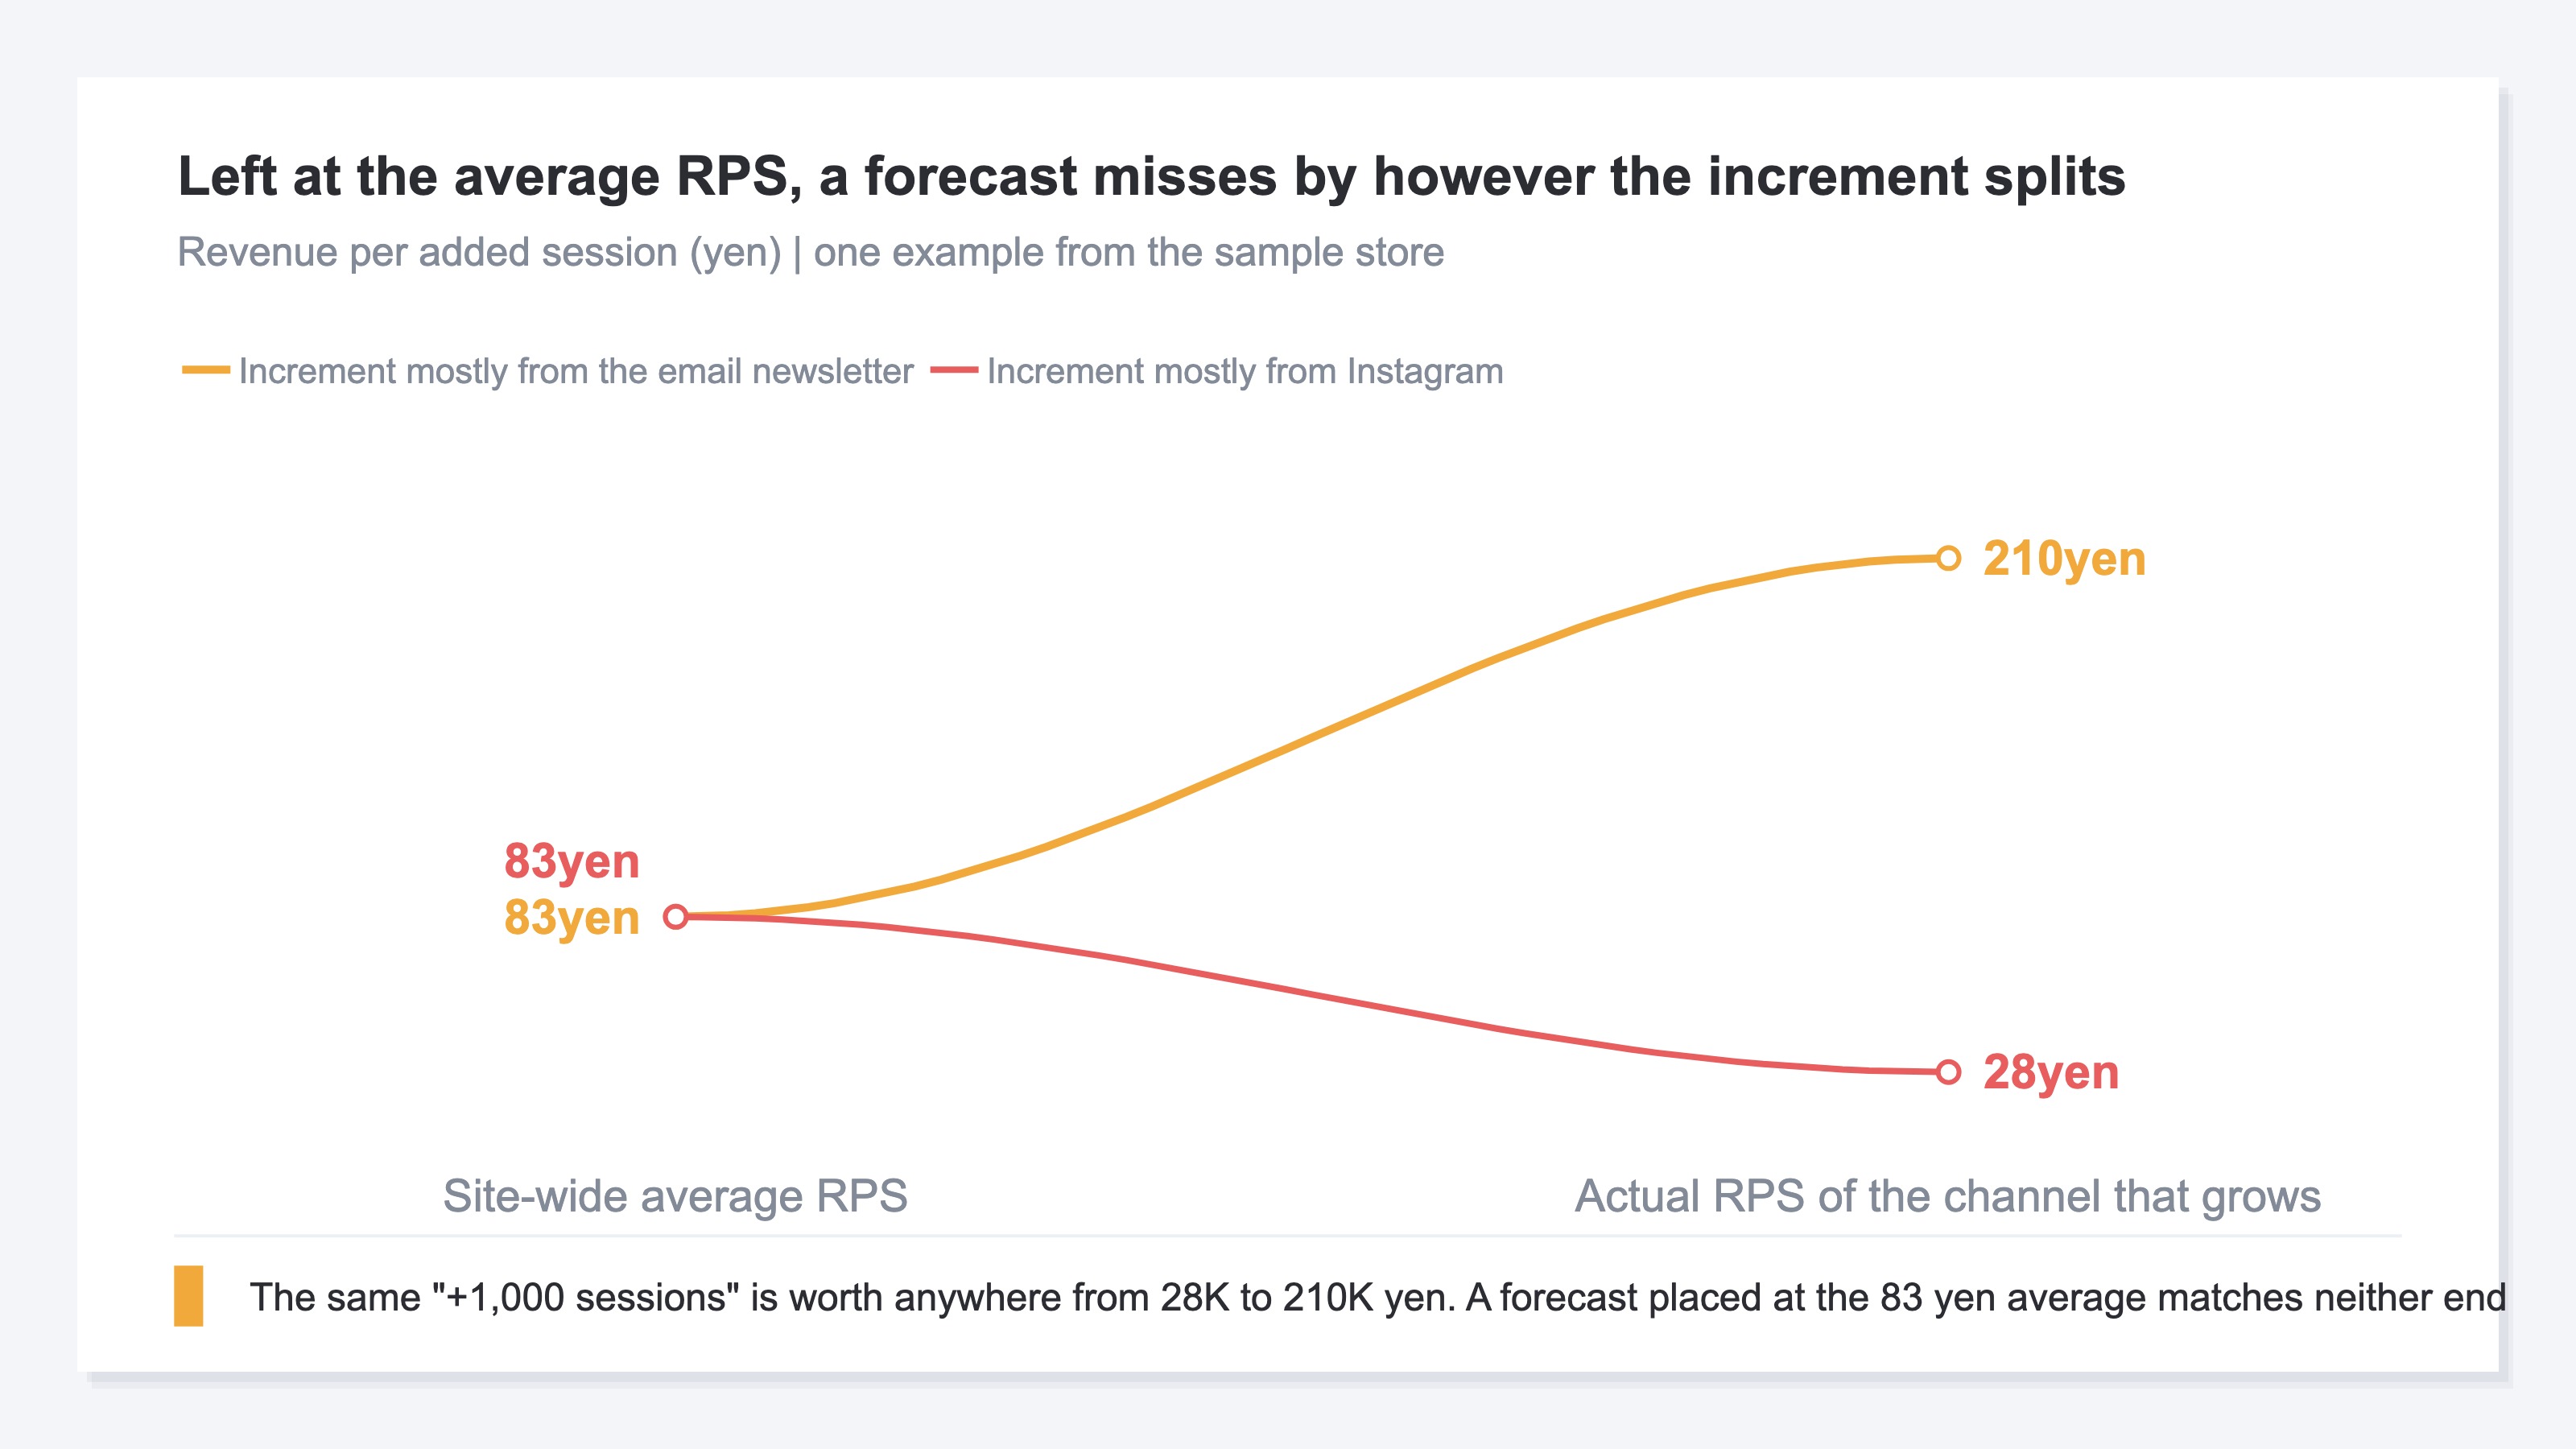
The gap widens the more the traffic skews. If the increase comes from a channel whose RPS is only a third of the average, a forecast placed at the average runs close to 3x too high.
Apply the new-customer RPS to the increment#
Even after splitting by channel, one correction remains. RPS between new and returning customers can differ by around 2x, with returning customers showing the higher figure because both their purchase rate and their order value run higher. And what traffic campaigns add is usually the new side. Apply an RPS that includes returning customers to sessions that arrive as new, and the forecast comes out too high. EC sites that have not separated new from returning are common, and there the breakdown itself is missing, let alone the weights. How to measure it, and the trap where lost cookies inflate the new count, are covered in Splitting revenue by new vs returning. What to compare against is not another company's industry average but the spread inside your own site, a view laid out in Industry RPS benchmarks.
The idea is simple; redoing the data by hand every month is not#
The thinking up to here is simple. Split, weight, add. That is all of it. What is heavy is lining it all up again every month. GA4 also classifies traffic into channels[3]. It is just not built to start from revenue per session. You collect the per-channel breakdown and the new/returning breakdown separately, and you match the periods yourself. On top of that, RPS is not a fixed value, so last month's number cannot simply be carried into next month. Rebuild it every month at the same granularity. That repetition is the single biggest reason forecasting stops getting done.
3. Base the Traffic Plan on Search Headroom, Not Hope#
However finely you split RPS, the forecast still misses if the session count is placed on hope. Put the session side on search headroom as its basis, and give it a width.
The headroom sits in the rank 4 to 20 band#
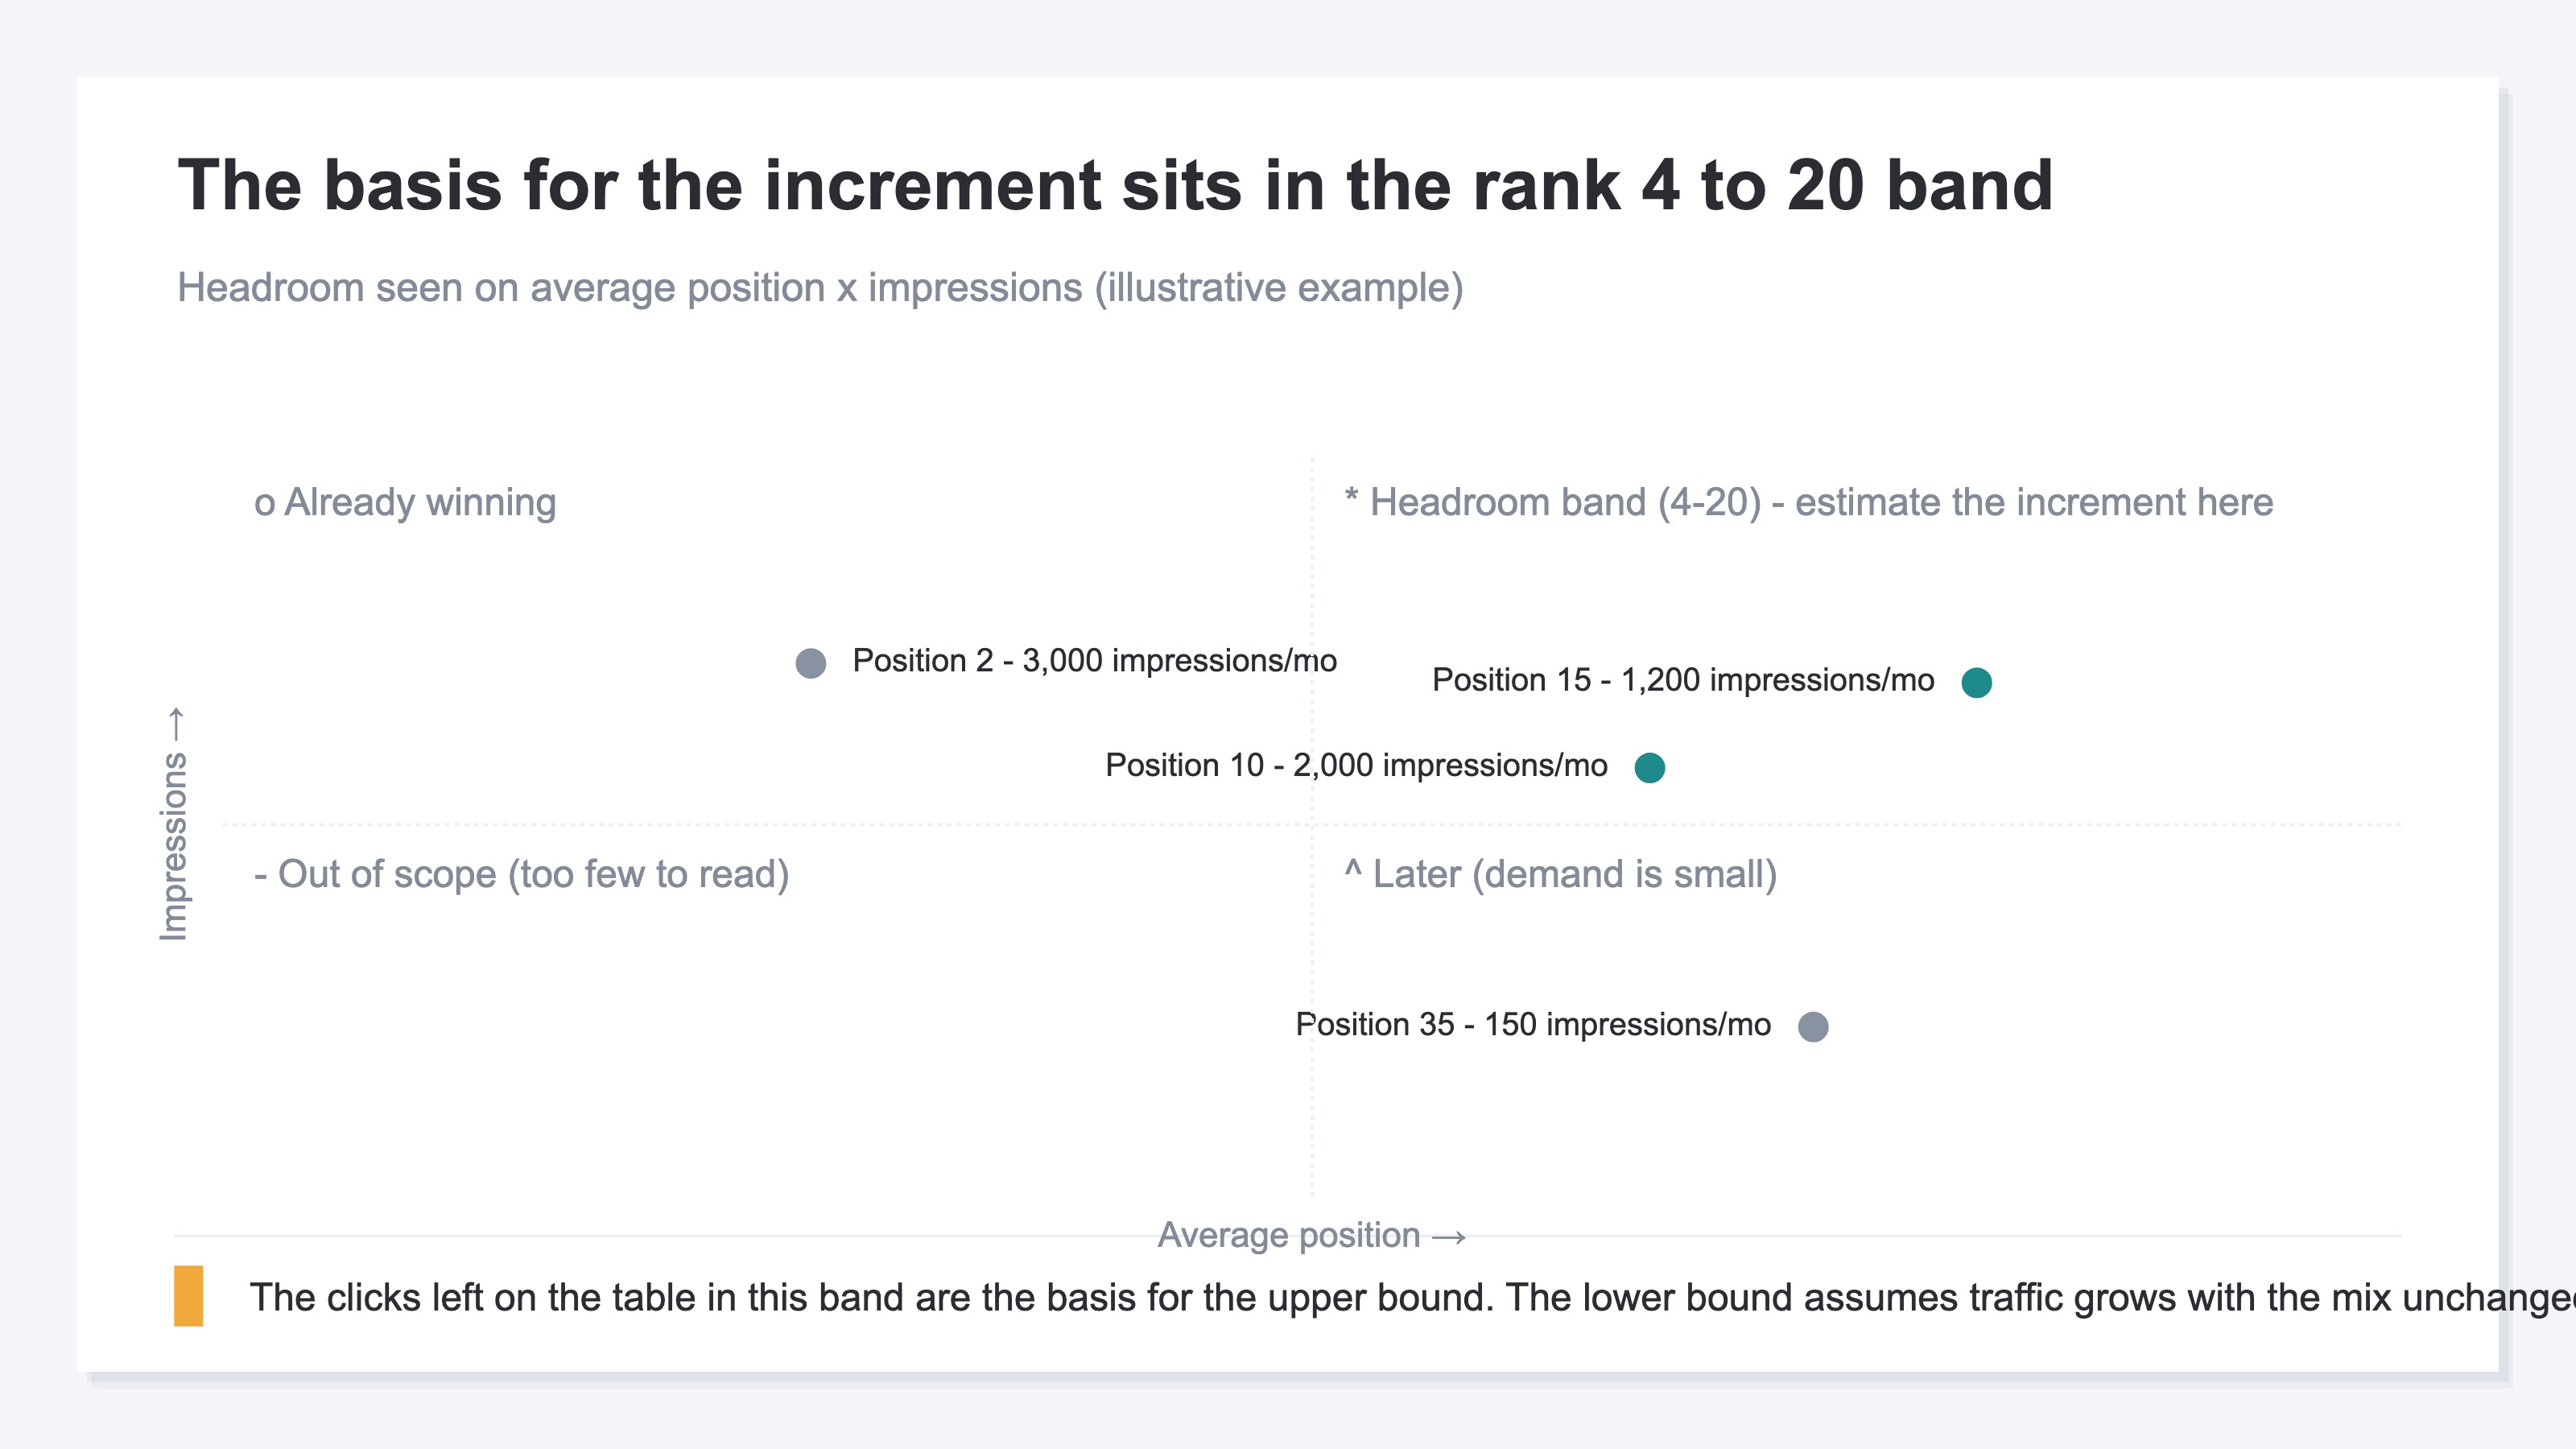
The material that gives next month's session increment a basis sits in the rank bands of search results. These are the keywords that already appear in results but stay somewhere around positions 4 to 20. In that band impressions exist while clicks are few, so room remains for clicks to grow by however much the rank rises.
Click-through rate varies sharply with position in search results, falling off steeply as you move away from the top[2]. So even at the same impression count, the increment from pushing a keyword at position 10 up to position 3 can be estimated. Impressions, current clicks and average position are all available in Google Search Console[1]. A hopeful figure like "search should grow about 20% next month" can be replaced with a grounded one: how many sessions a month the keywords in this band can win back. One caveat: SEO takes effect in order, starting from impressions, and revenue comes last. Fold the whole recoverable amount straight into next month and you will misread the waiting stage as a campaign that didn't work (see When does SEO kick in).
Hold the forecast as a range, not a single number#
Finally, hold the forecast as a width rather than one number. The lower bound is traffic growing while the mix stays as it is now; the upper bound is the headroom being captured as planned. With both in place, where the month's actuals land relative to them decides what you check next. Below the lower bound points at the RPS side; short of the upper bound points at the session side. A forecast whose miss tells you the next move is worth continuing more than one aimed at hitting a single number.
RevenueScope solution
RevenueScope automates this monthly hand work. It displays sessions, revenue and RPS by channel, and shows the RPS for new and returning customers on the same dashboard. It also shows, for each page with headroom in search, the expected session increment from lifting its rank, as a monthly estimate. You assemble the forecast multiplication yourself; what RevenueScope supplies is the measured values you place into it, lined up the same way every month.
Asking an AI assistant through MCP returns this#
Ask it to pull RPS by channel along with RPS for new and returning customers, and the answer comes back in this shape.
| Channel | Sessions | RPS |
|---|---|---|
| Google search | 12,400 | ¥82 |
| 5,200 | ¥28 | |
| Google Ads | 3,800 | ¥45 |
| Direct | 2,900 | ¥165 |
| Email newsletter | 1,600 | ¥210 |
Site-wide, RPS for new customers is ¥61 and RPS for returning customers is ¥148.
An illustrative channel-by-channel RPS forecast using sample data from a fictional site.
What stands out in this example is that the site-wide average RPS is about ¥83 while the actual figures per channel sit a long way from it. Instagram at ¥28 is only a third of the average, so if next month's increment skews there, a forecast placed at the ¥83 average runs close to 3x too high. The second point is the gap between new and returning customers. Site-wide, new customers sit at ¥61 against ¥148 for returning ones. Since what grows when you push search or ads is mainly the new side, leaving the site-wide average in place means over-estimating.
On efficiency the email newsletter and Direct stand clear of the rest, while their session counts stay small. A high RPS like the newsletter's usually rests on returning customers, so for the volume added by thickening that traffic you apply the new-customer RPS. Once you decide where the increment comes from, the RPS you multiply by is decided too.
FAQ#
Frequently asked questions#
Q. How far ahead is it realistic to forecast revenue?
A. One month ahead is the easiest unit to work with. Per-channel RPS moves with seasons and campaigns, so holding one value out three months costs accuracy. Even when you want a quarterly view, replacing the value month by month and adding them up lets you trace which month and which channel caused a miss.
Q. How many months of measured data should per-channel RPS come from?
A. Take the most recent month as the base, and pool three months for channels with few orders. RPS for a channel with few sessions swings hard on a single large order. The more a channel's swing bothers you, the longer the window you take to get a stable value.
Q. Does that mean forecasting with an average RPS is off limits?
A. In a month where the traffic mix does not move from the previous month, the average will get you close. Its place is estimating an ordinary month with no campaign running. In months where the mix shifts, such as raising ad spend or SEO starting to land, use values split by channel.
Q. How far apart do RPS for new and returning customers usually sit?
A. It depends on the EC site, but a gap of around 2x is not unusual, because returning customers have both a higher purchase rate and a higher order value. What matters is less the multiple itself than measuring the gap inside your own site. Once you know it, estimates for campaigns that add new customers stop coming out too high.
Summary#
Forecasting revenue from traffic is just expected sessions multiplied by RPS. Almost every miss comes from calculating that RPS as a site-wide average. Since the average is itself decided by the breakdown of traffic, it holds least in the months you ran a campaign. Split by channel, correct the value applied to the increment toward the new-customer side to build the weights, and place the session side on search headroom as its basis. Start by pulling one month of your own per-channel RPS and seeing how far it sits from the site-wide average.
See which ads actually drive revenue, at a glance
Free up to 5,000 sessions/month, AI analyst included. No credit card required. Up and running in 5 minutes.