When does SEO start to work? Most people go looking for an answer in days — "how many days until it works" — and when no clear number comes, they quit partway. But the real answer isn't in days; it's in the order things happen. SEO's metrics don't all lift off at once. Impressions move first, clicks follow later, search rank settles after that, and revenue or conversions lift off last. Miss this order, and you'll read the stretch where revenue hasn't moved yet as "it isn't working" and walk away. This piece lays out the order effects arrive in as a 90-day curve, and walks through how to judge by "where am I on the curve right now" so you don't break partway through.
Table of contents
TL;DR#
- Ask "how many days until SEO works" and you'll break partway, because effects lift off in order, not on a schedule. The right read isn't the day count — it's which metric has started to move.
- Metrics lift off in sequence, not together: impressions first, then clicks, then search rank, and revenue or conversions last. Revenue moves last, so watching revenue alone makes it easy to misread the early stretch as "not working."
- The impressions curve lifts off first, the clicks curve follows behind, rank firms up slowly, and the revenue curve rises from furthest back. Knowing the shape of these lags changes what a quiet early stretch means.
- Decide whether to quit by "where am I on the curve," not by feeling. If impressions are climbing but clicks and revenue aren't there yet, you're in the first half of the curve — not the place to give up. Tracking the lift-off order across metrics every week is heavy, and that's exactly where seeing them lined up in one view earns its keep.
1. Why the "how many days" question makes you quit#
Bottom line: you break because you asked for the answer in days. SEO's effects don't lift off all at once but in order, so the right read isn't the day count — it's which metric has started to move.
The people who lose heart partway sound strikingly alike. They stack up articles for a long stretch, revenue still at zero, wondering "should I even keep going." They keep rowing without knowing how many days until it works, and quit tired because no answer ever comes. The top reason people leave SEO isn't the lack of results itself — it's not knowing where they are right now.
What warps expectations is the occasional overnight-success story. When a dramatic tale spreads — rebuilt the site, and days later the inquiries wouldn't stop — it stamps in a false sense of a deadline: "I've had zero results for months, so I've failed." But those instant cases almost always rest on different premises, and holding them up as your own yardstick lands you in self-blame every time. Never told the order things grow in or the premises behind it, many people blame themselves for "not trying hard enough" and quit. This isn't a lack of effort — it's a problem of how you're reading it.
Google itself says plainly that changes take time to show up in Search [1]. So "revenue hasn't moved yet" usually isn't failure — it's just being partway through the order. So what is that order? The next section looks at it as the shape of a curve.
2. SEO lifts off in order, not all at once#
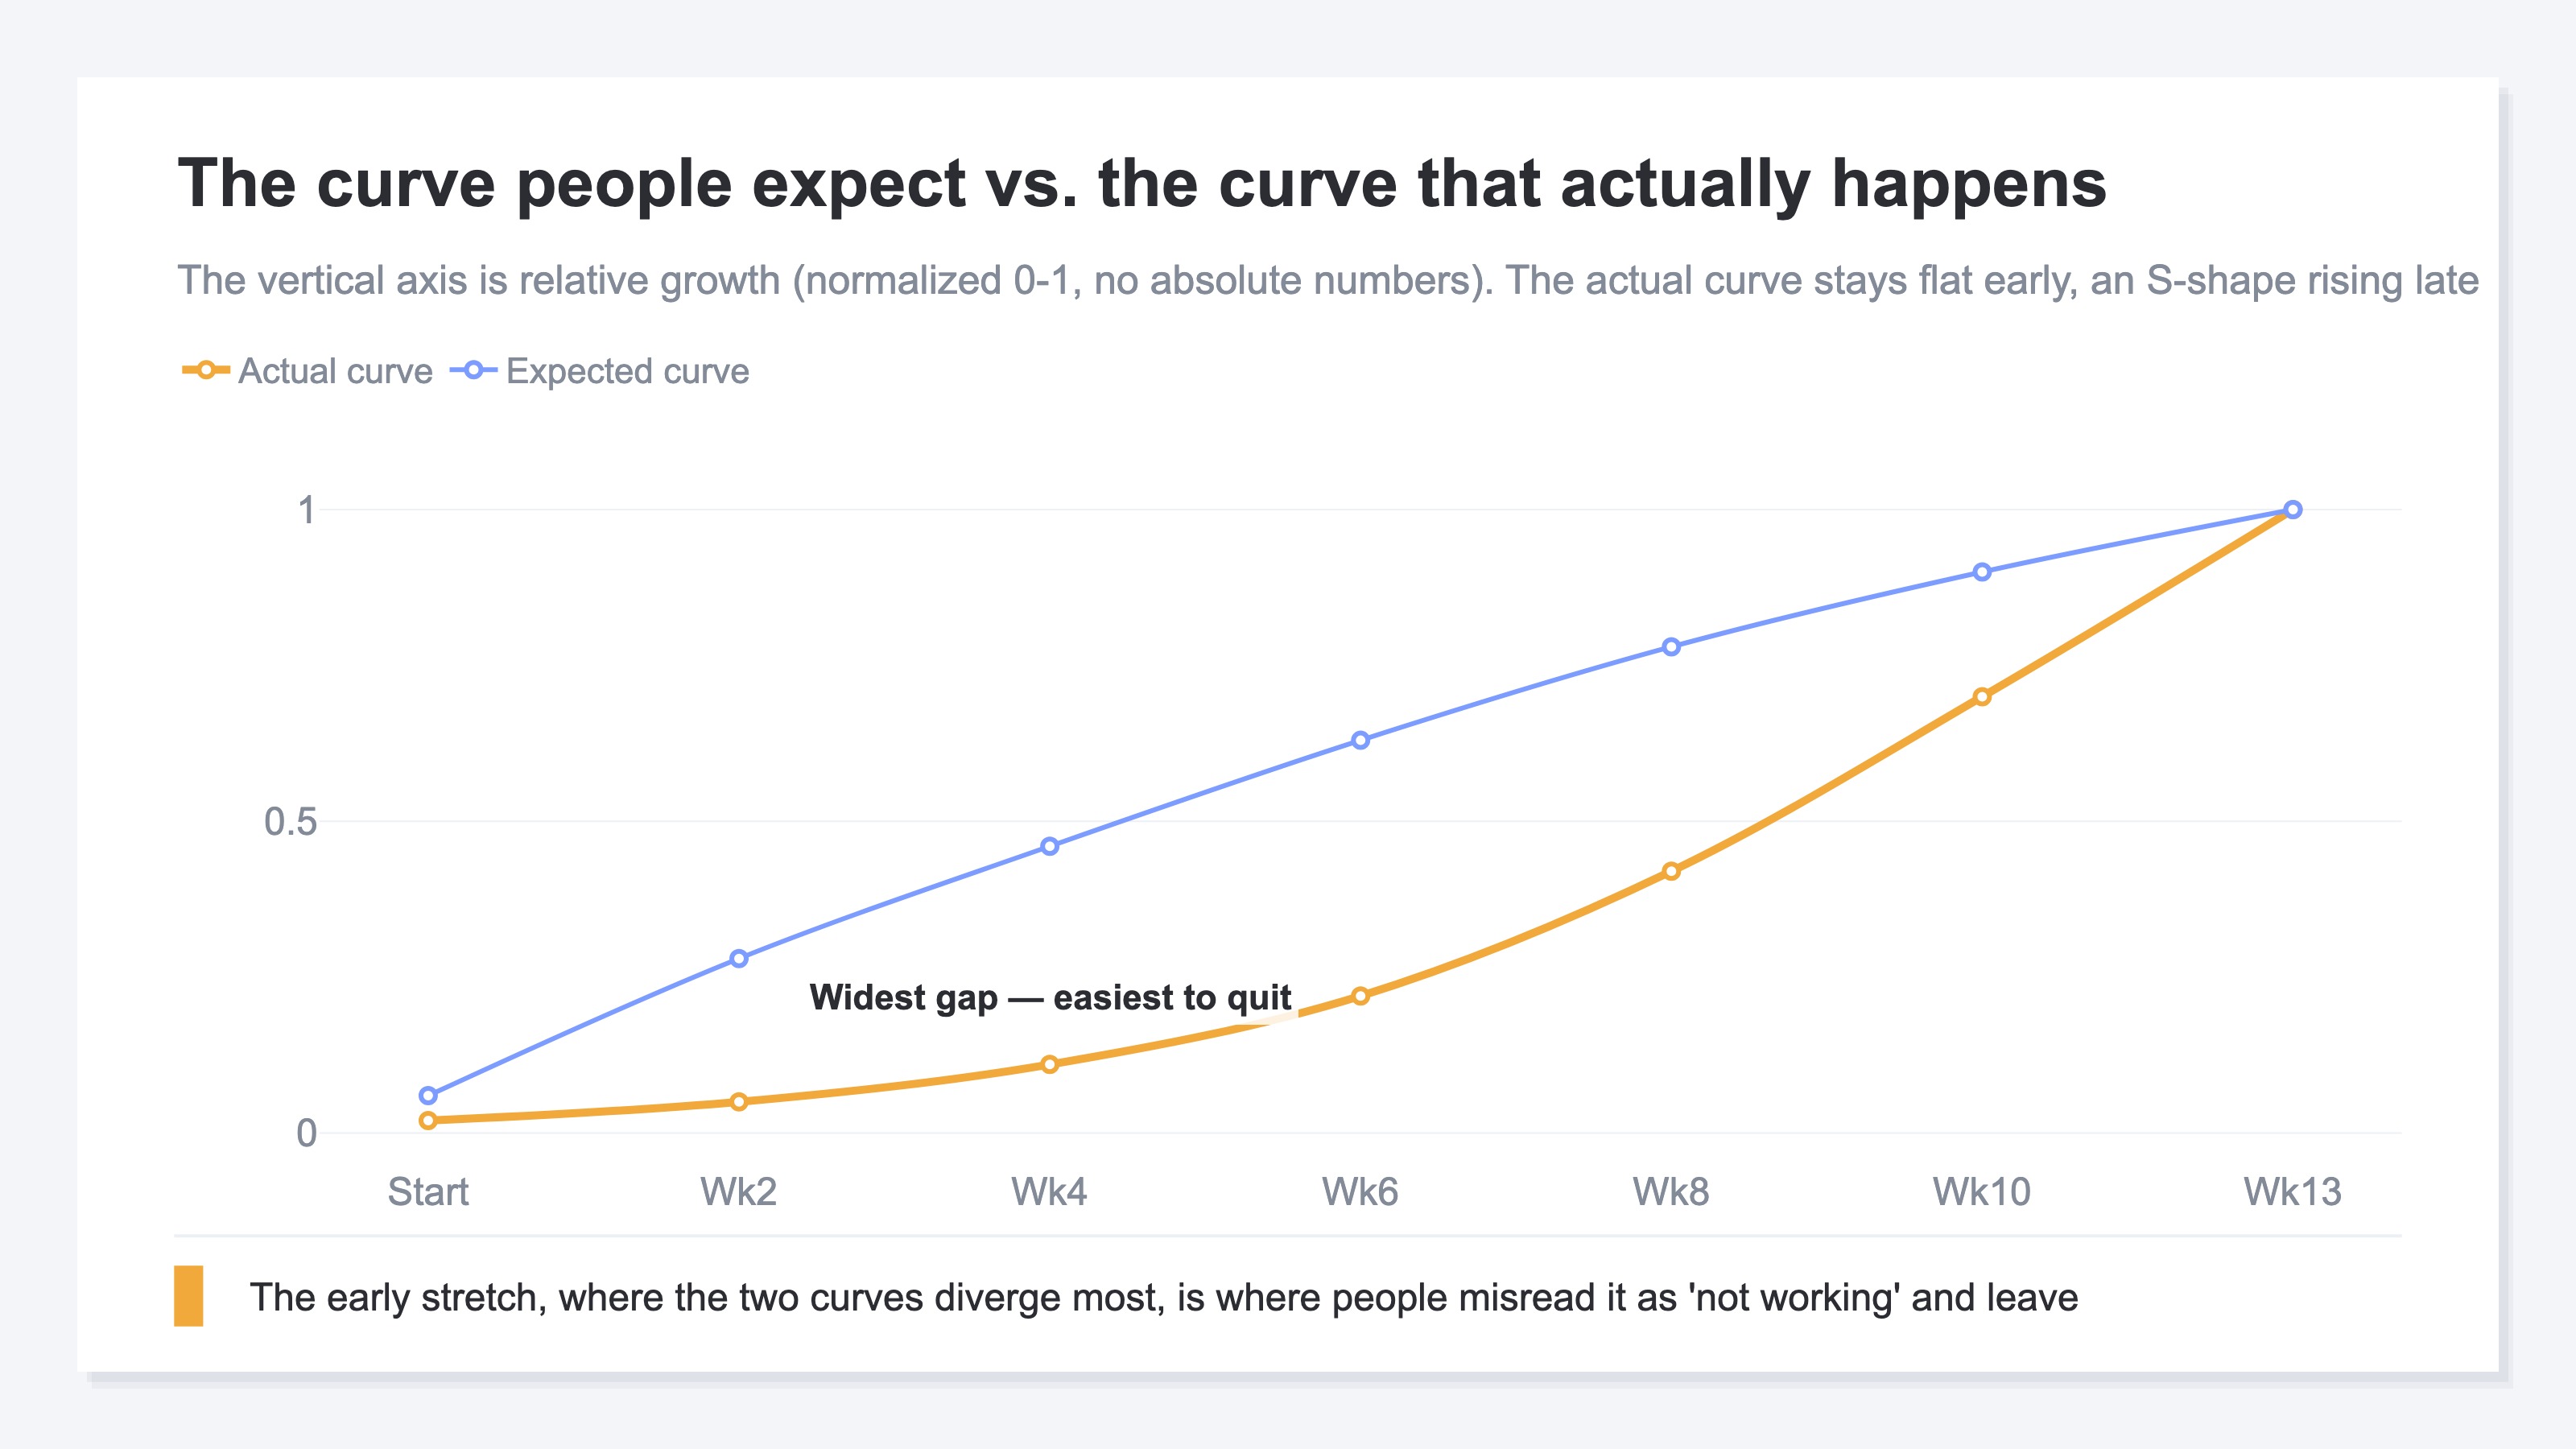
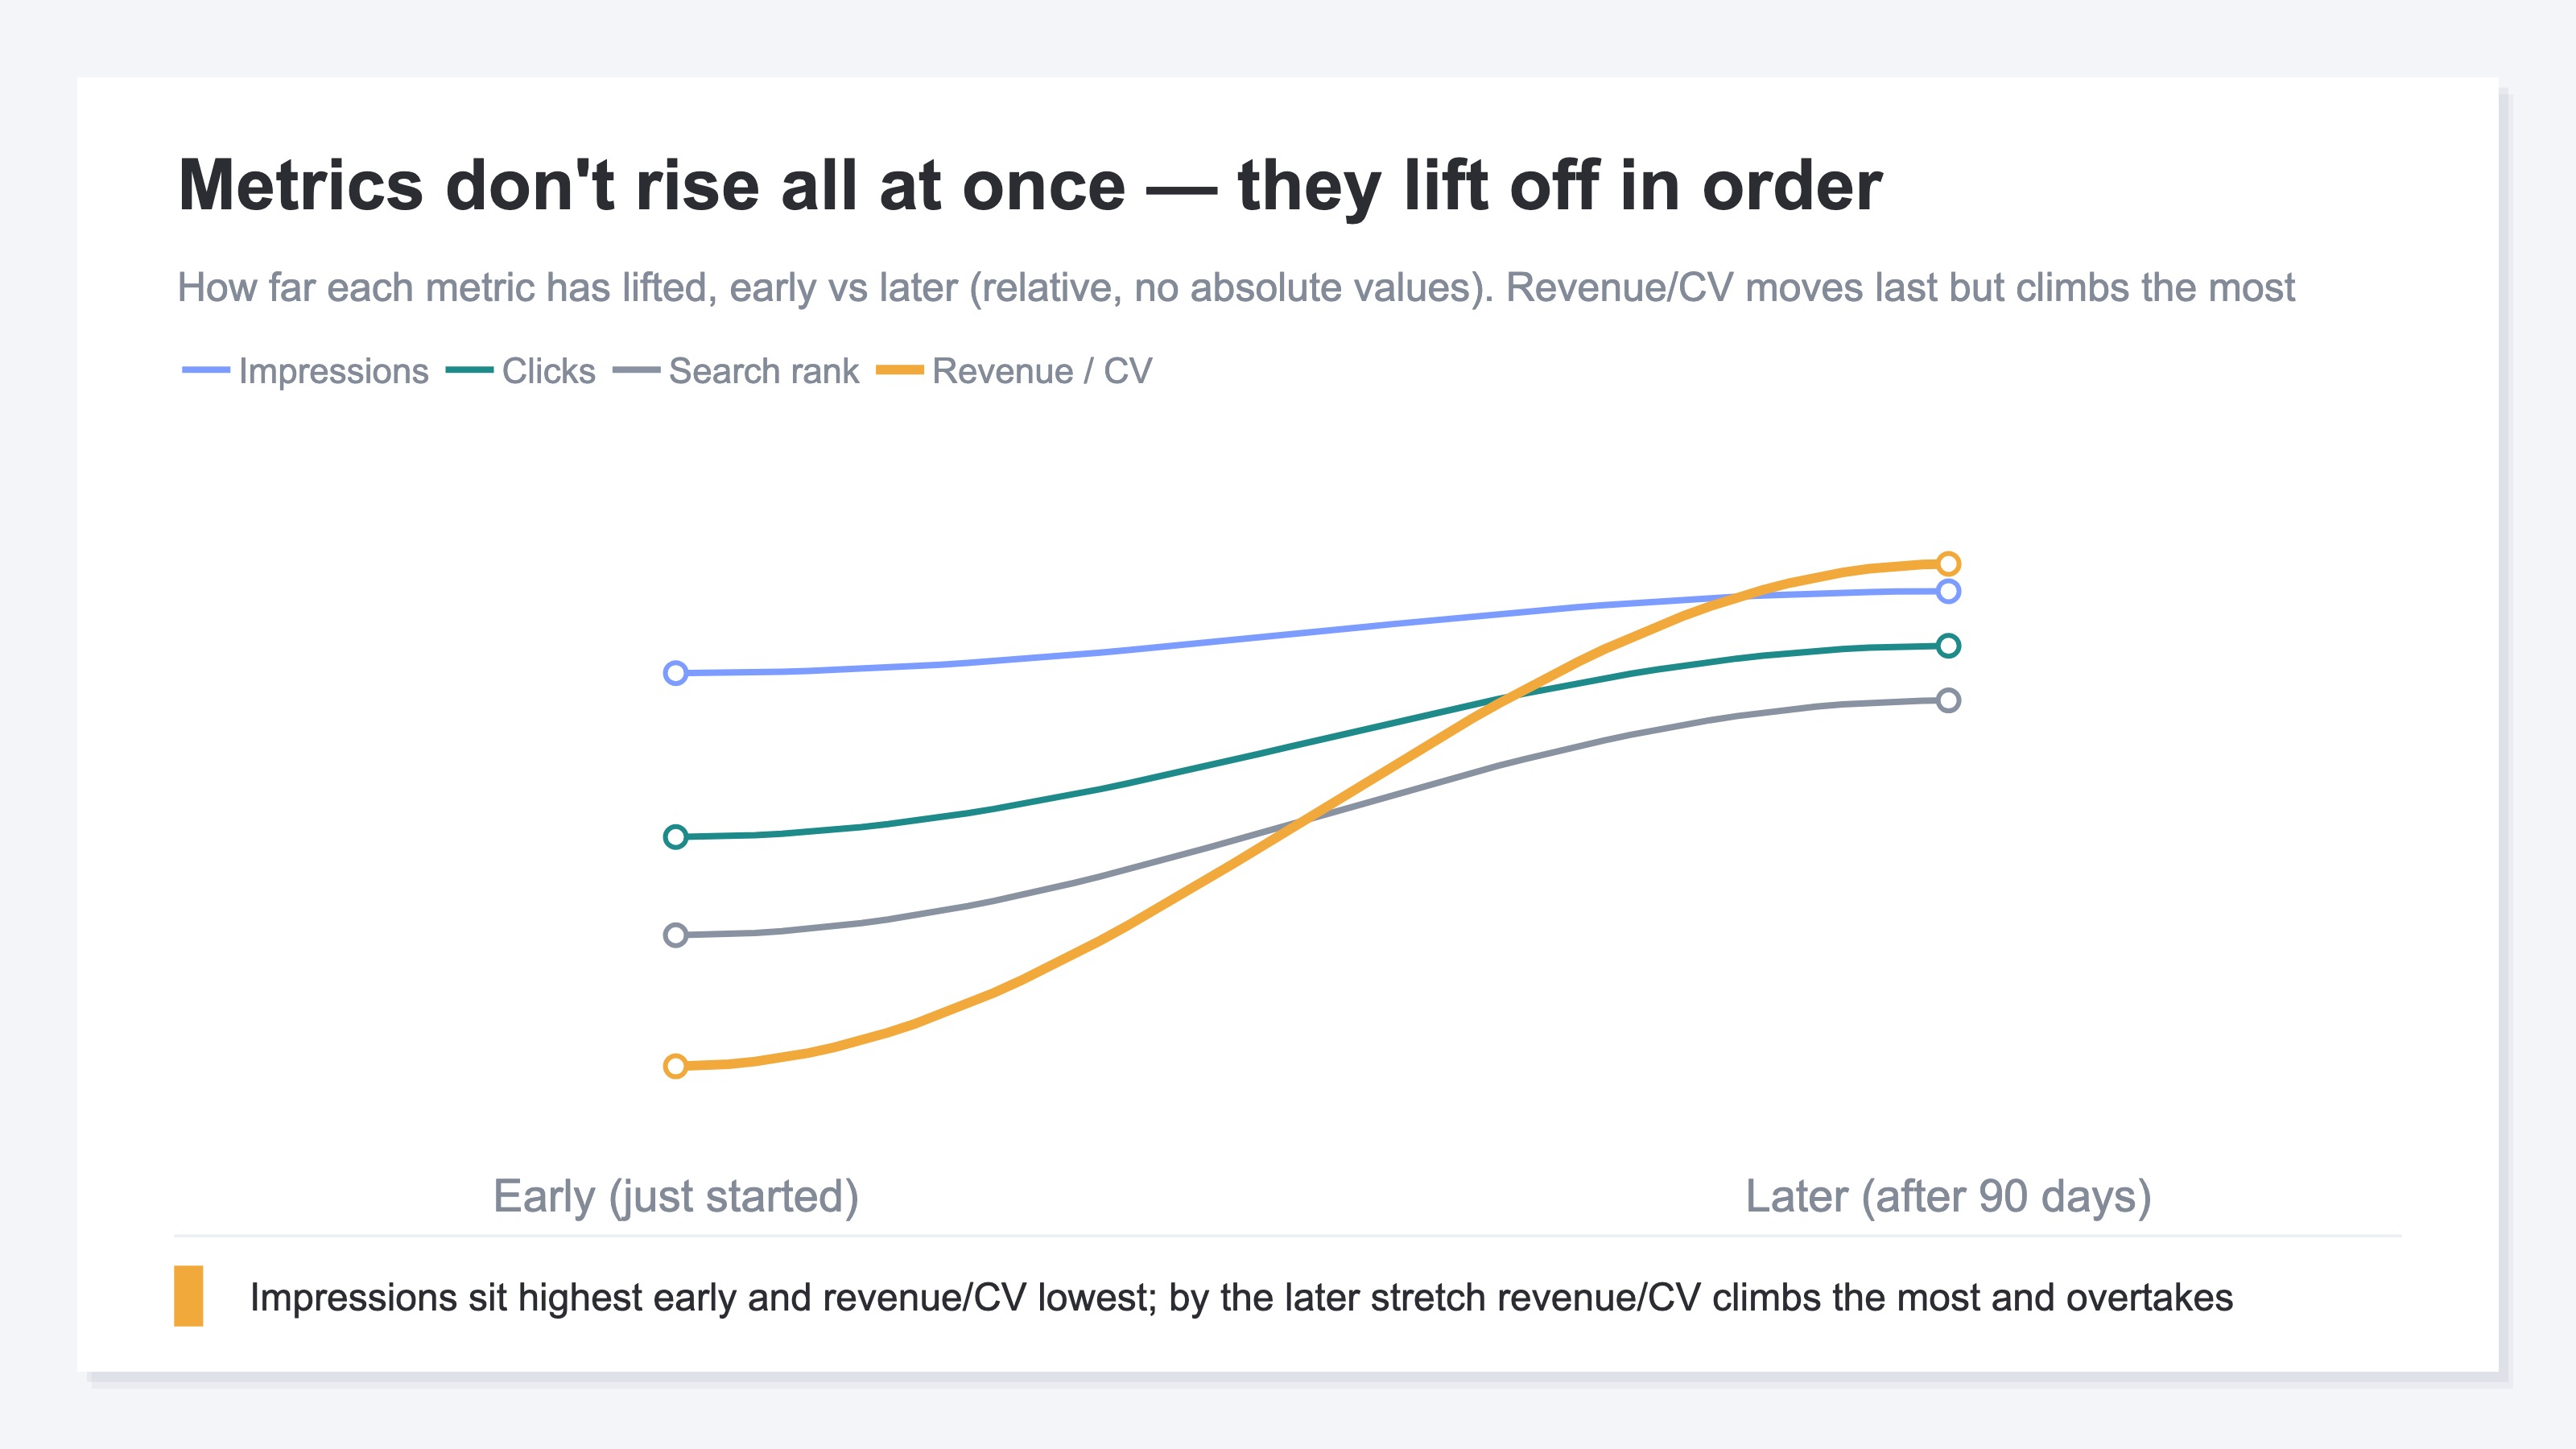
The point is simple: SEO's metrics don't move together — they lift off in order, with lags. Impressions first, then clicks, then search rank, and revenue or conversions last.
Why this order? A search engine first finds your page and lists it in results [3]. So the first thing to move is impressions — the number of times you show up in results. The impressions curve lifts off earliest. But at this stage your rank often sits low, so even when you're listed, clicks stay thin. A period where impressions rise but clicks don't move is perfectly normal.
Next to lift off are clicks. As rank inches up and you near a spot searchers actually notice, the same impressions start yielding more clicks. The clicks curve trails the impressions curve. Search rank itself settling firmly near the top comes later still. Rank wobbles even after it rises, settling over time, so its curve only firms up slowly.
And rising from furthest back is revenue or conversions. For revenue to move, you need to be reaching the top on terms where people buy. Impressions grow, clicks grow, rank firms up, and only then does part of it ripple into the revenue curve. So the revenue curve lifts off well behind the impressions curve. Here's the key point: because it starts late, the later revenue curve steepens many times faster than impressions do. The flat early stretch isn't "not working" — it's the run-up where each earlier metric pushes the next one up. Give up early watching revenue alone, and you step off just before the steepest climb.
3. Read where you are on the curve, and you won't give up#
Bottom line: whether to continue or quit can be judged by "where am I on the curve," not by feeling. Line up which metric has started to move, in order, and you can see where you are.
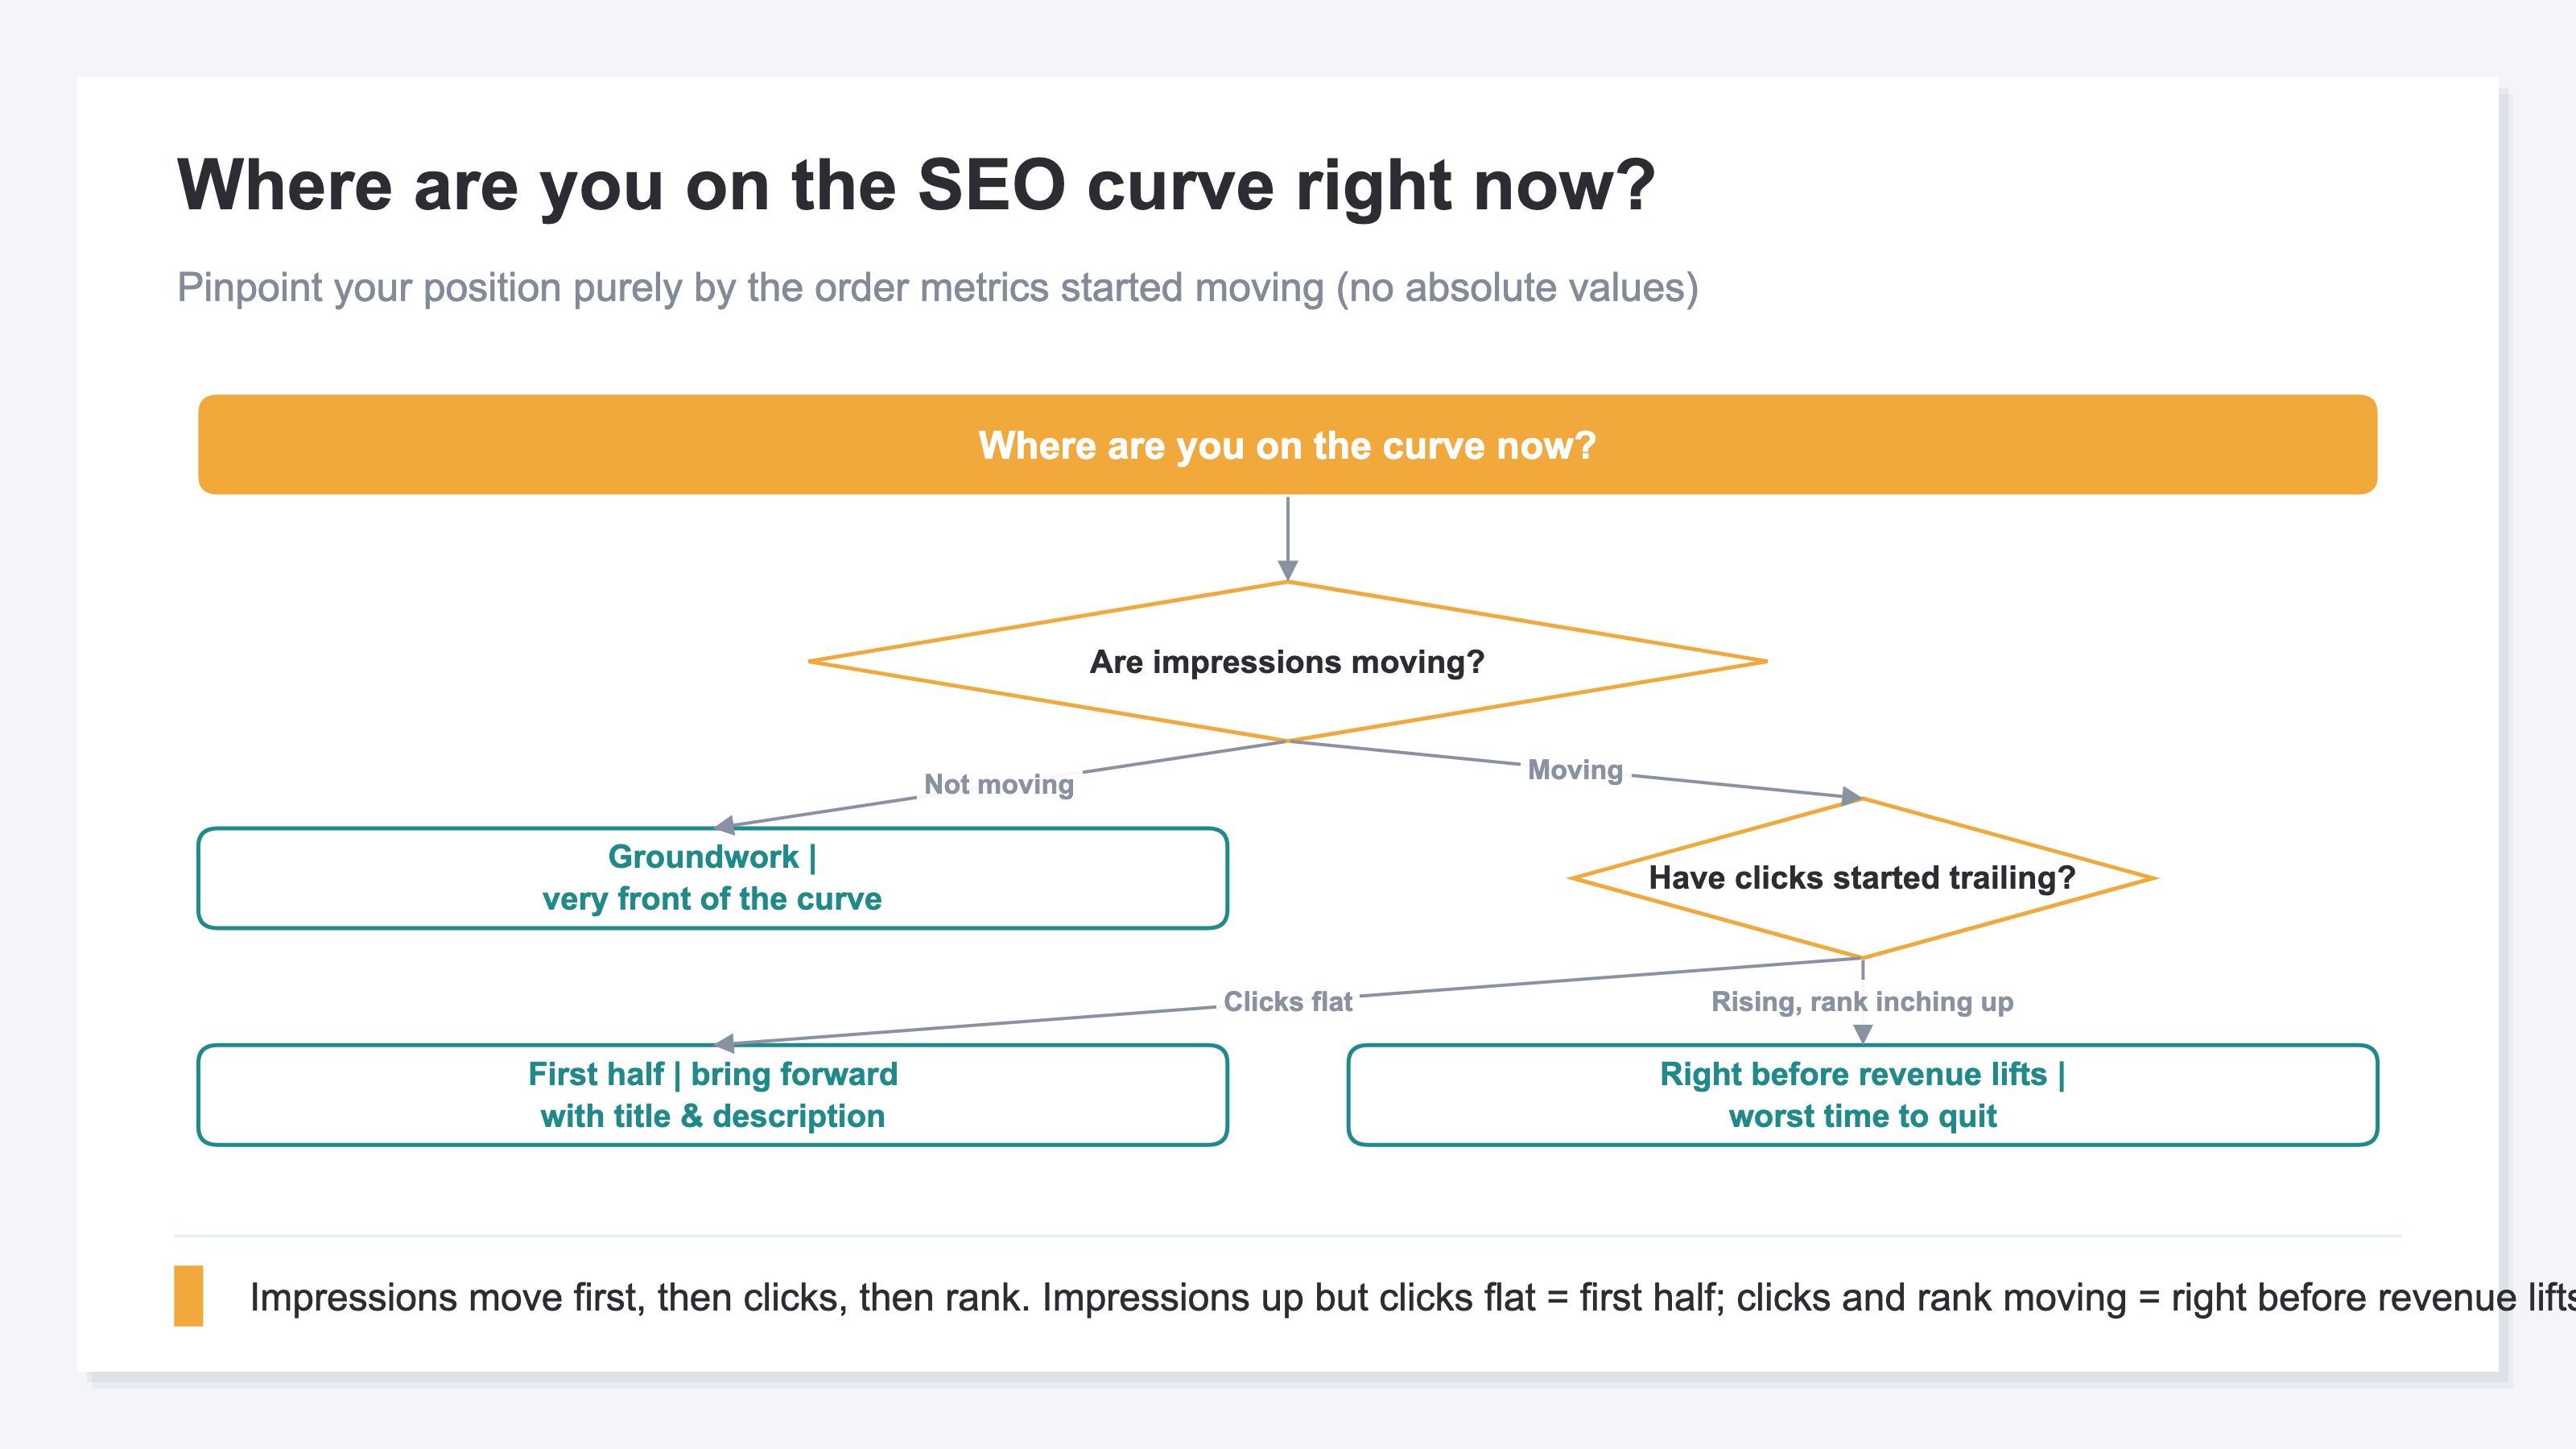
The read is gentle. Start with impressions. If even impressions have barely moved, you're still laying the foundation, at the very front. Next, if impressions are climbing but clicks are flat, that's proof you're in the first half of the curve. This isn't the place to quit — it's the stage to tidy up titles and descriptions and pull the clicks curve forward. Further on, if clicks are rising and rank is inching up too, you're right before the revenue curve lifts off. Stepping off here is the biggest waste of all. Put the other way: reading in this order keeps you from the mistake of lamenting "no revenue" while you're still in the first half.
The idea itself is gentle enough. What's heavy is keeping this up every week, across metrics. When impressions live in this tool, clicks and rank in that report, and revenue on yet another screen, "which metric started moving in what order" never lines up, and you end up making a quit-or-continue call on nothing but a vague sense that "it doesn't seem to be working." Are impressions still moving? Have clicks started trailing behind? Or has every metric truly stalled? Whether you can track where you are on the curve, week after week without losing it, is what separates giving up from carrying on. The entry point of when you'll first start showing up in search is covered in when your site will start appearing in search, and how to break out of that first half where impressions are there but clicks aren't is in what to do when you have impressions but no clicks.
RevenueScope helps
By now we've seen that SEO's effects lift off in order, and that whether to continue or quit can be judged calmly — not on emotion — by reading "where am I on the curve" through the order metrics lift off in. What's left is how to keep tracking that lift-off order every week without losing it.
RevenueScope takes over that tracking. For each page and search term, it lines up impressions, clicks, search rank, and estimated revenue in one view, so you can follow which metric started moving in what order over time (figures shown are demo data). Estimated revenue is a conservative approximation — revenue per visit from search times clicks — a tool for reading the scale and direction of "which terms seem to move revenue, and by roughly how much." Without hopping between scattered tools, for a single page or term you can check, in order and on the same screen: has the impressions curve lifted off, have clicks started trailing behind, has rank firmed up, and has estimated revenue begun to move from there.
| Page (sample) | Impressions | Clicks | Search rank | Where on the curve |
|---|---|---|---|---|
| New blog post | Just emerging | Near zero | Off the radar | Groundwork: impressions haven't even lifted off yet |
| Product page (exposure first) | Steady impressions | Still few | High single digits | First half: impressions have lifted, clicks are next — time to work the title and description |
| Popular product page | High | High | Low single digits | Lifted off: clicks and rank are on, and the revenue curve is about to rise |
Read the order metrics lift off — where you are on the curve, not the magnitude (sample data from a fictional store)
What to read in the rows above isn't the size of each number but the order metrics lift off in and the lags between them (it isn't a table for competing on the figures themselves). If the impressions curve has already lifted off but clicks aren't there yet, that's the signal you're in the first half — the stage to tidy up titles and descriptions. If clicks have started trailing and rank is firming up but estimated revenue is still to come, you're right before the revenue curve lifts off. Line up which metric moved in what order in one view, and you can tell "am I mid-run-up" from "has it truly stalled" by the lift-off order rather than by gut. How a single page's search rank, clicks, and impressions have shifted over these past weeks can be followed as that page's own timeline too, so you can confirm the same way whether a rank-pushing move has started to take.
RevenueScope narrows to the metrics that ripple toward revenue — impressions, clicks, search rank, and estimated revenue — and lines them up in one view in lift-off order. So even in a stretch where results aren't visible, it shows you "where on the curve you are" with data, and lets you pick your next move instead of giving up. The idea of working, in order, from terms one step short of the top is in choosing striking-distance keywords by revenue opportunity, and how to connect rank movement to revenue is in how to read revenue per search term.
FAQ#
Frequently asked questions#
Q. So, roughly how many days until SEO works?
A. It's hard to answer in a single day count, and asking for one is exactly where people tend to break. Effects don't lift off all at once but in order: impressions move first, clicks follow later, then search rank, and revenue or conversions last. So instead of "how many days until it works," read your current position by "which metric has started to move." Even if revenue isn't here yet, if impressions or clicks have moved first, that means you're partway through the order.
Q. Impressions are rising, but clicks and revenue haven't moved at all. Have I failed?
A. Not yet. It's a perfectly natural state of being in the first half of the curve. Impressions are the first metric to lift off, clicks trail behind them, and revenue rises from furthest back. Impressions climbing is itself the signal that the run-up pushing the later metrics up has begun. What you can do at this stage is tidy up titles and descriptions to pull the clicks curve forward — not step off.
Q. How should I decide whether to keep going or stop?
A. Judge by the order metrics lift off in, not by feeling. If even impressions haven't moved, you're at the very front, laying the foundation; if impressions move but clicks are flat, you're in the first half; if clicks and rank have started to move, you're right before revenue lifts off. Read your current position in this order, and you avoid the most wasteful exit of all — lamenting "no revenue" while you're still in the first half. When you can track which metric moved in what order, lined up in one view, this call becomes something you make on data rather than gut.
Summary#
When does SEO start to work? Ask that question in days, and you'll break partway before any answer comes, because effects don't lift off all at once but in order. Impressions move first, clicks follow behind, search rank firms up slowly, and revenue or conversions lift off last. Revenue rises from furthest back, so watching revenue alone makes it easy to misread the stretch as "not working."
What matters is deciding to continue or quit by "where am I on the curve," not by emotion. If impressions are climbing but clicks and revenue aren't there yet, that's proof you're in the first half — not the place to give up. Read your position in this order and you avoid the mistake of stepping off just before the steepest climb. The idea is gentle, but tracking the lift-off order across metrics every week is heavy. That's exactly why getting impressions, clicks, rank, and estimated revenue into a state where you can see them lined up in one view lets you confirm "where on the curve you are" with data, and pick your next move instead of giving up.
See which ads actually drive revenue, at a glance
Free up to 5,000 sessions/month, AI analyst included. No credit card required. Up and running in 5 minutes.