You redesigned the site and search rankings fell. What matters most, though, isn't that the rank numbers went down. It is how much revenue the pages that dropped out of search in the migration had been earning every month, and that the amount is now gone. This article walks through how to re-read the loss in revenue instead of rank, and how to name the lost pages by the money they used to bring.
Contents
TL;DR#
- What a redesign actually takes from you is not a rank number but the revenue a page was producing every month. The size of a rank drop tells you nothing about how much revenue any given page lost
- So change the axis you read on. Match revenue page by page across the migration and name, in money, the pages that used to earn and have now gone quiet. That is the entry point to measuring the loss properly
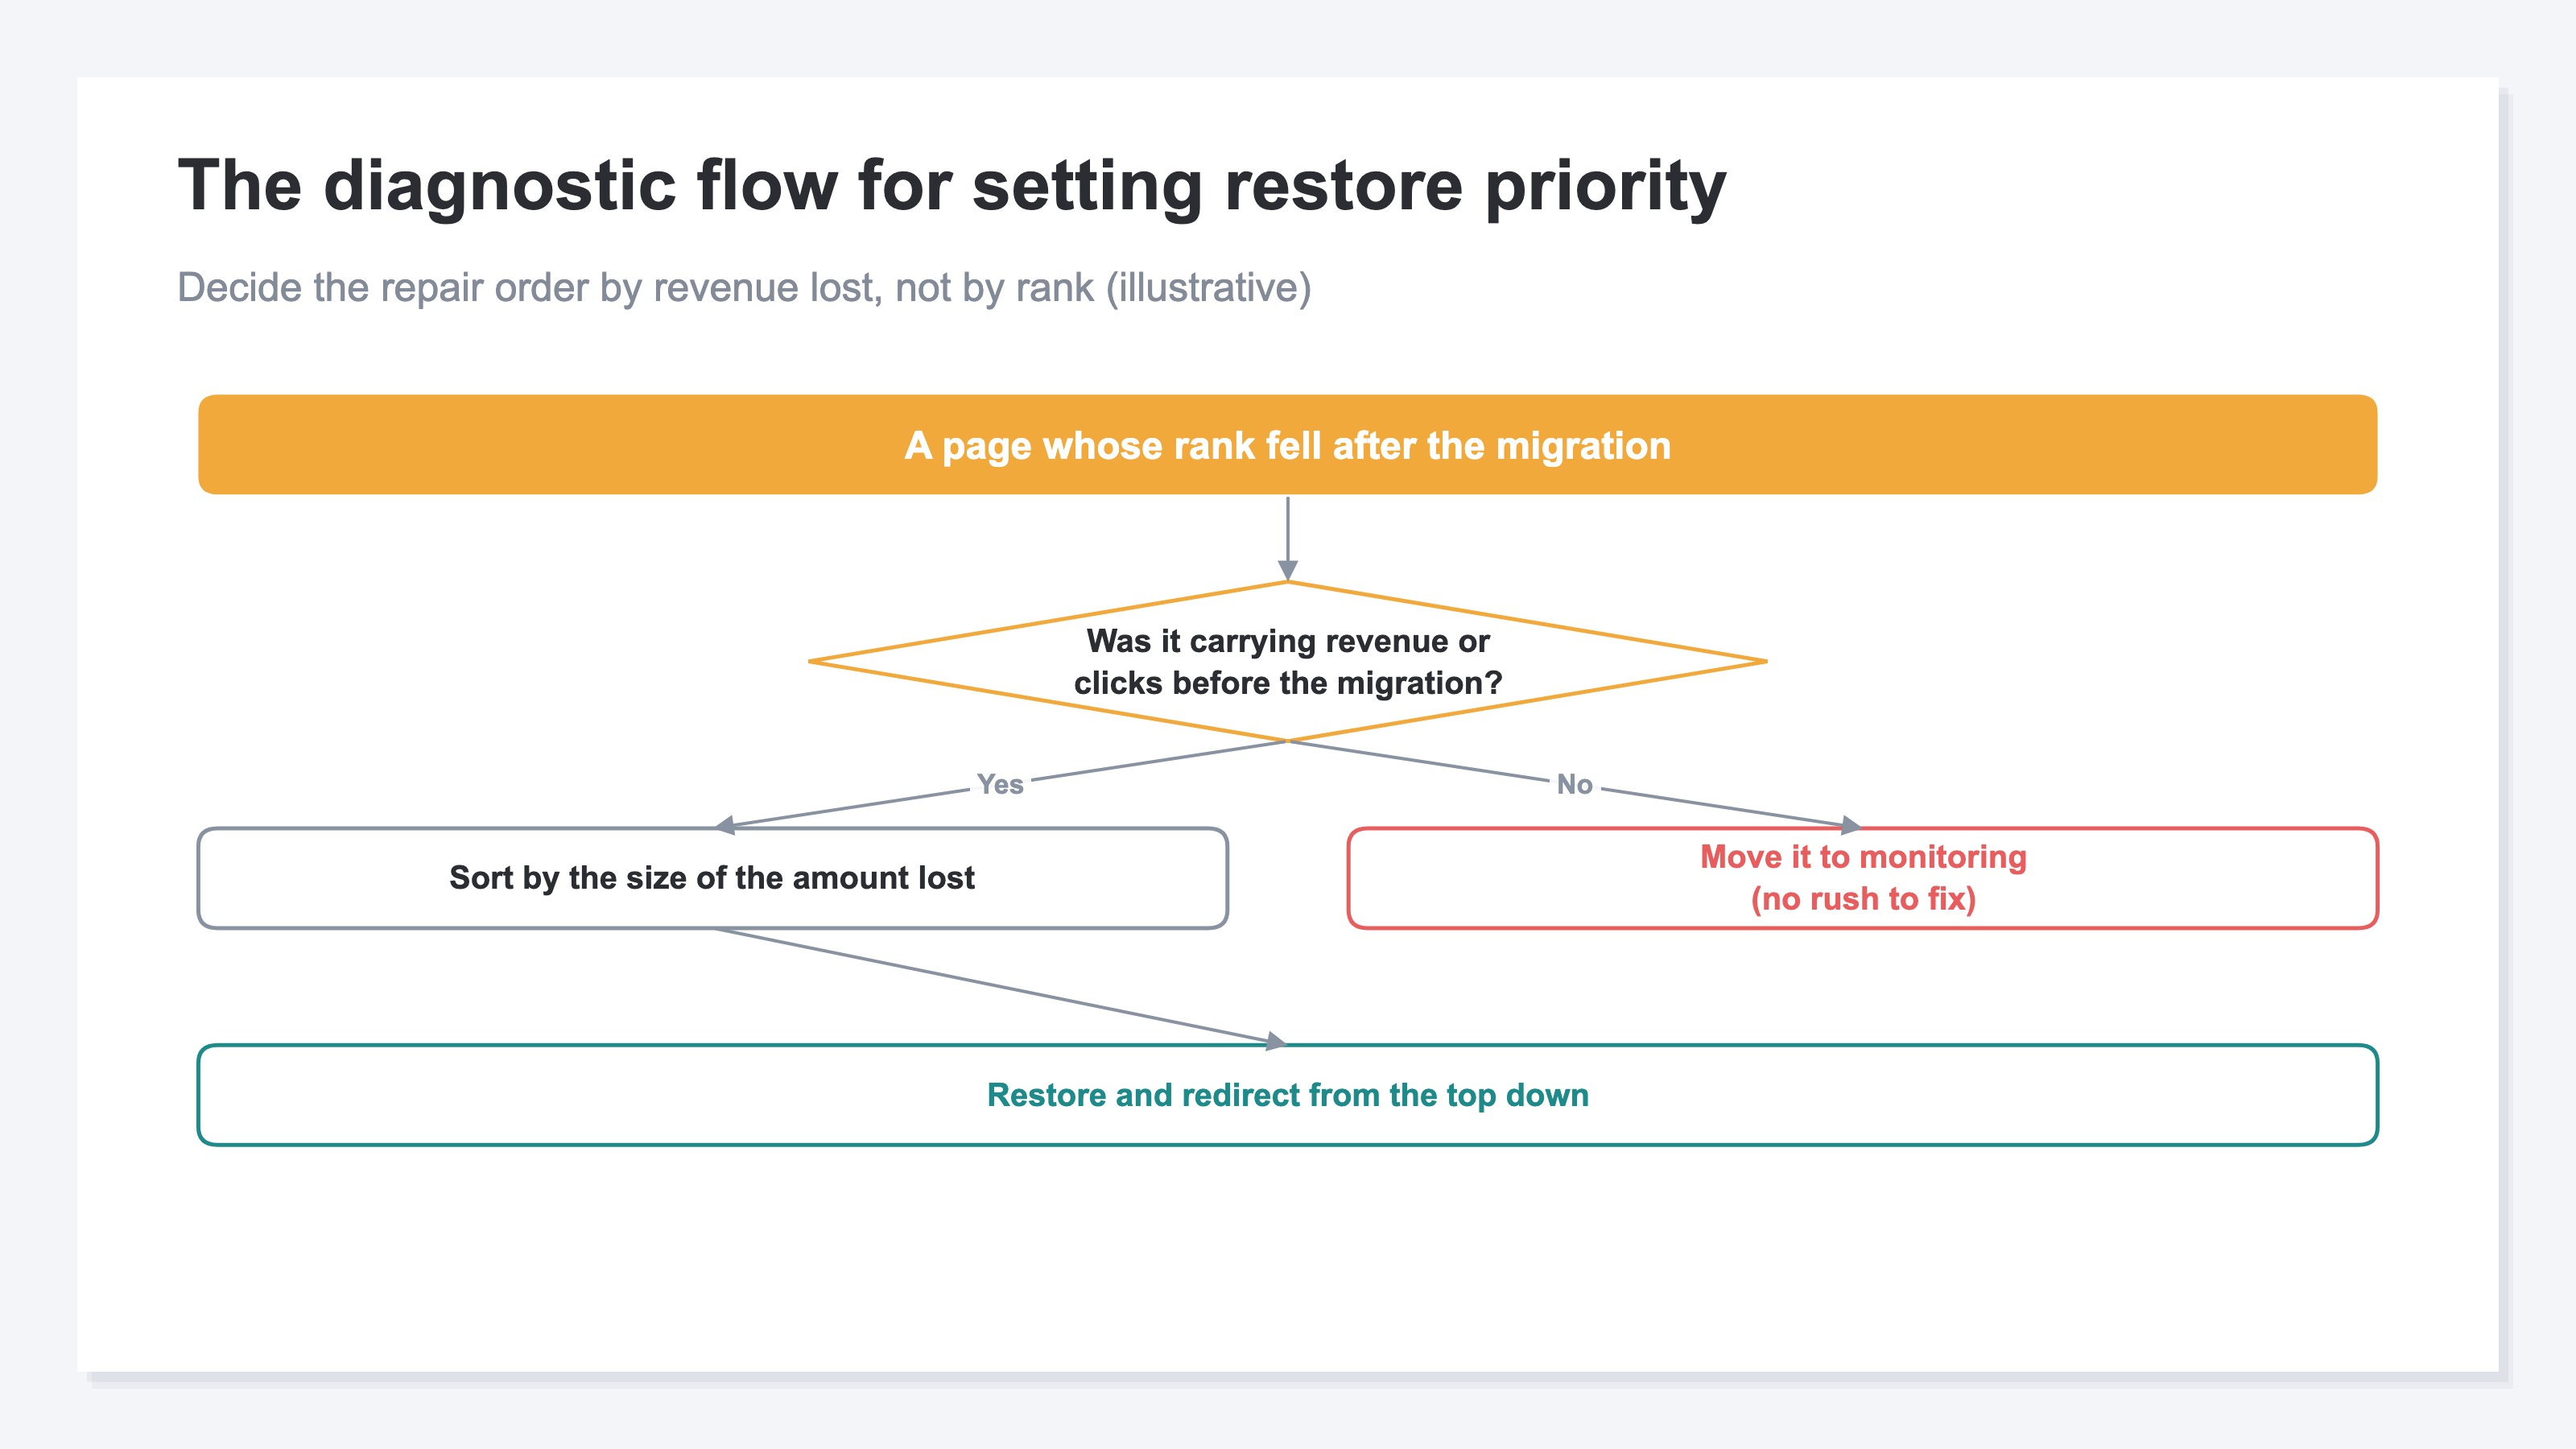
- Once they are named, the next move falls out in revenue order. Restore, redirect again, consolidate — which page you touch first is chosen by the size of what was lost, not by the height of the rank
- The method is simple; keeping dozens to hundreds of pages matched across the migration is not. That is why having per-page revenue readable on one screen pays off
1. The Redesign Didn't Cost You Rank, It Cost You That Page's Revenue#
What the redesign really took is not the rank number but the revenue that page was earning. A rank drop is only the signal; the actual damage shows up in money.
In a redesign or a replatform (moving the site onto a different underlying system), URL structures change and old pages get folded into new ones. A page that used to pull people in from search and turn that into revenue can quietly fall out of search along the way, through a missed redirect or a rewrite of the content. A rank tracker will show you that the keyword lost position. It will not show you how much revenue that page was making every month. So as long as you are reading the rank table, you cannot tell which of the many red arrows is the one that actually hurt.
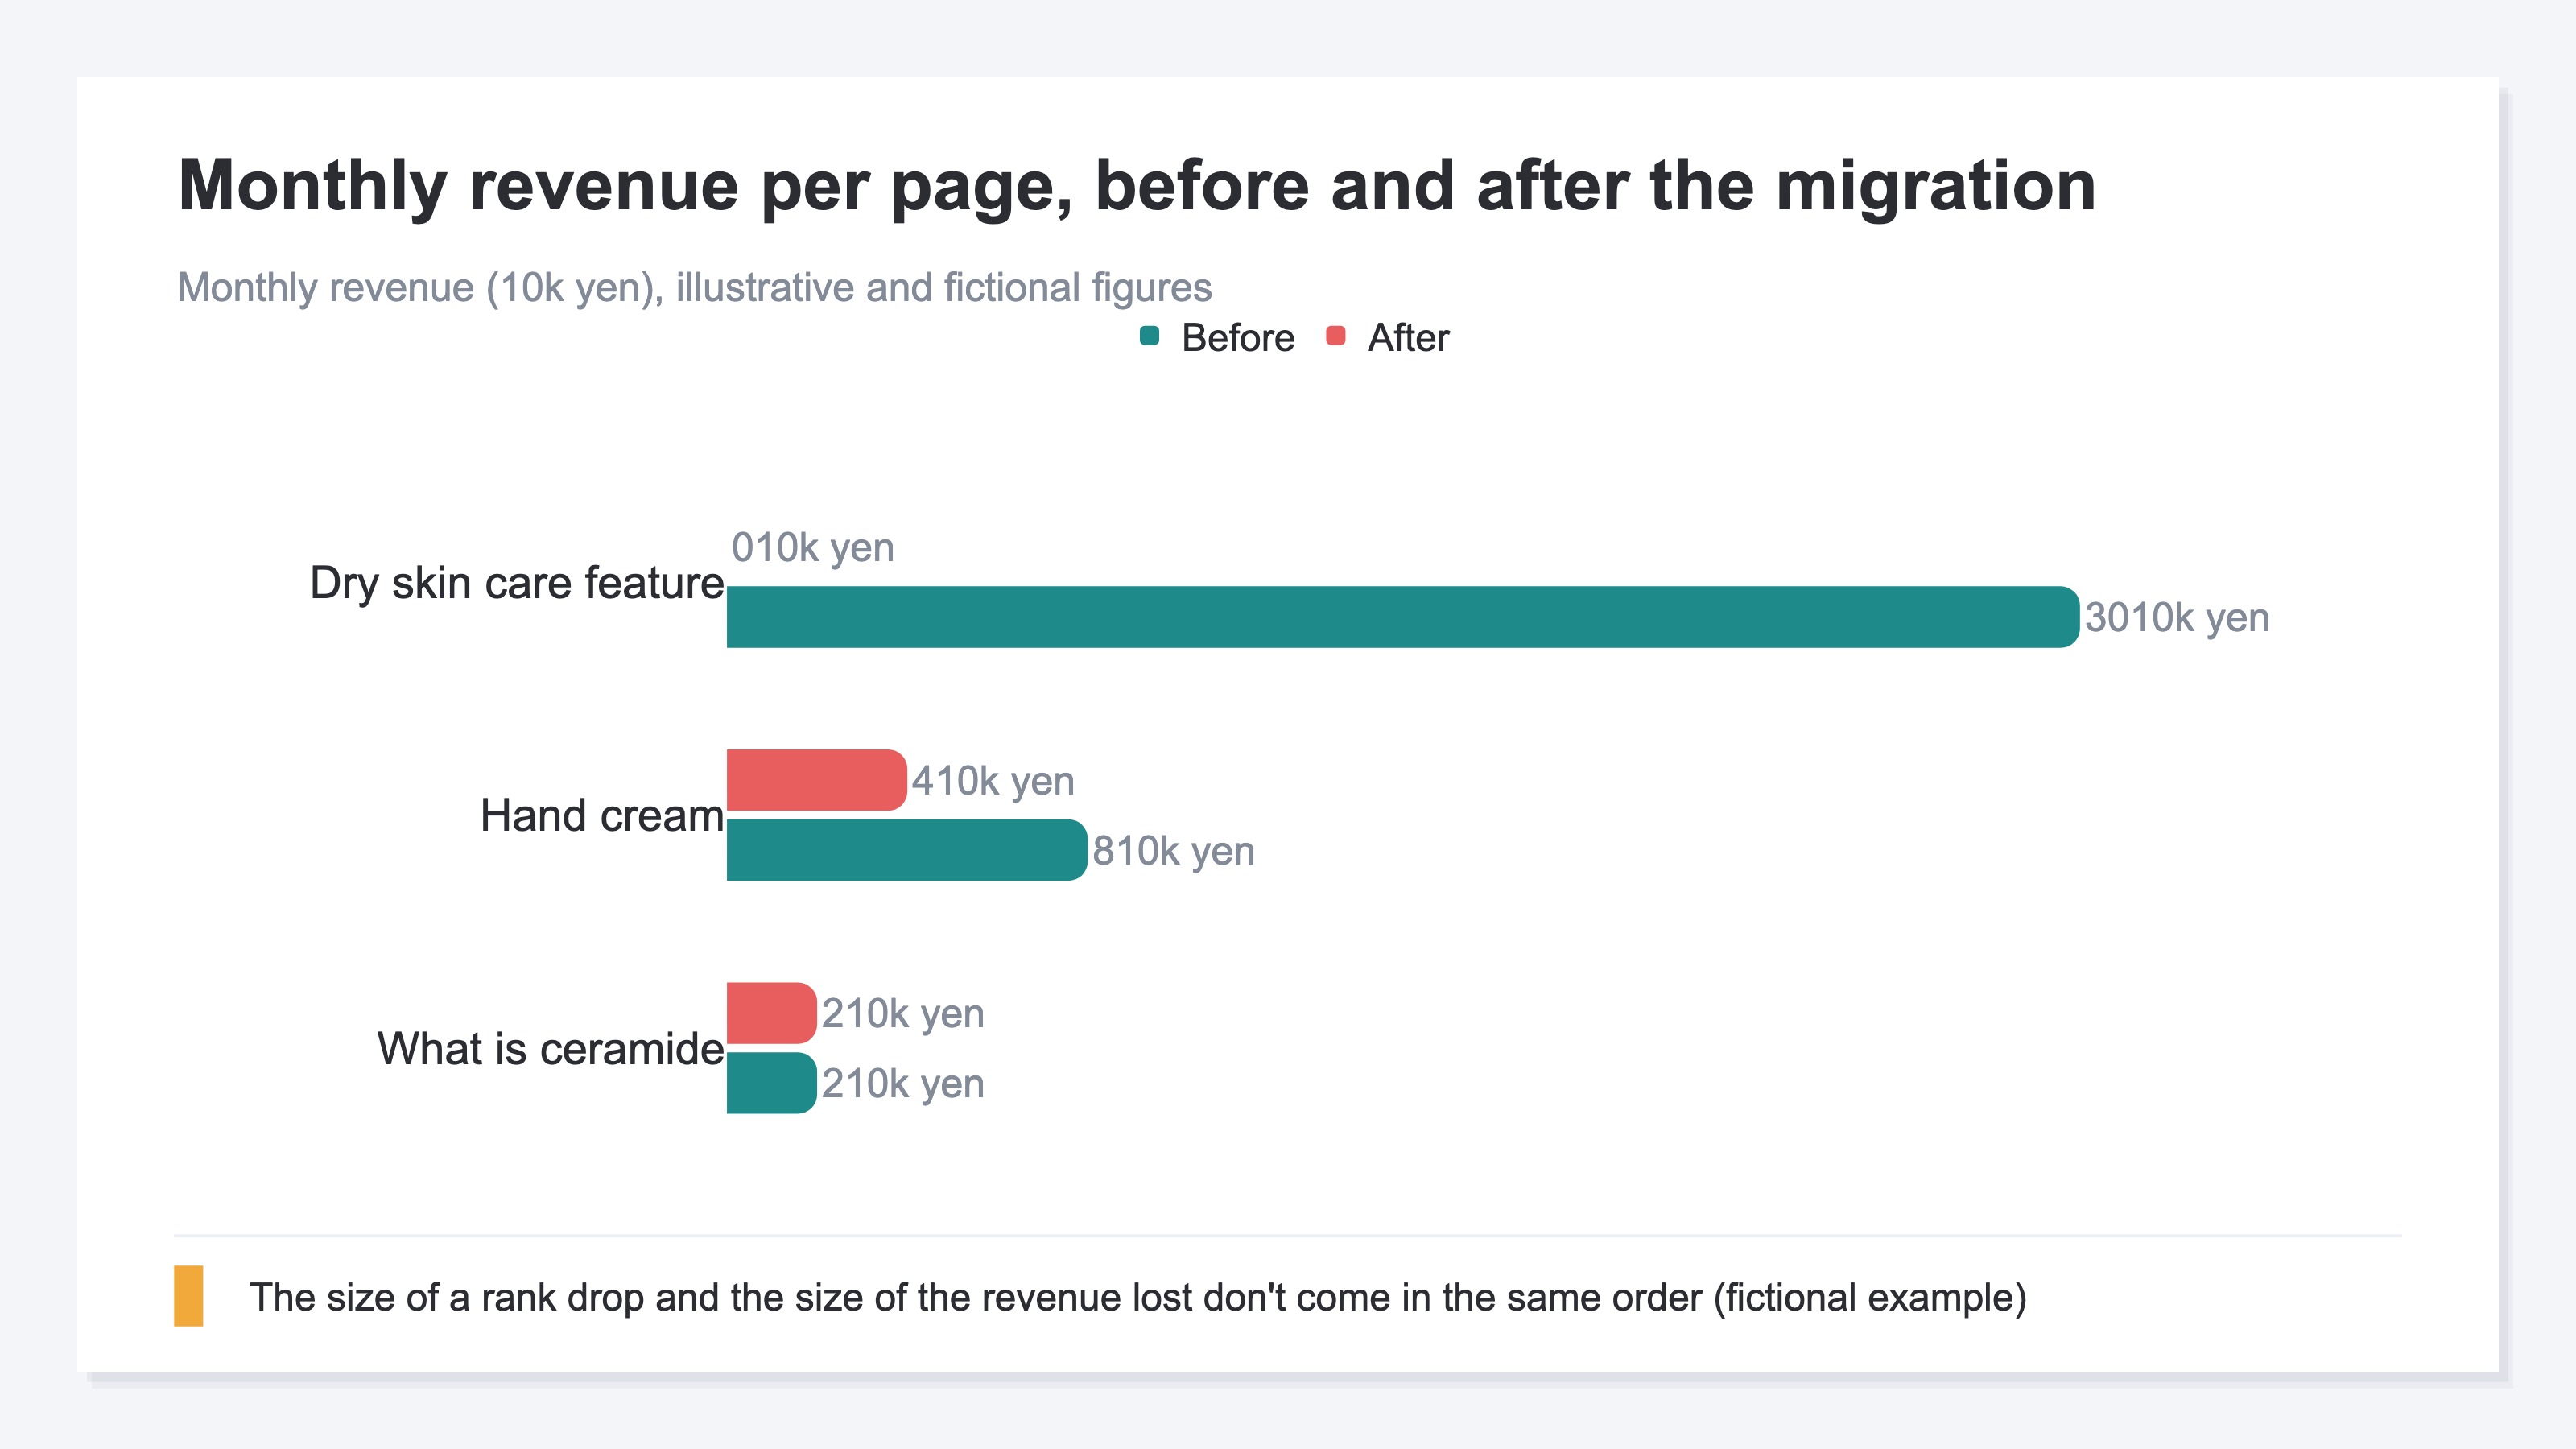
Rank has a trap of its own here. Put a keyword that fell from 10th to 18th next to one that fell from 3rd to 5th, and the larger drop belongs to the first. But if the second one's page was producing hundreds of thousands of yen a month, the second is the one that hurts. Conversely, if the keyword that fell hard was one nobody ever bought from, the drop costs you almost nothing. The size of a rank drop and the size of the revenue lost do not line up in the same order. The general way to spot why a rank fell at all is covered in how to find content that lost search rankings. This article narrows in on one case within that — the single large migration a redesign represents — and re-measures the drop in revenue. So the first thing to do is to look at the lost pages in revenue terms.
2. Name the Lost Pages by Revenue, Not by Rank#
The axis to read on is per-page revenue, not the size of the rank drop. Match how much each page was earning before and after the migration, and name the pages that went quiet by their amount.
Here is how. First, before the migration, record for each page the revenue that started from that page as the entry point. Then, after the migration, read each page's revenue on the same basis. Pages appear that used to bring in a solid amount every month and are now close to zero. Those are the pages that used to earn and have gone quiet. On the rank table it may look like nothing worse than 8th becoming 18th; in revenue it becomes a single line that reads "hundreds of thousands of yen a month are gone." Same event, but the weight of the loss only lands once you put it in money.
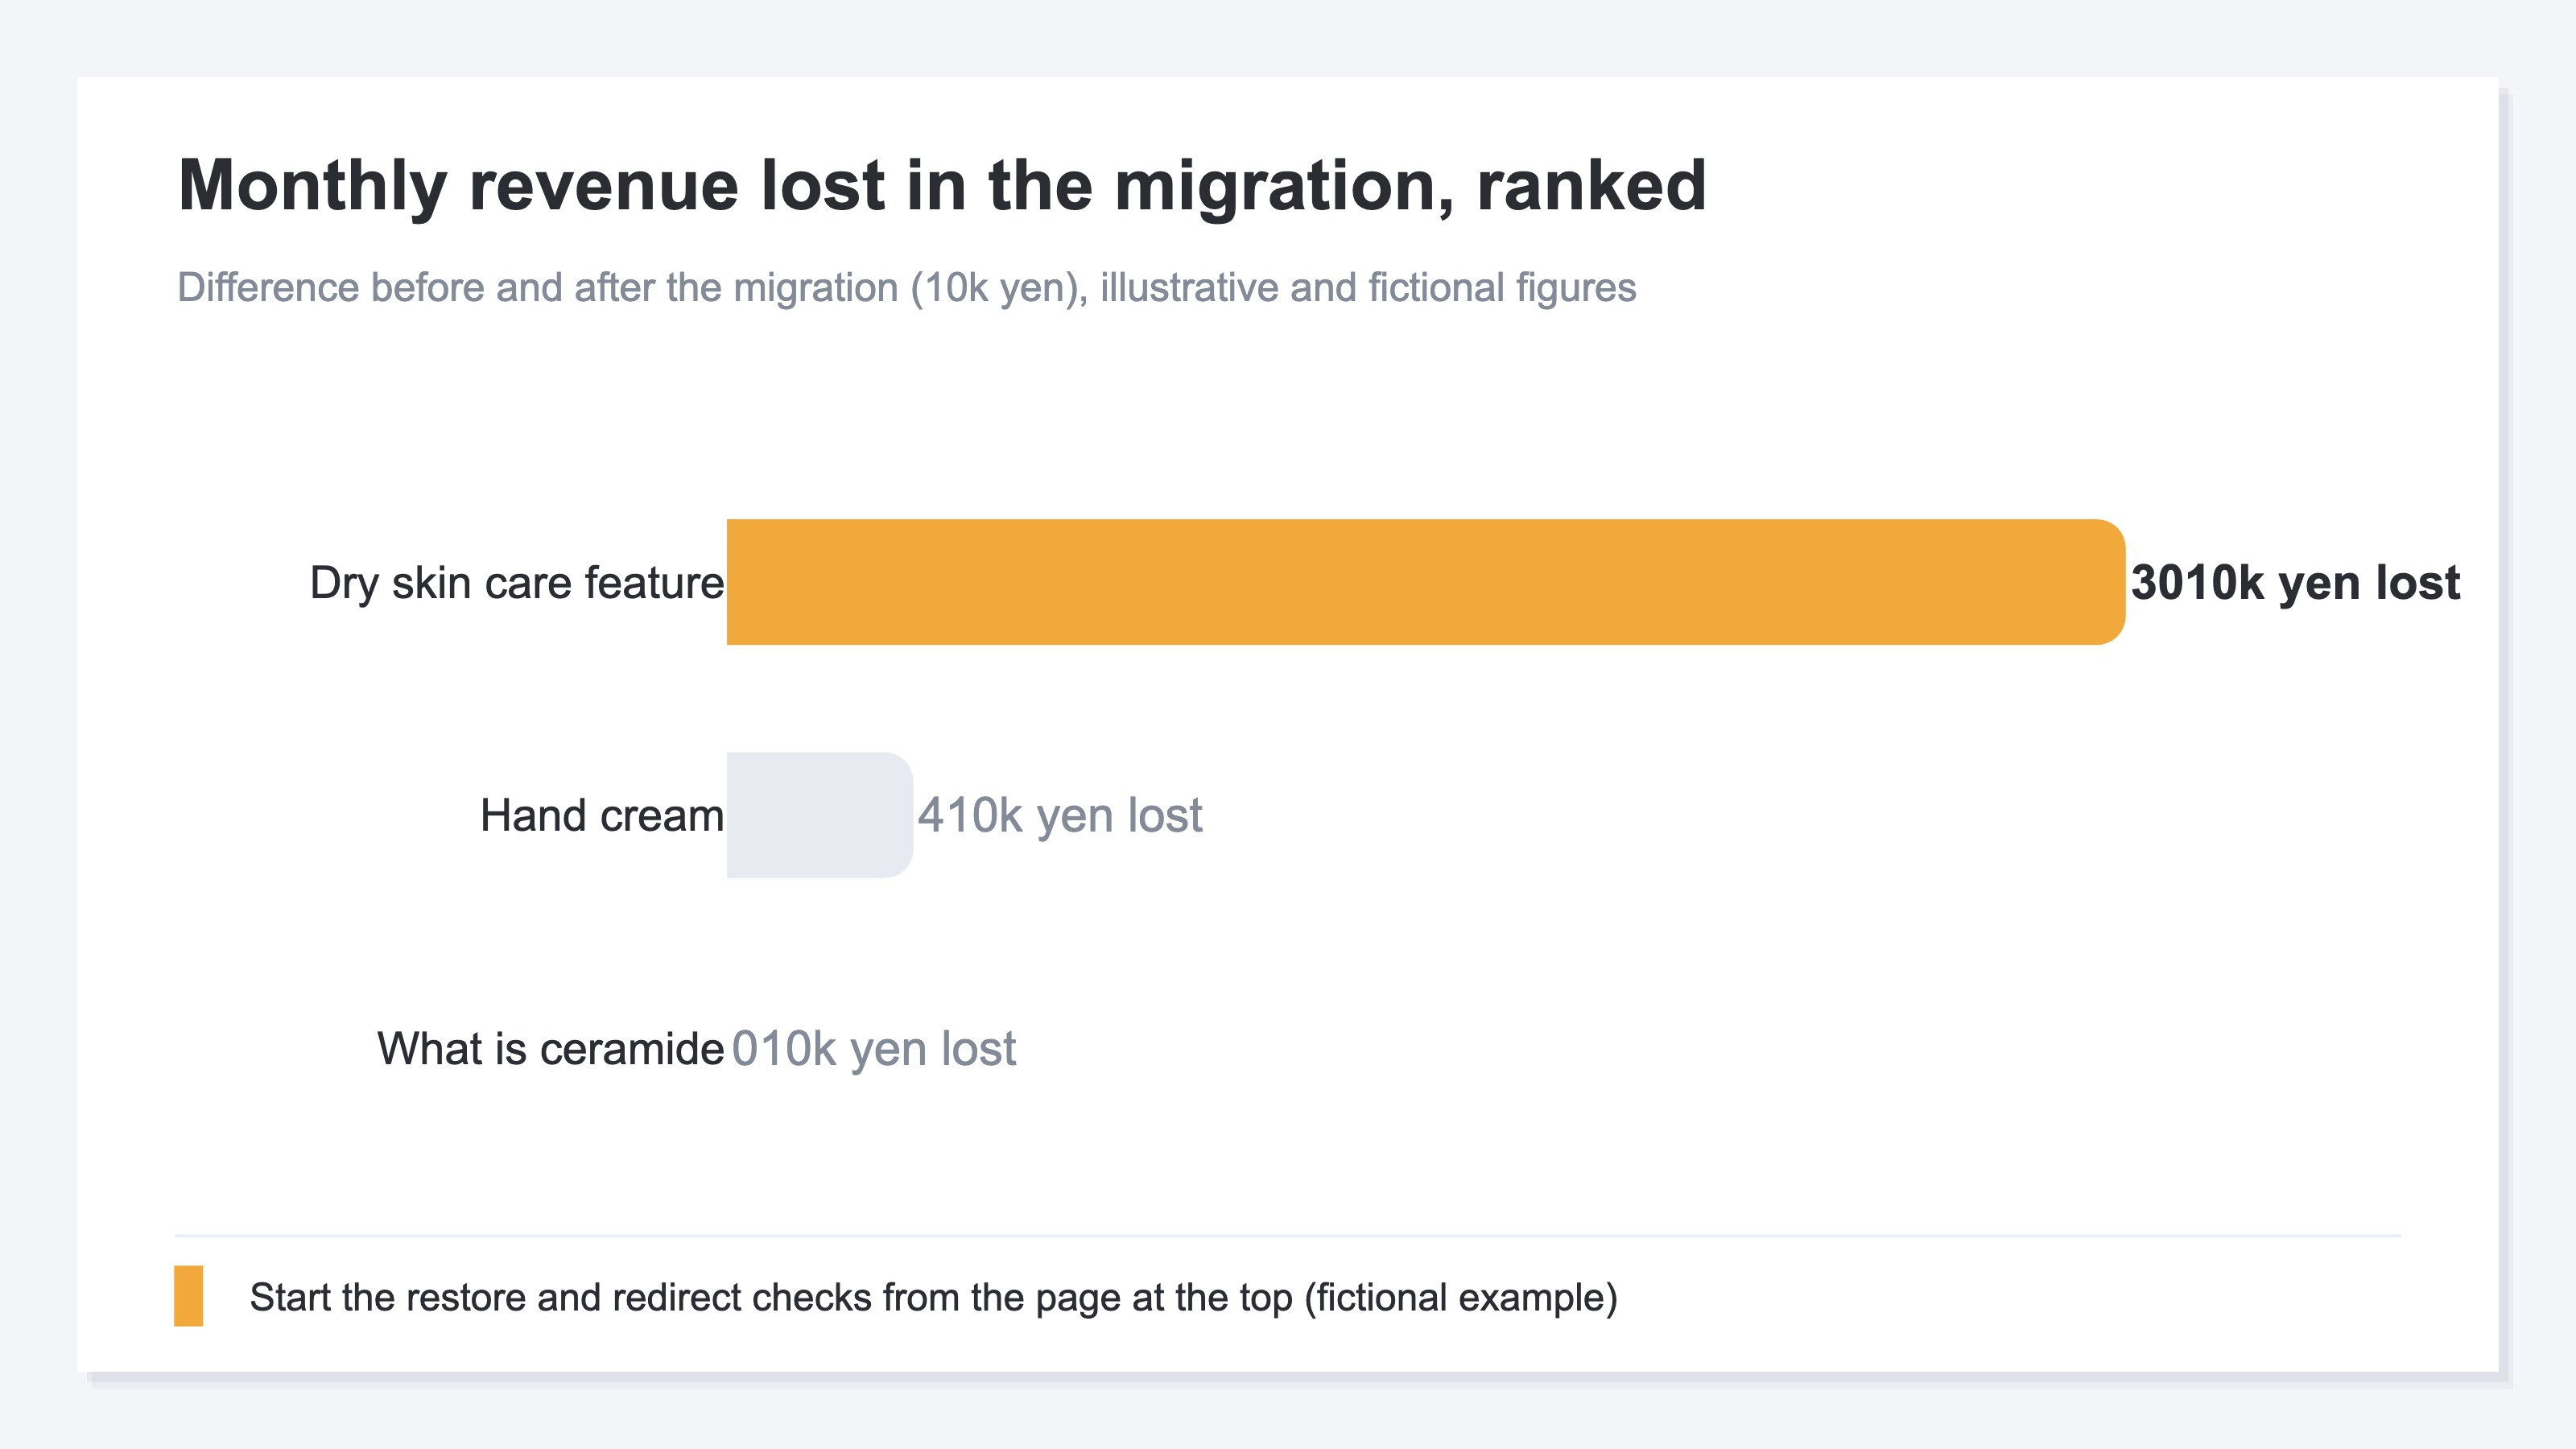
What matters here is ordering the pages not by the size of their revenue but by the size of what was lost — the difference between before and after. A page that was not earning much to begin with slipping a little has small consequences. A page that was a pillar of revenue going quiet is the top priority. In practice, it is not rare to hear that a site was rebuilt from the ground up and its search standing got worse rather than better. Rankings falling after a large rebuild does happen. But as long as the loss is described by the size of the rank drop, you cannot decide where to start fixing. Only once you can name it by the amount lost does the repair order settle.
Run the same exercise on the sample store's data and the per-page revenue difference across the migration clearly diverges from the size of the rank drop. Pages that lost a lot of position barely moved in money, and pages whose position slipped only slightly lost a great deal of revenue. That inversion only surfaces once the pages are re-sorted by the difference in amount. Which pages to restore after the migration, and where to put the redirects back — you get to choose that order by the revenue lost rather than by rank.
3. Why Matching Revenue Before and After the Migration Doesn't Stick#
The method is simple enough as described. What is heavy is actually keeping it aligned, across pages, before and after the migration.
There are dozens to hundreds of pages. A rank tracker gives you rank only; it does not hold how much revenue a page was producing. Analytics, meanwhile, will report page views but is not built to compare "revenue that started from this page" across a migration. Revenue happens at a separate touchpoint — the purchase — and it is hard to tie back to a specific entry page at page level. So you end up moving between the rank tracker, the analytics tool and a spreadsheet, pasting rank and revenue together page by page. Doing that once right after the migration is one thing; redoing it for every page every time you want to check is not something anyone keeps up.
On top of that, the period right after a redesign is exactly when isolating the cause of a rank drop is hardest. Migration settings, rewritten content, seasonality, an algorithm update — there are too many variables to pin the cause on one. Which is precisely why you first need the money facts, "which page lost how much revenue," visible at a glance without hesitation. Before you argue about causes, pinpoint in money where revenue is being lost. Doing that by hand is heavy, and it has to be repeated at every check. That heavy repetition is the number one reason lost pages go unnoticed.
Isolating why a rank fell is left to other articles. If rank is unchanged and only clicks are down, the cause may be AI summaries (same rank, fewer clicks). If the migration breaks the revenue measurement itself, how to carry it over is covered in cart migration without losing your analytics. This article stays one step earlier and concentrates on pinning down which page lost how much revenue.
RevenueScope solution
By this point it is clear that a post-redesign loss is measured by per-page revenue, not by the size of a rank drop. The pattern is to name, in money, the pages that used to earn and went quiet across the migration. What remains is how to see that matching for every page at once.
RevenueScope displays, page by page, the revenue that started from a page as the entry point (landing revenue). Landing revenue is the amount collected by tying purchases that began in a session entering on that page back to the entry page (purchases made after browsing onward are also counted back to the entry page). Alongside it, the same screen shows each page's visits compared with the prior period and how that page's search position has moved. So after a migration, pages where "visits fell sharply against the prior period and landing revenue disappeared" are surfaced at the top of the list without waiting for the rank drop (display uses demo data).
Below is one example (illustrative). The figures and page names are fictional.
| Page | Rank (before → now) | Search clicks (before → now) | Landing revenue | Status |
|---|---|---|---|---|
| Dry skin care feature | 5th → 9th | 2,000 → 150 /mo | ¥300,000/mo | Stalling |
| Summer UV care feature | 3rd → 15th | 1,200 → 90 /mo | ¥90,000/mo | Stalling |
| Hand cream | 6th → 8th | 700 → 300 /mo | ¥50,000/mo | Stalling |
| What is ceramide | 8th → 10th | 2,600 → 2,500 /mo | ¥20,000/mo | Steady |
What distinguishes this example is that it shows landing revenue and search clicks against the prior period side by side, rather than the size of the rank drop. The higher the row, the more that page used to earn and the more it went quiet after the migration, and the larger the amount lost. Reading a rank tracker alone, your eye would have gone to the keywords with the biggest drops, and the silence of the pages that were actually earning would have been pushed down the list. When per-page landing revenue and the prior-period comparison can be compared on one screen, the order of moves settles. Which page to restore first, which to redirect again, which to leave for now — you choose on the revenue lost rather than on rank. Compare against the record from before the migration and the loss from the pages that disappeared reads straight off as an amount.
RevenueScope does not display gross margin, inventory or lifetime revenue per customer. It narrows to the measures that capture a migration's loss in money: per-page landing revenue, visits against the prior period, and how search position has moved. Landing revenue is measured on an entry-page basis, showing which pages' revenue fell most, by size and direction. So with RevenueScope in place, you can settle which page to fix first after a redesign by the amount lost rather than by the height of the rank.
FAQ#
Frequently asked questions#
Q. Rankings fell after the redesign. What should I look at first?
A. Look at per-page revenue, not the size of the rank drop. More often than not, a page that used to bring in a solid amount and lost its revenue after the migration costs you more than the keyword that fell furthest. Start by ordering the pages that used to earn but lost their visits and revenue, largest amount first, and put your restore and redirect work there. In that order, the limited time you have goes into the fixes that move revenue.
Q. If I have a rank tracker, can I see what the lost pages cost me?
A. A rank tracker shows position moving up and down; it does not hold how much revenue that page was producing. So you learn that the rank fell, but not how much revenue disappeared. To see the loss in money, you have to match revenue that started from the page across the migration, separately from rank. A rank tracker and a revenue view do different jobs.
Q. Can I trust per-page revenue as an exact amount?
A. It is not an amount that pins down the exact yen. Landing revenue is a measurement that collects purchases beginning in a session that entered on that page back to the entry page, counting purchases made after browsing onward back to the entry as well. So use it less for the amount itself and more for reading size and direction: which pages' revenue fell hard, and which came through unharmed. Because the conditions are stated up front, it holds up well as the basis for deciding which page to fix first.
Summary#
When a redesign or a replatform drops your rankings, what is really lost is not the rank number but the revenue that page was producing every month. The red arrows lined up in a rank tracker will not tell you which one was the real loss, because the size of a rank drop and the size of the revenue lost do not come in the same order.
So move the axis you read on from rank to revenue. Match how much each page was earning before and after the migration, and name in money the pages that used to earn and went quiet. Once they are named, restore, redirect again, consolidate — which page you touch first gets chosen by the amount lost rather than by the height of the rank. The method is simple, but keeping dozens to hundreds of pages aligned across the migration is heavy work. Which is why, with per-page landing revenue, visits against the prior period and position movement readable on one screen, the lost pages stop slipping past and the repair order rests on revenue.
See which ads actually drive revenue, at a glance
Free up to 5,000 sessions/month, AI analyst included. No credit card required. Up and running in 5 minutes.