"If you're going to rewrite, which article should you start with?" One article sits a step away from page one; another has a low conversion rate (CVR) — everyone picks differently. Yet every approach shares one blind spot. Choose which articles to rewrite by familiar metrics like rank or CVR alone, and you quietly let the ones actually driving revenue slip through. This article works through a way to set your rewrite priority by "period-over-period movement × landing revenue," using real data from a sample EC store.
Contents
TL;DR#
-
Pick rewrites by rank or CVR alone, and you miss revenue
You know in your head to "choose by revenue," but the actual selection gets pulled toward clicks and rank. That gap between intent and execution is what creates the misses.
-
Seen through "period-over-period movement × landing revenue," the priority changes
Cross the change in clicks with landing revenue, and articles split into five states — decaying, growth candidates, rising, out-of-range exposure, and stable — surfacing an order you can't see from rank or clicks alone.
-
Zero-click "out-of-range exposure" can top the revenue list
The article you'd cut first when sorting by clicks comes in second overall by landing revenue. Click order and revenue order diverge sharply.
-
Doing it by hand across every page, every month is heavy. Let AI stand in for the judgment.
GA4 and GSC get you close, but repeating a manual aggregation per article every month isn't realistic. Layering external signals over your own landing revenue is territory to hand to AI.
1. Are You Picking Rewrite Targets by Rank or CVR Alone?#
Bottom line: when you pick rewrite targets, looking only at rank or CVR tends to push the articles that actually drive revenue to the back of the line. You know in your head to "fix the articles closest to revenue first," yet in practice the selection stalls at click counts and rank — that gap between intent and execution is the real cause of the misses.
Plenty of articles explain how to prioritize rewrites, and most preach "prioritize the articles closest to conversion." The direction is right. The question is whether you actually move that way. Open GSC (Google Search Console) in real work, and the first things in view are average position and click-through rate. Cross-referencing against revenue takes an extra step, so you end up sorting by "closest in rank" or "most clicks" and deciding from there. It's not that you ignore revenue. The intent is there; execution just gets pulled toward the metrics that are easiest to see.
Google's search ranking is decided by a combination of many factors [1]. Higher rank brings more clicks, but the added clicks don't automatically turn into revenue. People lean their judgment toward the clear numbers right in front of them (rank, clicks). This cognitive bias prioritizes "articles that are close in rank but produce no revenue" and hides "articles that are unremarkable in rank but carry revenue." So you need to shift the yardstick you choose by, one notch.
2. Ranking Articles by Movement and Revenue Changes the Priority#
Bottom line: look at articles through two lenses — "how clicks moved versus the previous period" and "the landing revenue that article generated" — and the order you should fix them in changes. Cross movement with revenue, and articles split into five states, surfacing a priority you couldn't see from rank or clicks alone.
Here's the idea. Put "how clicks changed period-over-period" on the horizontal axis and "the size of the landing revenue generated with that article as the entry point" on the vertical. Place articles on these two axes, and they split into roughly five states: decaying (losing steam), where clicks have fallen; growth candidates that will grow with a little push; rising, with momentum; out-of-range exposure, shown in results but barely getting clicks; and stable, which you can leave alone.
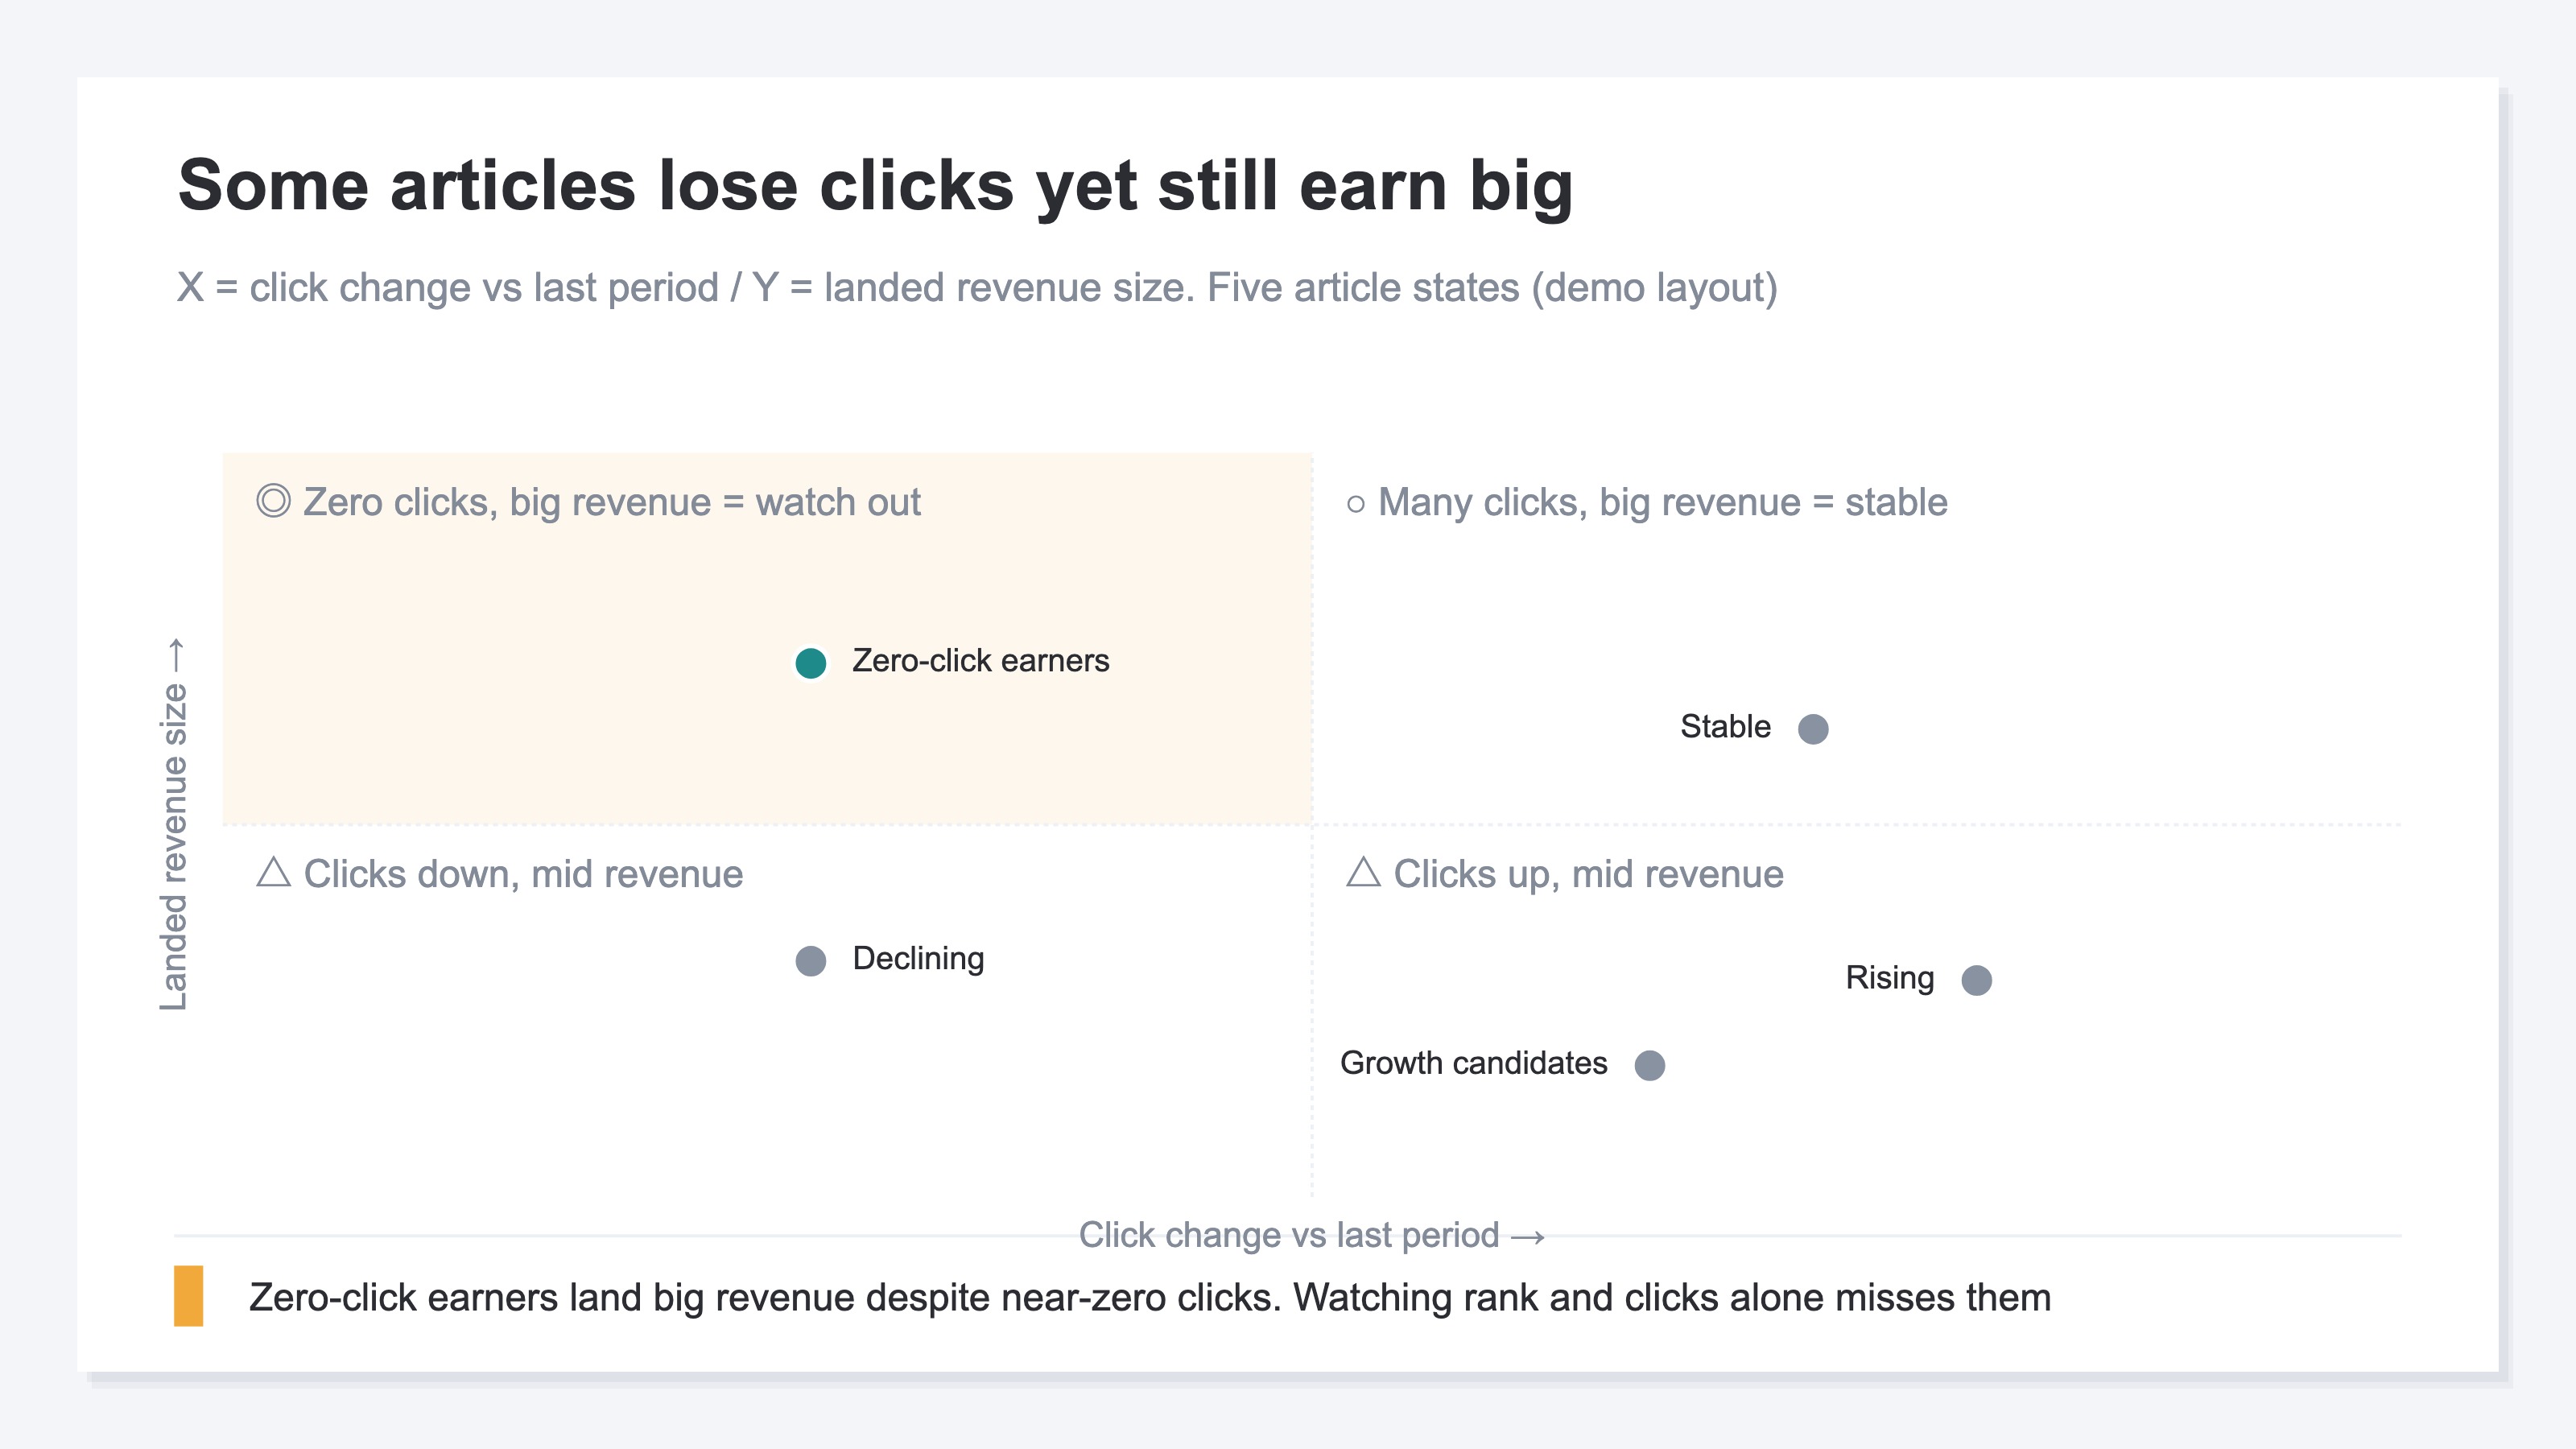
What matters in this chart is that click movement and revenue size don't necessarily line up. The group whose clicks are falling but whose landing revenue is large (decaying) can't be left alone. Conversely, the group with decent clicks but small landing revenue barely moves revenue even if you fix it. Landing revenue here means the revenue of sessions that entered through that article (purchases made after browsing on to another page are counted back to the entry article). Put this "entry-based revenue" on the vertical axis, and the priority landscape shifts from what you saw looking only at rank and clicks.
By the way, when rank hasn't changed but clicks alone have fallen, an AI summary may be pre-empting the answer, and that calls for a different read than decay. That distinction is covered in detail in rank steady but clicks falling.
3. The Articles That Look Ordinary but Drive Revenue#
Bottom line: the easiest to miss is the article that's unremarkable in both rank and clicks yet earns solidly in landing revenue. In particular, "out-of-range exposure" — shown but with clicks near zero — gets cut first when you sort by clicks, but it can climb into the top ranks by landing revenue.
Take the same set of articles and re-sort them by "priority in click-count order" and "priority in landing-revenue order," and the orders don't line up cleanly. Articles that sank to the bottom by clicks jump straight to the top by landing revenue. In particular, an article with clicks near zero that still carries revenue will never surface as long as clicks are your yardstick.
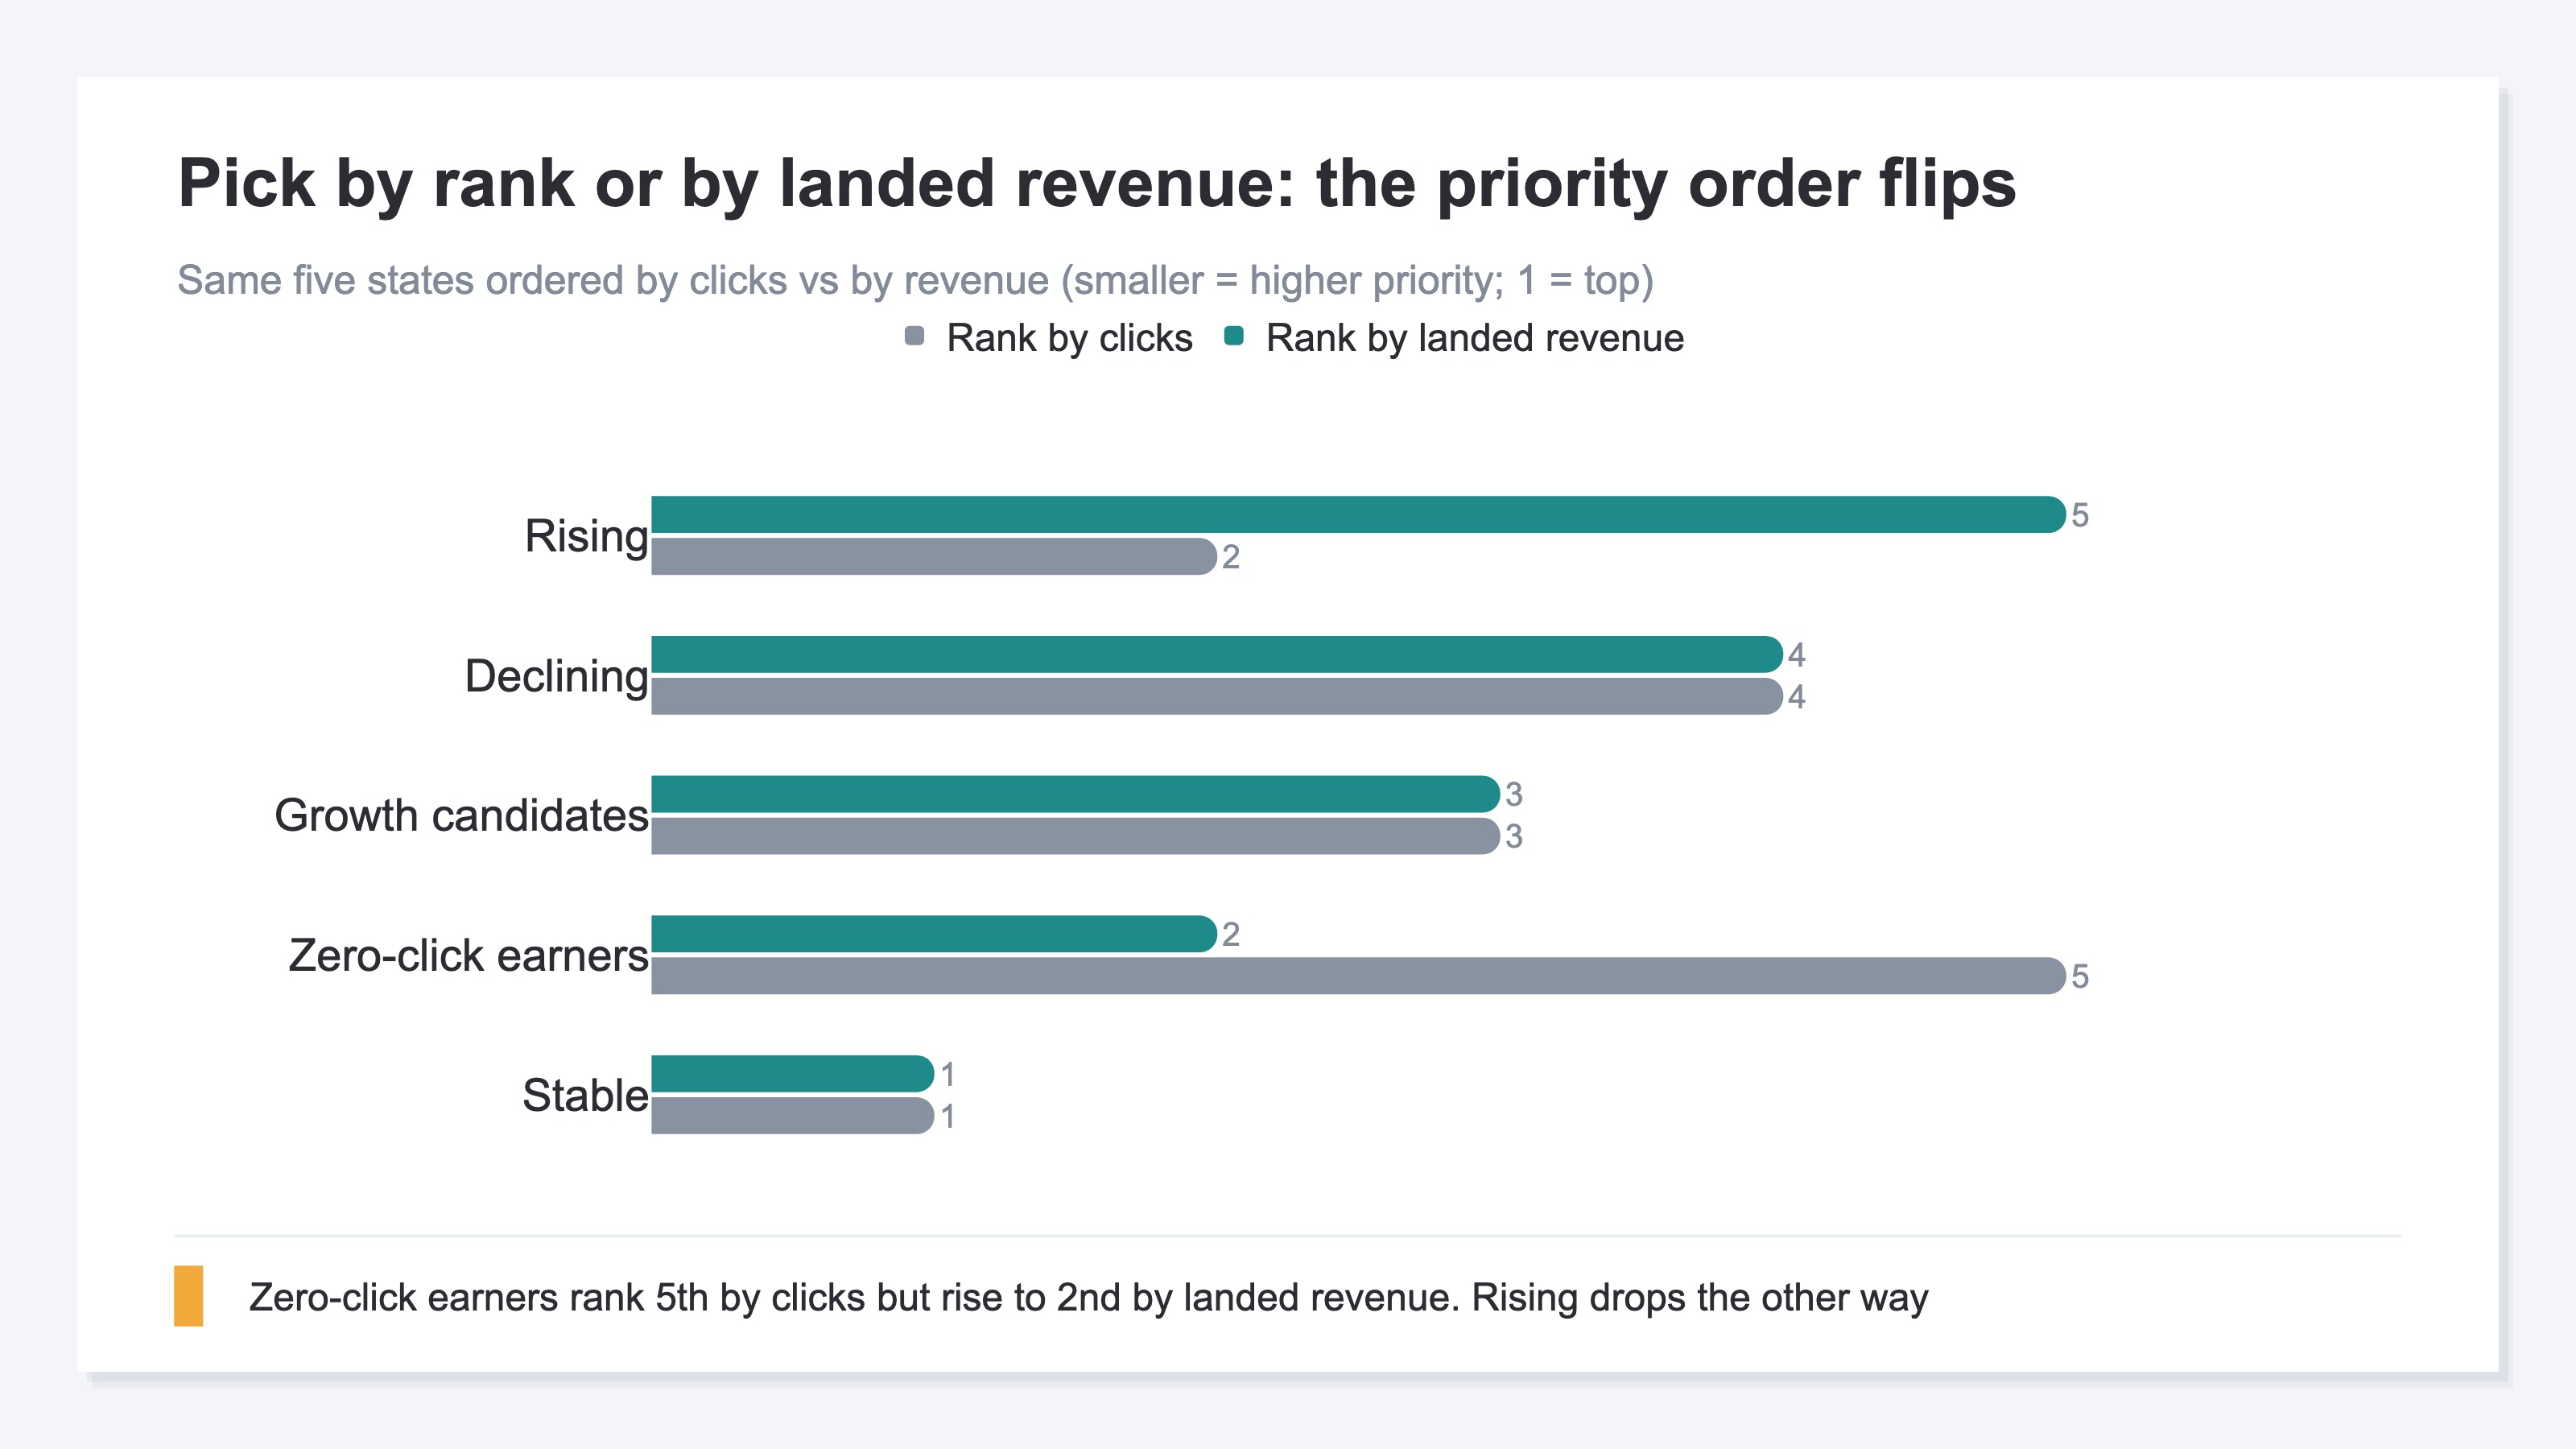
Misses come in a few typical forms. The first is out-of-range exposure right now: shown in search results but not clicked, yet still tied to revenue through branded searches or browsing. The second is growth candidates: articles sitting around rank 4–20 that, with a little push, reach the top of page one — the upside here is large. A way to choose which search terms are "one step away," revenue included, is laid out in choose striking-distance keywords by revenue. The third is articles that get impressions and clicks but aren't read, so revenue never follows (pages with high impressions but low readership).
One more thing worth holding as input is AI-referred traffic. Even when search rank is unremarkable, some articles carry traffic and revenue off the back of ChatGPT or Gemini answers. Conversely, some valuable articles get almost no AI-referred traffic, and those need a different angle to catch (articles AI isn't citing). Rank, clicks, landing revenue, and AI-referred traffic — layer these four, and only then do the "articles that look ordinary but drive revenue" come into view.
4. How to Check It on Your Own Site Today, and Where It Breaks Down#
Bottom line: with GA4 and GSC, you can get close to this distinction by hand. But repeating "aggregate every article's landing revenue across the board, sort into states period-over-period, and produce a priority" every month is, in reality, far too heavy. This is the line where you should hand it to automation.
First, in GA4's exploration reports, line up "landing page × revenue" and you can see, close to landing revenue, how much the sessions entering through each article sold. Next, open GSC's search performance report and you can check each page's average position, clicks, and impressions [2]. Cross-reference the two, and in principle you can spot "articles with few clicks but large revenue."
The problem is how heavy that procedure is. For each article, you cut a manual segment in GA4, switch between the previous and current period to compare, pull rank and clicks from a separate GSC screen, and match them one by one. Ten articles you can bear, but at 50 or 100, repeating it every month isn't realistic. And once you add, by hand, the state-splitting line-drawing (decaying, growth candidates, rising, out-of-range exposure, stable) and the AI-referred-traffic matching, the next month arrives before the aggregation is done.
In other words, the direction of the check is clear. Layer GA4's landing-page revenue over GSC's rank and clicks. What's hard is repeating that across every page, every month, in a way that doesn't waver in judgment. This "weight of repetition" is exactly the part a person shouldn't carry by hand — it's what AI should stand in for. Layering external signals (search movement) over your own landing revenue every time to produce a priority — hand that to the machine, and the person concentrates on "how to fix it." That's the realistic division of labor.
RevenueScope helps
Bottom line: RevenueScope automatically sorts your content pages into five states period-over-period, layers measured landing revenue and AI-referred traffic over them, and prioritizes which articles to fix first. Its job is to make the judgment you'd been repeating by hand across every page, every month, something you can tell apart on a single screen.
RevenueScope sorts your site's content pages by their previous- and current-period movement into five states: decaying, growth candidates, rising, out-of-range exposure, and stable. On top of that, for each state it layers measured landing revenue (revenue of sessions that entered through the article, all channels, bots excluded) and whether there's AI-referred traffic, and produces a set recommended action per bucket. For growth candidates, it even shows the "upside search keywords" — those at rank 4–20 with a target set at rank 3. It's like taking over, wholesale, the work of matching GSC and GA4 one page at a time.
Let me show the actual view with sample-store data.
Sample EC store: content improvement plan (30 days, 12 pages total)
| State | Pages | Landing revenue (JPY) | Clicks |
|---|---|---|---|
| Stable | 4 | 125,264 | 839 |
| Out-of-range exposure | 2 | 101,460 | 0 |
| Growth candidates | 3 | 74,479 | 96 |
| Decaying | 1 | 34,965 | 482 |
| Rising | 2 | 34,927 | 174 |
Figures from a fictional store with sample data (RevenueScope demo). Landing revenue is last-touch (revenue of sessions that entered through the article; purchases made after browsing on are attributed to the entry page). Per-page CVR is not shown.
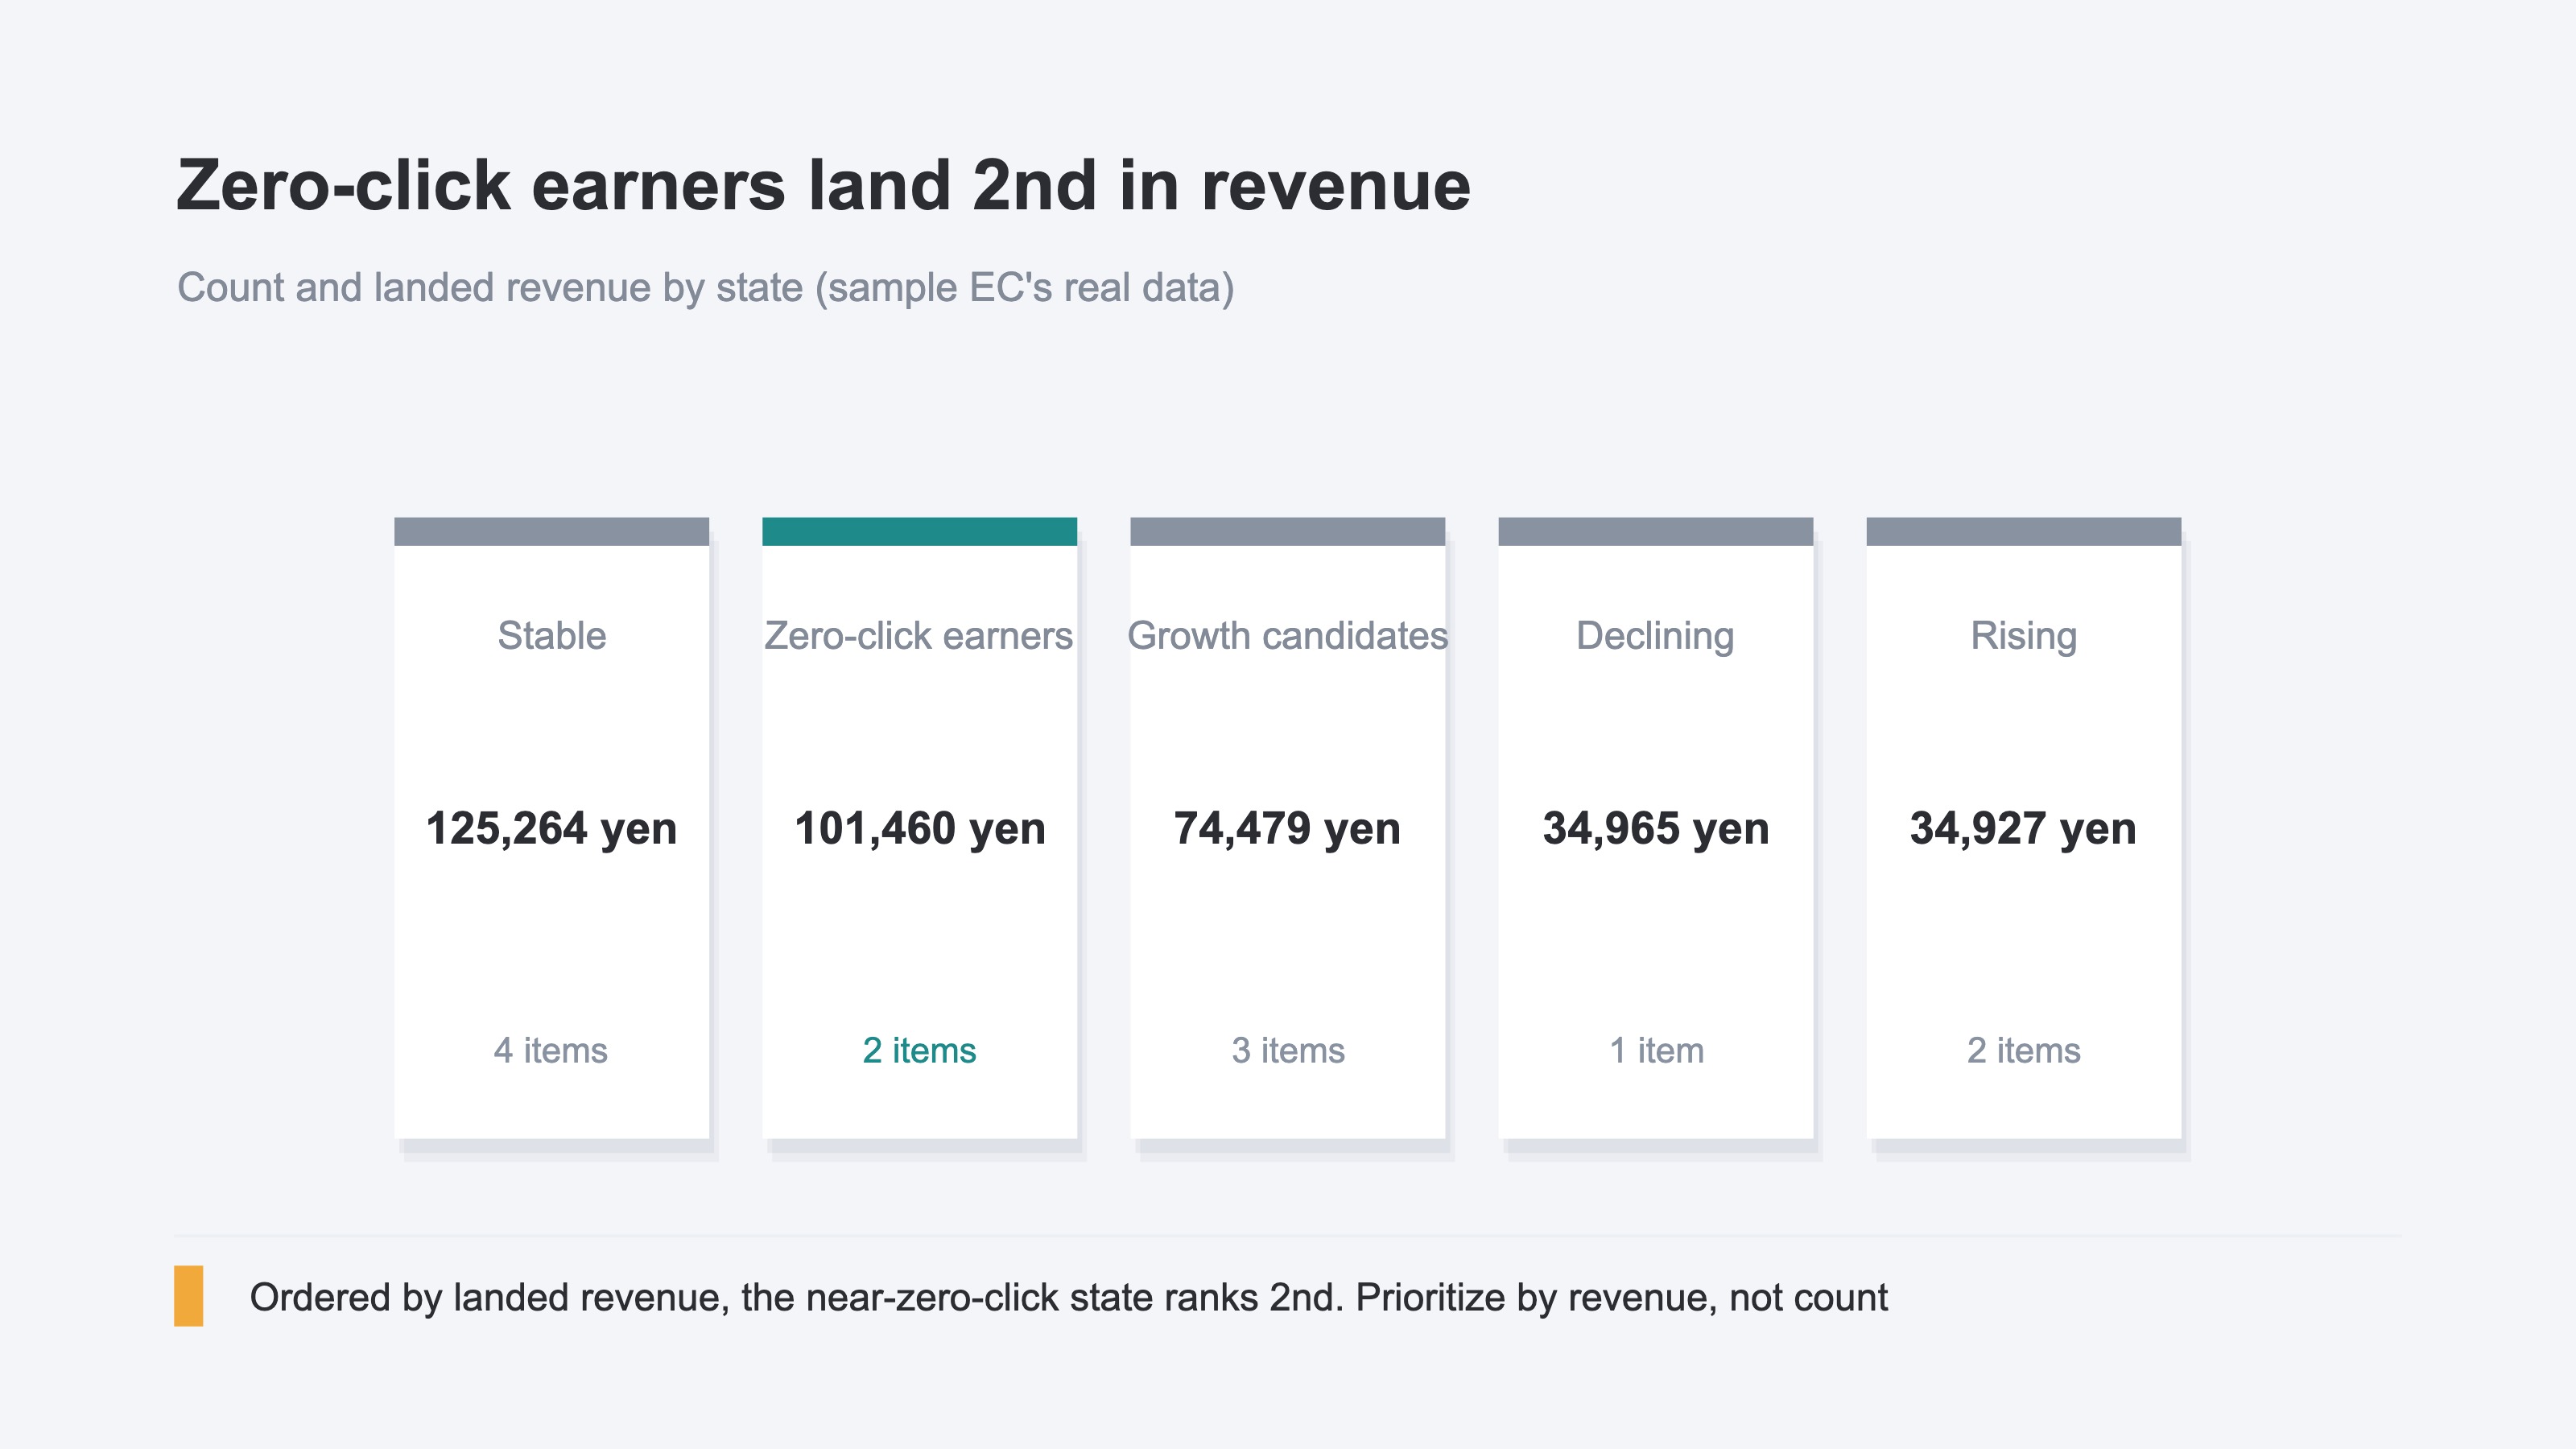
What to read in this table is how far click order and revenue order diverge. "Out-of-range exposure" (zero clicks), the first to be cut when you prioritize by click count, sits at ¥101,460 in landing revenue — second overall, behind only stable. Conversely, "decaying" (482 clicks), the one with the most clicks among the articles you'd want to fix, tops out at just ¥34,965 in landing revenue. That's how far click order and revenue order diverge. So which articles to fix has to be re-sorted by landing revenue, not by clicks or rank.
What RevenueScope produces is the priority for fixing your articles. The recommended actions are a fixed response map per bucket, landing revenue is counted last-touch (attributed to the entry page), and it tells articles apart on landing revenue. The thresholds that split the states are tuned as you operate. RevenueScope makes the monthly, repeated task of telling "which article to fix first" as light as possible. Note that this classification logic matches in figures between the dashboard and MCP (the way you let AI read your numbers).
FAQ#
Q. Isn't the rewrite priority just "fix the ones with the most clicks first"?
A. The article with the most clicks isn't necessarily the one carrying revenue. Even in the sample store, there's a reversal: the zero-click "out-of-range exposure" has larger landing revenue than the "decaying" article with the most clicks. Fix in click order, and you push the articles that carry revenue to the back. Re-sort by landing revenue first, then layer rank and click movement on top to set the priority — that's the safe way.
Q. What's the difference between landing revenue and CVR (conversion rate)?
A. CVR is a rate — "what percent of visits bought" — while landing revenue is an amount — "how much the sessions that entered through that article sold." A high rate with little traffic still means small revenue. An ordinary rate can still mean large revenue depending on traffic and unit price. To see which article, when fixed, moves revenue, sorting by amount (landing revenue) rather than rate alone keeps you from misjudging the priority. RevenueScope doesn't show per-page CVR; it tells articles apart on landing revenue.
Q. I have too many articles to keep up. Where should I start?
A. You don't need to review every article at once. Start with "articles with large landing revenue whose clicks or rank are unremarkable." This is the layer where a few moves are most likely to move revenue. By hand, begin by matching GA4's landing-page revenue against GSC's rank and picking the top few. When repeating that every month starts to feel heavy, it's time to automate the state-splitting and prioritization.
Summary#
Pick which articles to rewrite by rank or CVR alone, and you miss the ones actually driving revenue. Look through "period-over-period click movement × landing revenue," and articles split into five states, revealing the reversal where even zero clicks can top the revenue list. GA4 and GSC get you close, but repeating it across every page, every month without wavering is heavy — that's the territory to hand to AI. Once you've decided which articles to fix by landing revenue, the next thing is the move itself. A way to fix the title before the body is laid out in fix the title before the body. Shift the yardstick you choose by, just one notch, and the same rewriting effort starts working from the places closest to revenue.
See which ads actually drive revenue, at a glance
Free up to 5,000 sessions/month, AI connection included. No credit card required. Up and running in 5 minutes.