Are you checking each article's conversion rate (CVR — the share of visits that end in a purchase) to confirm whether it's driving results? The trouble is that article CVR tends to come out lower the better the article is, and taking it at face value makes you misread good articles as failures. The reason is simple: readers don't buy on the spot while reading the article. This piece works through the idea of reading articles by "landing revenue" rather than by rate, using real data from a sample EC store.
Contents
TL;DR#
-
Article CVR comes out lower the better the article is
Readers don't buy while reading. An article's job is to open the door to a purchase and nudge it along; the moment of buying comes days later, on a different page. Measure by CVR and every article looks uniformly low, so good and bad become impossible to tell apart.
-
Judge by CVR and you misread good articles as failures
You read the low rate as "not working" and cut an article that's actually carrying revenue. This is the easiest accident to have.
-
Read by landing revenue and the order changes
Re-sort by the revenue of sessions that entered through the article (landing revenue), and articles that sank under CVR rise to the top. In the sample store, a zero-click article ranks second overall by revenue.
-
Not showing per-page CVR is a deliberate choice
Articles aren't things to measure by rate, so we don't show per-page CVR. Whole-site CVR and the CVR of purpose-built purchase pages, though, are valid. Match the metric to the target.
1. Why Article CVR Comes Out Low#
Bottom line: article CVR is low not because the article is poor, but because readers don't buy on the spot — the purchase happens days later, on a different page. CVR measures "did they buy within the same visit," so it can't pick up an article's real contribution in the first place.
CVR represents "what percent of visits reached a purchase." On a product or checkout page that rate is straightforwardly meaningful, because those places assume the visitor buys then and there. Articles are different. A reader usually arrives while looking into a problem, comparing options, or gathering information — not with their wallet open. An article's job is to spark awareness of a product and nudge the purchase along; the buying itself usually comes later, on another day, on a different page.
So article CVR comes out structurally low. Even when the article helps, the reader doesn't buy within that visit; a few days later they search the brand name again, or return from a bookmark, and buy there. Because CVR puts "bought within the same visit" in its numerator, that later purchase isn't counted as the article's result. Helpful and mediocre articles alike come out low, on the single fact that no one buys within the same visit. On the separate, quality question of whether a page is even being read, how to spot pages that aren't read goes further — and reading to the end sits at yet another remove from buying.
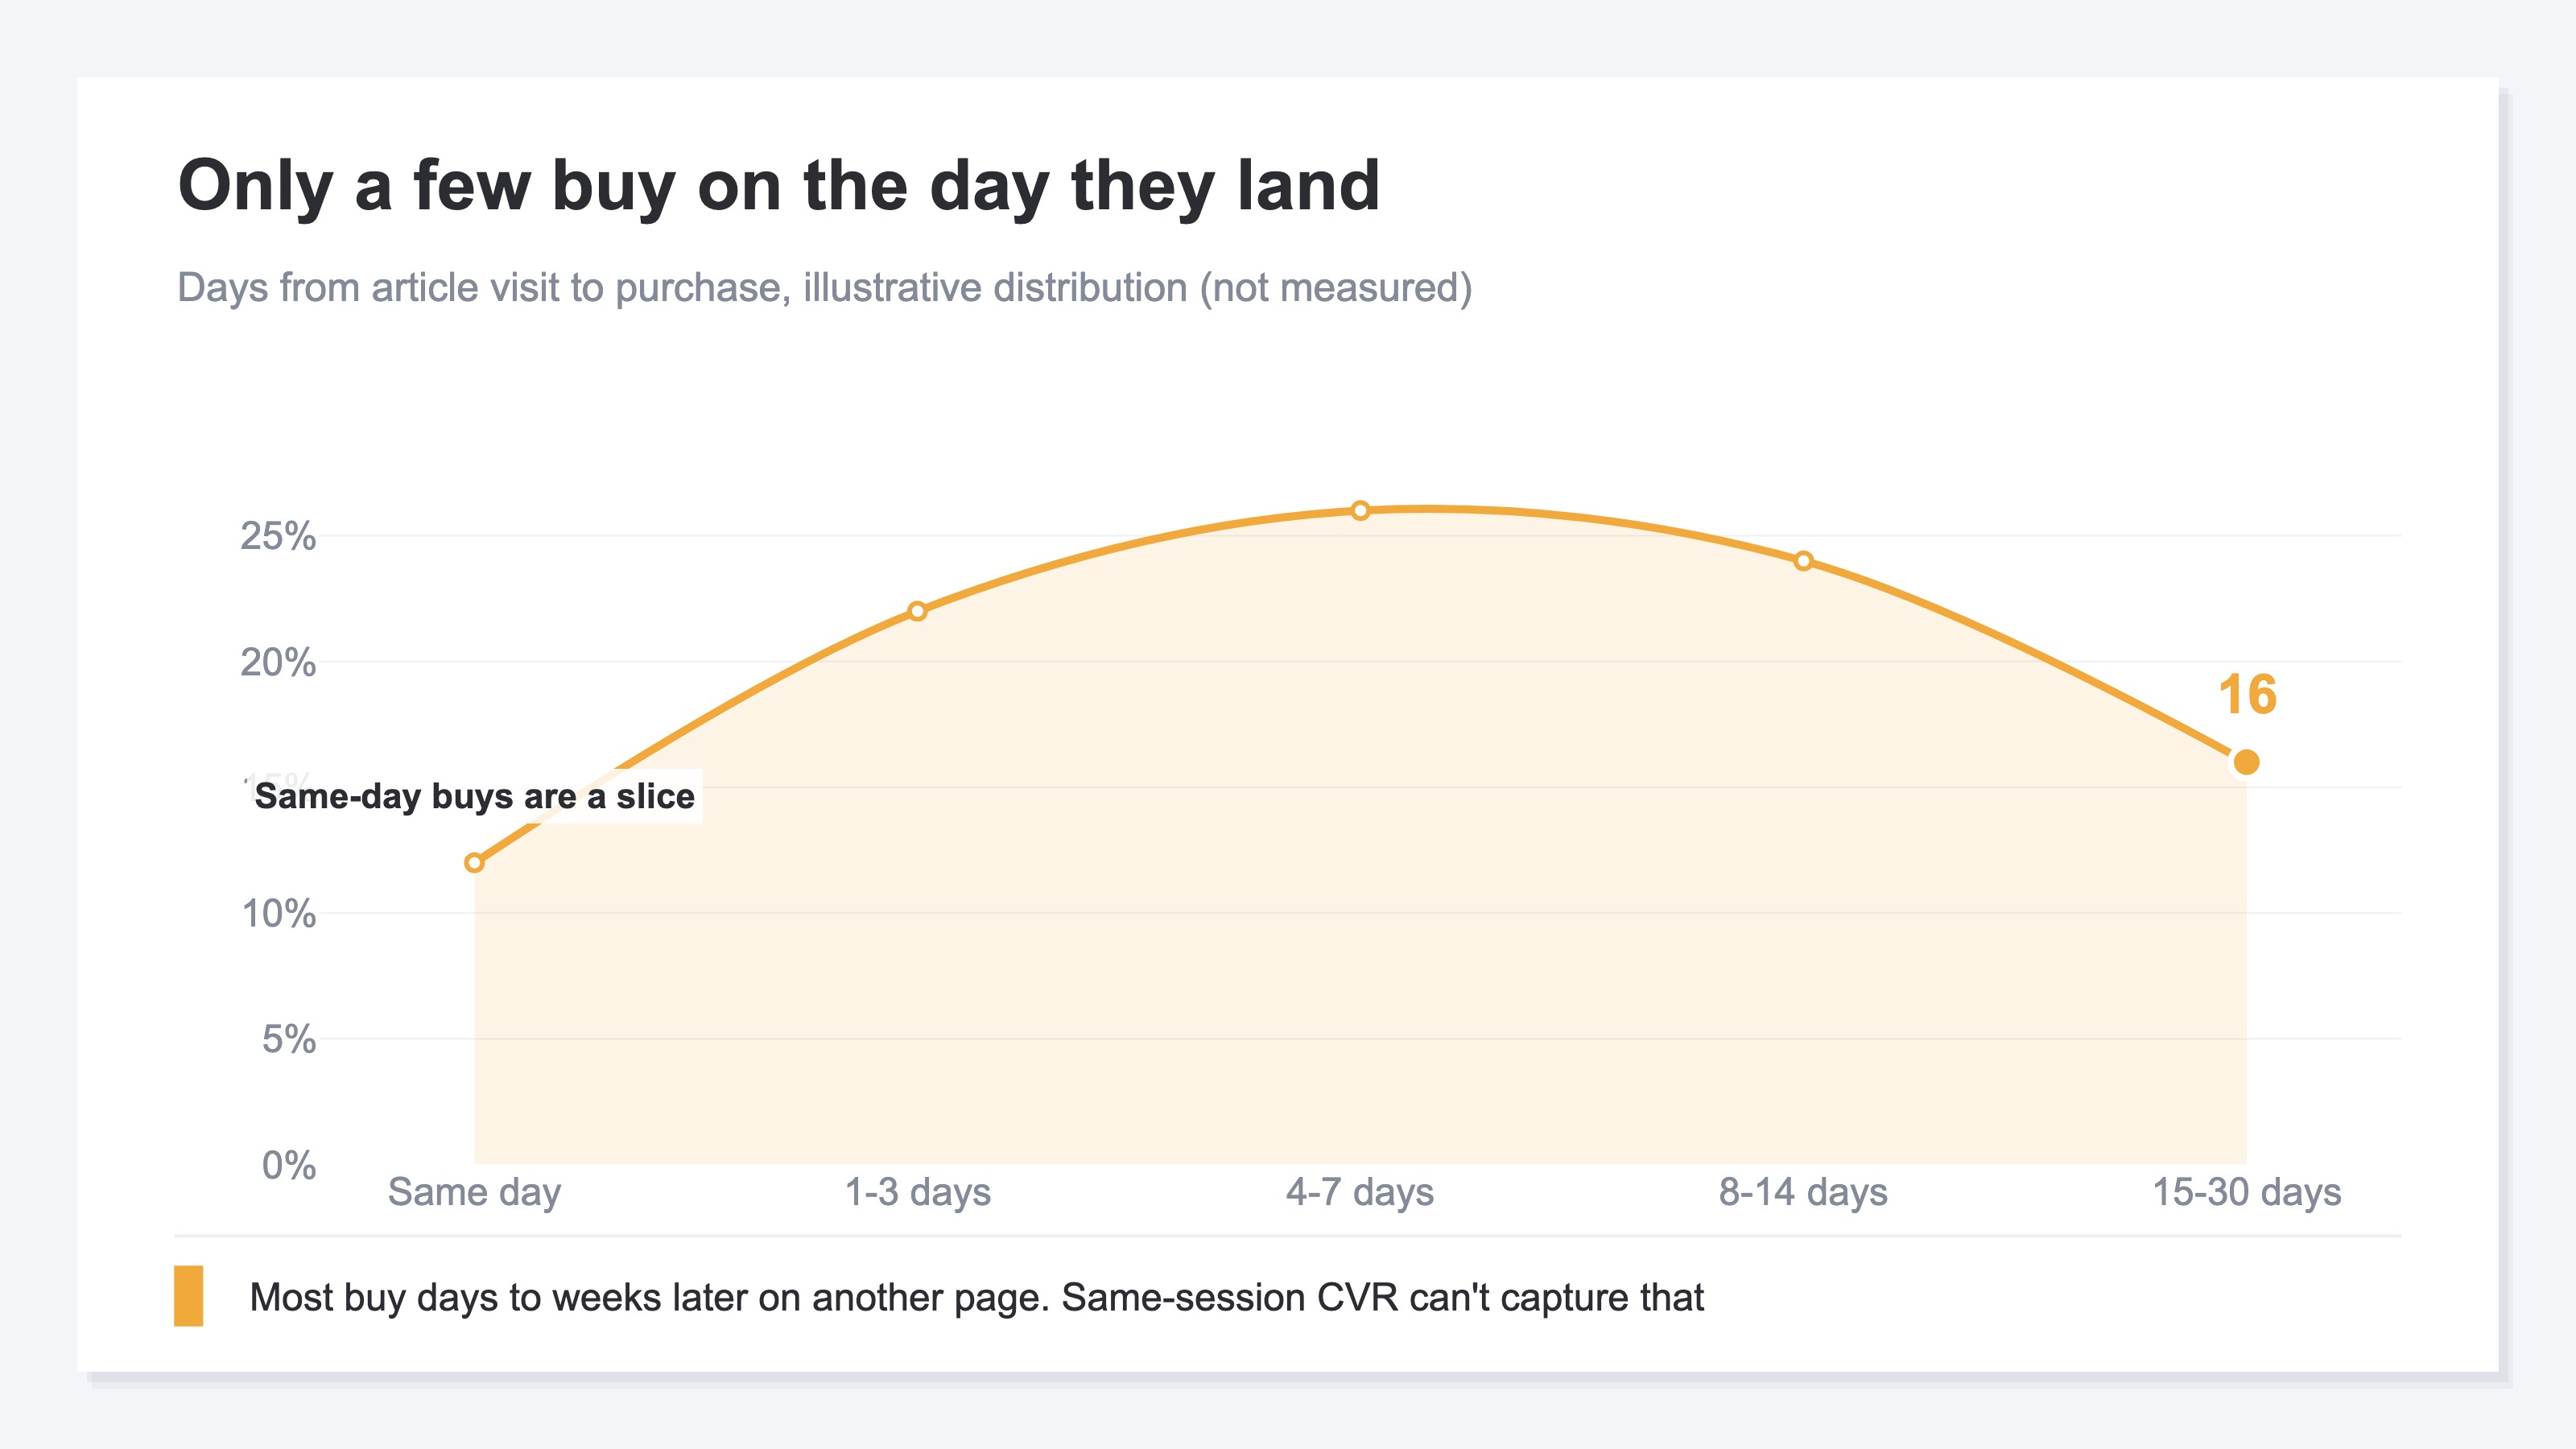
The figure above illustrates the path from landing on an article to buying. Only a few buy on the day they land; most come back across a span of days. As long as that lag exists, grading an article by "did they buy within the same visit" is measuring the wrong thing to begin with.
2. Judging by Article CVR Misreads Good Articles as Failures#
Bottom line: when article CVRs all bunch up low, every one of them looks like it "isn't working." Take that rate as your basis for judgment, and you misread a good article that's genuinely carrying revenue as a failure — and cut it first. This is the most dangerous misreading of article CVR.
List article CVRs and most cluster somewhere below 1 percent. Since nothing separates them, you're tempted to conclude "this article's results are thin." But that low CVR reflects not the article's quality but its nature — that the purchase moves to a later day. Judge "not working" on rate alone, and you file an article that creates the first touch and carries revenue through branded search and return visits into the same drawer as zero results.
The same is a known pitfall of rate as a metric in itself. Compare channels or ads by rate alone and you overvalue a low-traffic, high-rate touchpoint while cutting a low-rate one that carries revenue. That structure is laid out in how to read CVR versus revenue per session (RPS). For articles the gap between rate and real contribution grows wider still, because the purchase moves to a different visit.
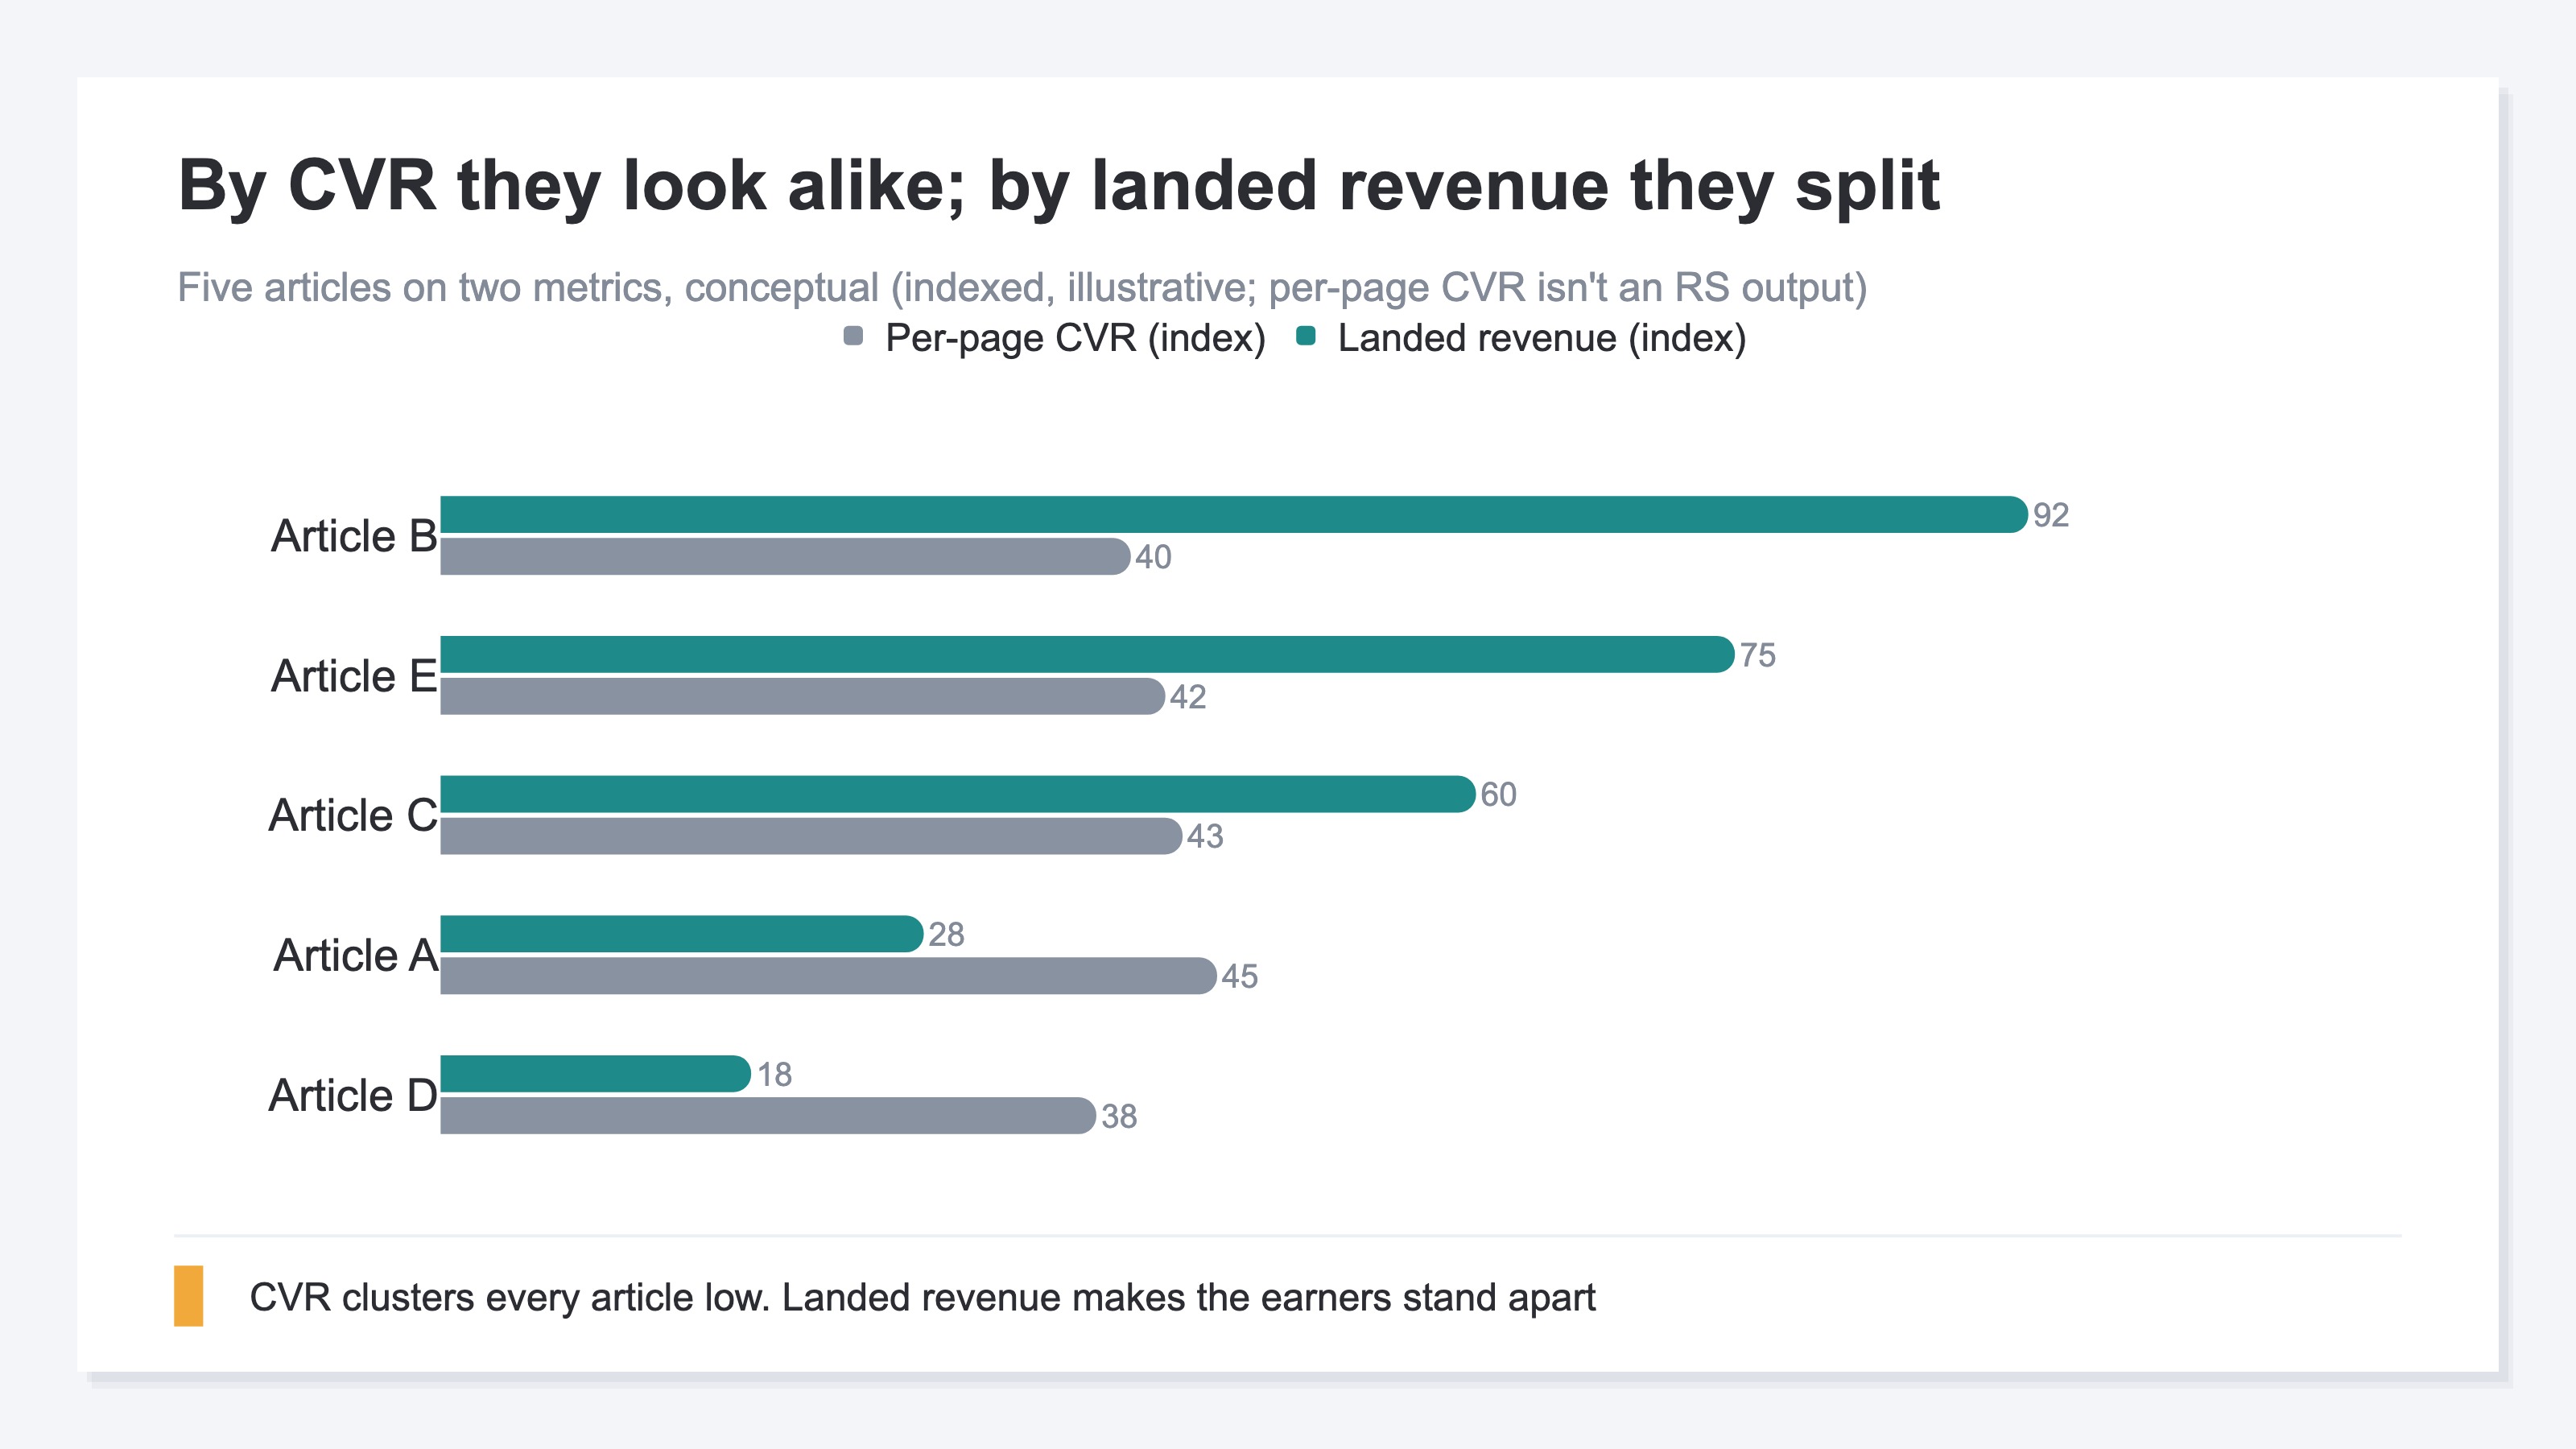
This figure shows the same set of articles through two metrics. On the left, per-page CVR, every article clusters low and no difference shows. On the right, landing revenue, the articles separate clearly. Same articles — change only the metric you look through, and the landscape changes. As long as you're looking through CVR, the articles carrying revenue stay sunk at the bottom. Note that the per-page CVR in this figure is purely an illustration, not measured values. The reason comes in the second half.
3. Read Articles by Landing Revenue#
Bottom line: read articles by "landing revenue" rather than rate, and their contribution surfaces correctly. Landing revenue is the revenue of sessions that entered through that article. Purchases made after browsing on to another page are counted back to the entry article, so the browse-on within the same visit — not just the later day — gets properly credited to the article.
Here's the idea of landing revenue. A visit lands on an article, browses on through the site, and finally sells some amount; that amount is tallied against the article that was the entry point. If someone who came in through Article A moves to a product page and buys, that revenue counts toward Article A. You credit the result not to the page where they bought but to the article that opened the conversation. Summed per article rather than per person, that's landing revenue.
Switch to this metric and articles that showed no difference under CVR take on a clear order. An article with large landing revenue is genuinely carrying revenue even if its rate is low. Conversely, if landing revenue is small, the pull on revenue is weak no matter how many visits it draws. Which article to touch to move revenue — this landing revenue becomes the axis when you set rewrite priority, too. How to set that priority is covered in detail in which articles to rewrite first.
Landing revenue credits revenue to the entry page (last-touch). When someone reads several articles before buying, the contribution of those in-between reads is tallied to the entry page as well. This way of counting comes far closer to the reality of revenue — later days and browse-on included — than grading an article by the "did they buy within the same visit" rate. To evaluate an article by revenue, read it by landing revenue, not rate. That's the re-choice of metric.
4. Not Showing Per-Page CVR Is a Deliberate Choice#
Bottom line: for acquisition pages like articles, we deliberately don't show per-page CVR. Measuring an article by rate is itself the seed of misreading. Whole-site CVR, and the CVR of pages built for purchase, are valid metrics. Changing the metric by target is the right way to engage.
Per-page CVR looks like handy data to have. But show it for articles and it actively feeds the misreading we've walked through: see a screen of rates lined up and people inevitably rank by high and low. Since an article's purchase moves to a later day, comparing by rate always clusters them low, pulling you toward cutting good articles. So for articles, we have you read by landing revenue, not rate. Not showing per-page CVR isn't a matter of aggregation convenience — it's a design stance meant to have articles evaluated correctly.
Of course, this doesn't reject CVR as a metric. Whole-site CVR is an important metric for seeing how the purchase rate moved before and after a measure; and the CVR of pages built to buy or sign up on the spot — product pages, checkout pages, application forms — is straightforwardly meaningful. How to raise CVR itself is collected in points to check for improving CVR. The point is that you change the metric by what role the target page plays. The table below organizes which metric suits which target.
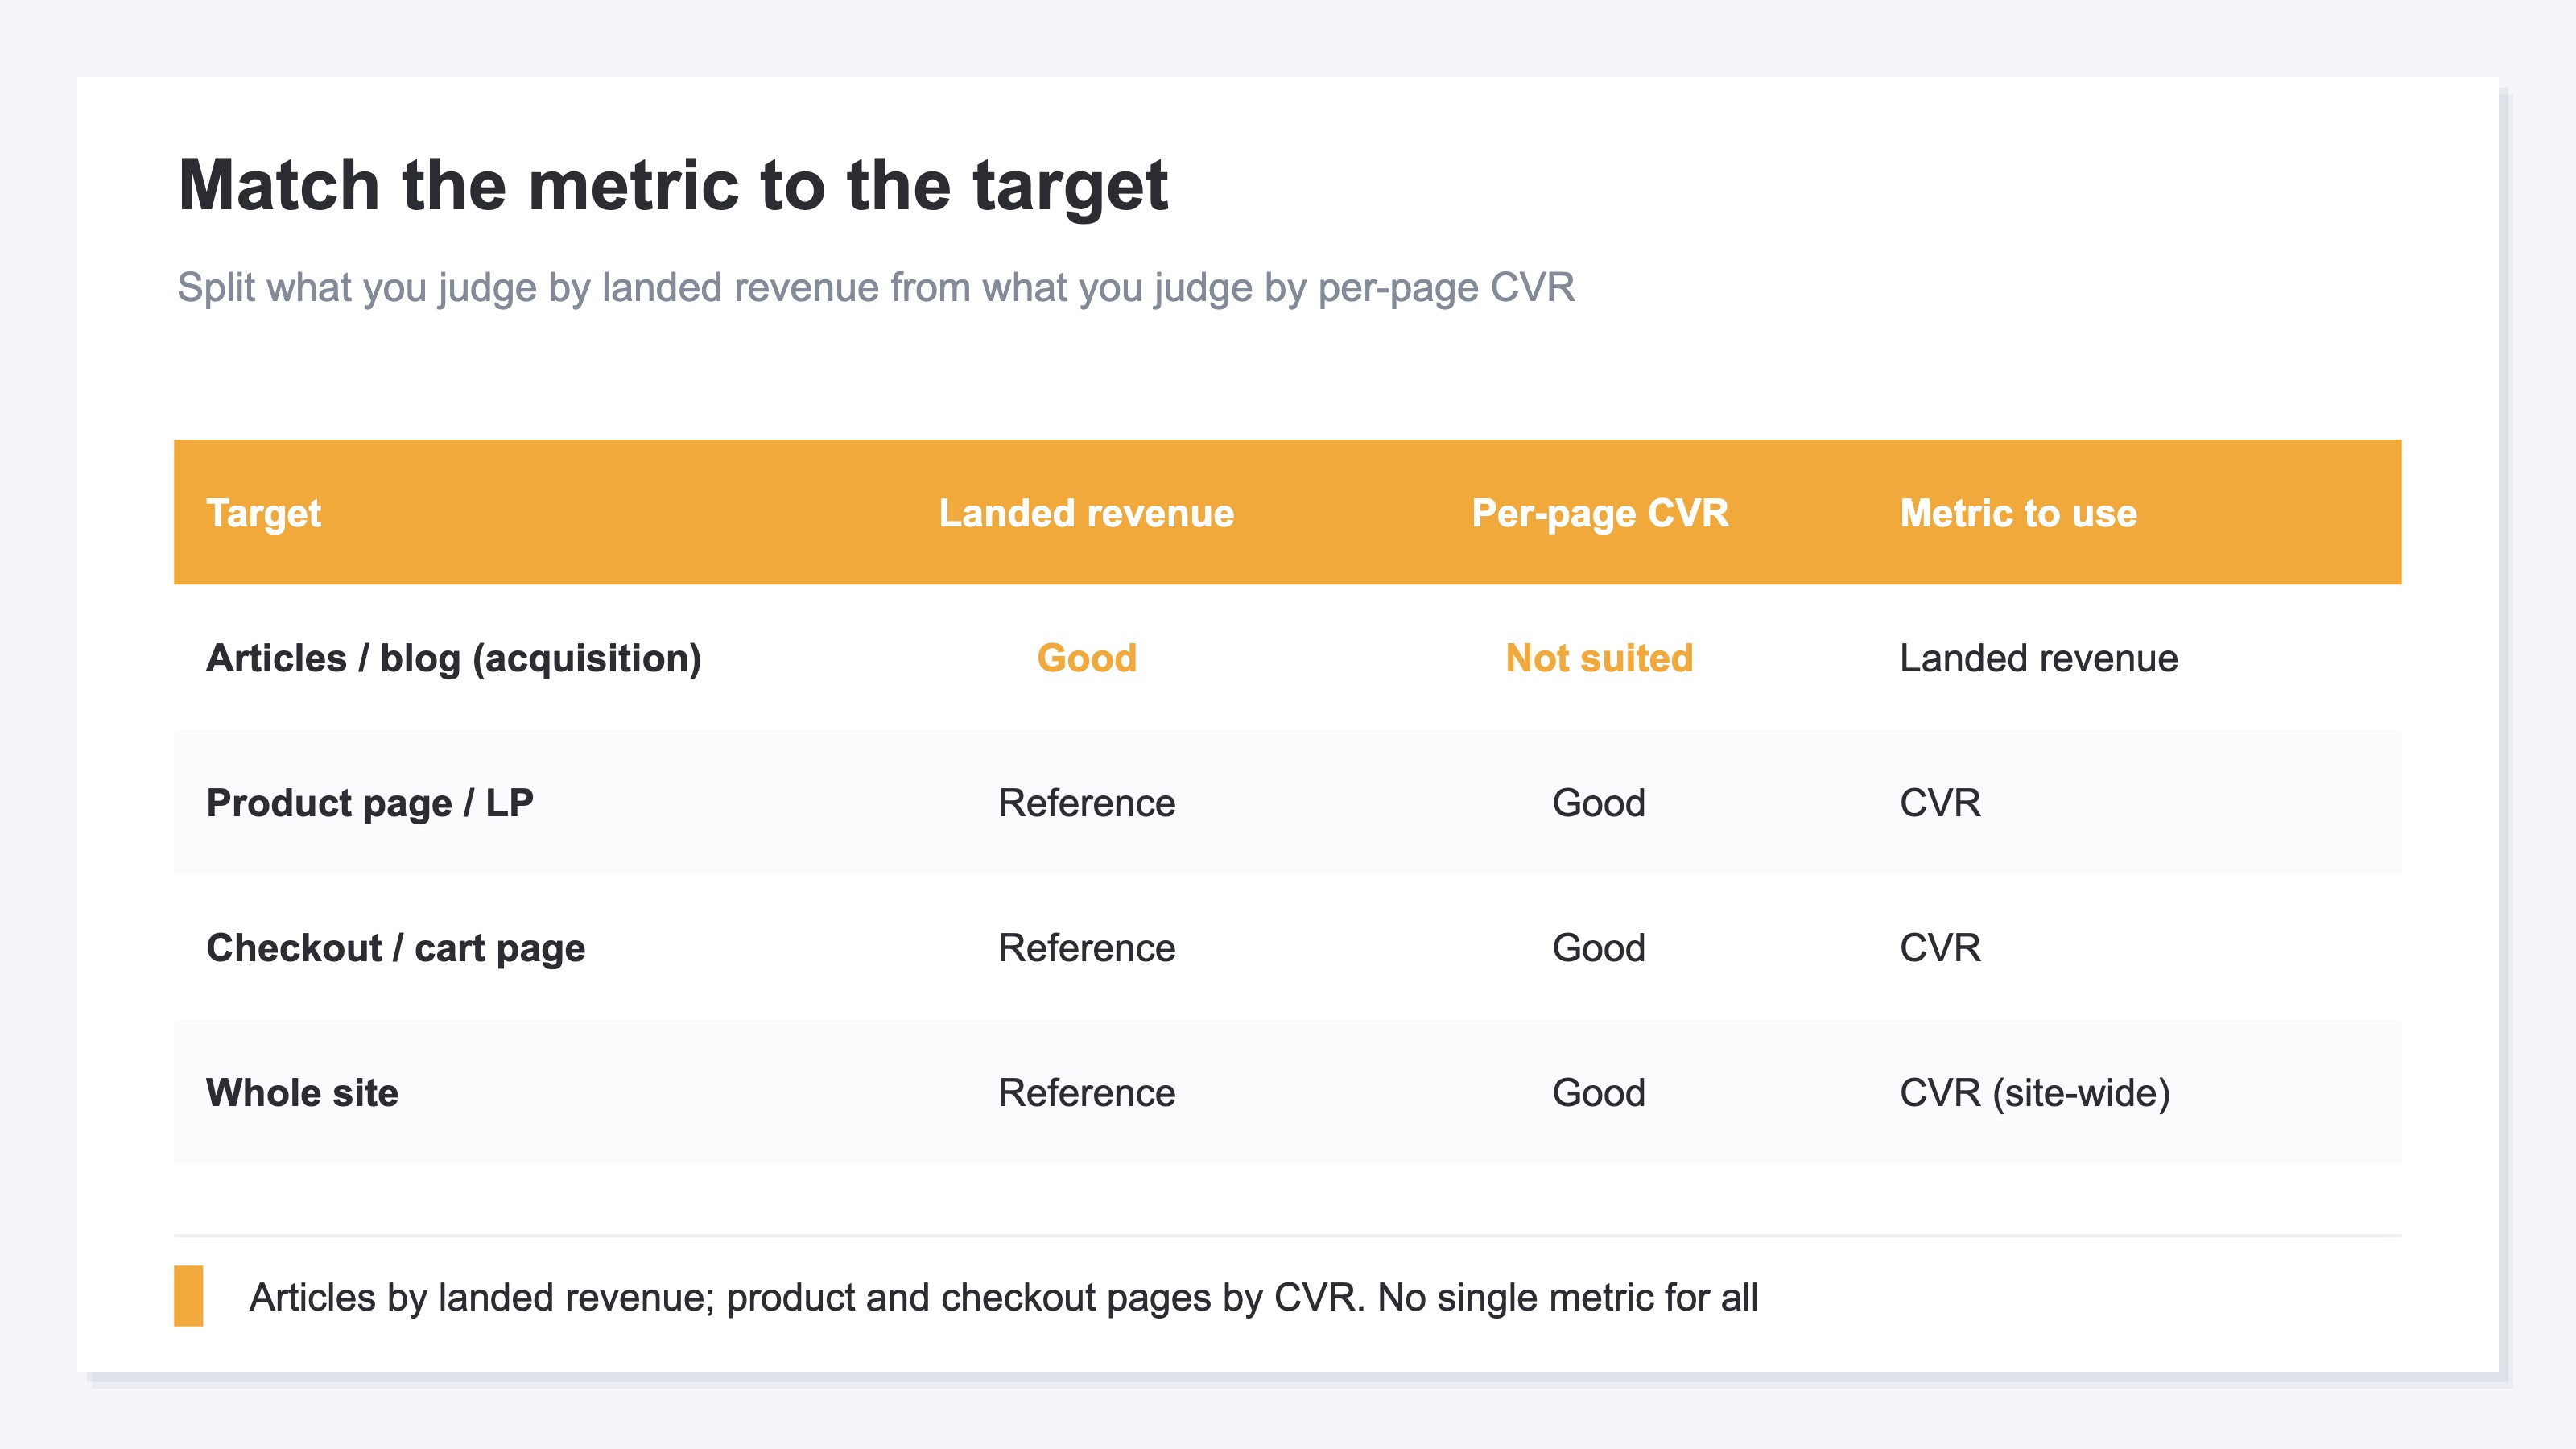
As the table shows, read articles whose role is acquisition by landing revenue, pages whose role is purchase by CVR, and the whole site by whole-site CVR. The same word "CVR" leads you astray if you aim it at the wrong target. Don't grade an article on the same basis as whole-site CVR or a product page. That's the line that keeps rate and landing revenue from being confused.
RevenueScope helps
Bottom line: RevenueScope sorts content pages, articles included, into five states versus the prior period, layers measured landing revenue and AI-referred traffic over them, and prioritizes which page to fix first. Lining up each article's landing revenue on a single screen is heavy in GA4, and standing in for that is its job. Per-page CVR, true to the stance above, it does not show.
In GA4, too, you can reach numbers close to landing revenue by lining up landing-page revenue in an exploration report. But repeating every month the work of switching each article between the prior and current period, splitting states, and matching AI-referred traffic gets heavier as articles pile up. RevenueScope stands in for that heavy repetition on a single screen.
Specifically, it splits the site's content pages by their prior- and current-period movement into five states: Declining, Growth candidates, Rising, Low-click (pages earning revenue despite few clicks), and Stable. On top of that it layers, for each, measured landing revenue (revenue of sessions that entered through the article, all channels, bots excluded) and whether there's AI-referred traffic, and outputs a fixed recommended action per state. For Growth candidate pages, it even shows the "one-step-away search keywords" — those ranking 4th–20th with a target set at 3rd.
Let me show the actual view with sample-store data.
Sample EC store content pages (30 days, 12 pages total)
| State | Pages | Landing revenue (JPY) | Clicks |
|---|---|---|---|
| Stable | 4 | 125,264 | 839 |
| Low-click | 2 | 101,460 | 0 |
| Growth candidates | 3 | 74,479 | 96 |
| Declining | 1 | 34,965 | 482 |
| Rising | 2 | 34,927 | 174 |
Figures from a fictional store with sample data (RevenueScope demo). Landing revenue is last-touch (revenue of sessions that entered through the article; purchases made after browsing on are credited to the entry page). Per-page CVR is not shown.
What to read in this table is how far click order and landing-revenue order diverge. "Low-click" (zero clicks), the first to be cut when you sort by clicks, sits at 101,460 yen in landing revenue — second overall, behind only Stable. Conversely, "Declining" (482 clicks), the most-clicked among the pages you'd want to fix, tops out at just 34,965 yen. Had you ranked by CVR or clicks, this reversal would stay invisible forever. So articles need to be re-examined by landing revenue, not by rate or clicks.
What RevenueScope produces is the priority for fixing. It adds a fixed recommended action per state, reads landing revenue as last-touch (credited to the entry page), and does not show per-page CVR. Its job is to make telling articles apart — not misread by rate, but sorted closest to revenue — as light as possible. Note that this classification matches in figures between the dashboard and MCP (the way you let AI read your numbers).
FAQ#
Q. Is an article's low CVR because the content is poor?
A. The quality of the content and the lowness of article CVR aren't directly linked. The biggest reason article CVR is low is that readers don't buy on the spot — the purchase happens days later, on a different page. Even an excellent article isn't bought within the same visit, so CVRs come out uniformly low. If you want to check the content, reading by landing revenue, or by whether it's being read, comes closer to reality than rate.
Q. What's the difference between landing revenue and CVR?
A. CVR is a rate — "what percent of visits bought" — while landing revenue is an amount — "how much the sessions that entered through that article sold." A high rate still means small revenue if the traffic is small; a low rate can still mean large revenue depending on traffic and unit price. To evaluate a page whose purchase moves to a later day, like an article, reading by amount (landing revenue) rather than rate alone keeps you from misjudging the priority. RevenueScope doesn't show per-page CVR for articles; it tells them apart on landing revenue.
Q. So should I stop looking at CVR altogether?
A. No — pick the right target and CVR is valid. Whole-site CVR helps you see how the purchase rate moved before and after a measure, and the CVR of pages built to buy or sign up on the spot — product pages, checkout pages, application forms — is straightforwardly meaningful. The principle for using them apart: read articles, whose role is acquisition, by landing revenue, and pages whose role is purchase by CVR.
Summary#
Article CVR is a metric that comes out lower the better the article is. Readers don't buy on the spot; the purchase happens later, on a different page. Take that rate as your basis for judgment and you misread a good article that's genuinely carrying revenue as a failure, cutting it first. Read articles not by rate but by the landing revenue of sessions that entered through them. Change only the metric you look through, and in the sample store a zero-click article surfaced second overall by revenue. Not showing per-page CVR is a design stance meant to have articles evaluated correctly. Whole-site CVR and the CVR of purchase-purpose pages are valid, though — changing the metric by target is the right way to engage. Once you've re-examined articles by landing revenue, the next question is which to fix first. How to set that priority is collected in which articles to rewrite first.
See which ads actually drive revenue, at a glance
Free up to 5,000 sessions/month, AI connection included. No credit card required. Up and running in 5 minutes.