Once an ecommerce site is back online, one question remains: how much revenue fell during the incident? Answering it requires two different sources. Logs establish when customers were affected. Revenue results show the difference against the same weekday and time block.
Contents
TL;DR#
- A 403 means a request was refused. A 502 means a gateway or proxy received an invalid response from an upstream server. Neither code identifies the full extent of the purchase disruption
- Use CDN/WAF, origin, application, and payment logs to establish when customers could not use the purchase path
- Compare revenue during the incident with the same weekday and time block, not with the previous day or an all-day average
- The difference between baseline revenue and incident-day revenue is an estimated revenue shortfall, not a confirmed loss
- If revenue rises above its baseline after recovery, examine it separately as a possible shift in purchase timing
1. An Error Code Does Not Determine the Revenue Shortfall#
A 403 and a 502 can both appear to a shopper as a page that will not open, but the responses mean different things.
RFC 9110 defines a 403 as a server understanding the request but refusing to fulfill it[1]. Cloudflare lists origin permission settings, WAF rules, and IP denial among the possible paths to a 403[2]. A deliberate bot block and a configuration mistake that catches shoppers can therefore produce the same response in a browser.
A 502 means that a server acting as a gateway or proxy received an invalid response from an upstream server[1]. The investigation also differs depending on whether the response originated at Cloudflare or at the origin server[3].
The code identifies a type of response. It does not say whether only a product page failed or whether the cart and checkout were unusable. The error may have affected only a country, device, or IP range. The start time, end time, and number of shoppers who were unable to buy are not contained in the code either.
Establish three facts first:
- Where the error appeared across the customer-facing product, cart, and checkout path
- When the first failed response occurred and when normal responses returned
- Whether the error affected all requests or only a region, device, or route
If the site uses Cloudflare, compare Edge Status Code with Origin Status Code. Cloudflare documents this comparison as a way to determine whether an error occurred at the edge or the origin[4]. Match the application and payment logs to the same timestamps.
If those records show no customer impact, do not convert the number of 403 or 502 responses into a revenue shortfall. A response returned only to requests from an admin interface or a bot may have had no effect on shoppers.
Suppose instead that the logs show the cart-to-checkout path was unavailable from 1:05 p.m. to 2:20 p.m. That evidence sets the time to investigate on the revenue side. The investigation starts by keeping root-cause analysis and the monetary estimate in separate datasets.
2. Estimate the Shortfall From the Same Weekday and Time Block#
The comparison is not the day before the incident or the all-day average for the last 30 days. It is revenue for the same weekday and time block. A Sunday afternoon and a weekday morning have different normal levels before any incident occurs.
Consider fictional Store P, whose purchase path was unavailable on a Sunday from 1:05 p.m. to 2:20 p.m. RevenueScope divides the day into four-hour blocks in Japan Standard Time. For the noon-to-4 p.m. block that contains the incident, select each of the previous four Sundays in turn and record revenue, sessions, and RPS.
One illustrative comparison of Store P's noon-to-4 p.m. block across Sundays
| Date | Revenue | Sessions | RPS |
|---|---|---|---|
| Sunday four weeks earlier | ¥218,000 | 800 | ¥273 |
| Sunday three weeks earlier | ¥231,000 | 840 | ¥275 |
| Sunday two weeks earlier | ¥209,000 | 770 | ¥271 |
| Previous Sunday | ¥242,000 | 860 | ¥281 |
| Baseline, median of four days | ¥224,500 | 820 | ¥274 |
| Incident day | ¥84,000 | 520 | ¥162 |
Note: this table uses fictional data constructed for the explanation. It does not match the sample data shown in the RevenueScope demo, which changes daily.
The median prevents a sale or one unusually large order from pulling the baseline upward. If you add more comparison dates, keep the weekday, time block, and presence or absence of promotions aligned.
The estimated revenue shortfall in this example is:
¥224,500 baseline revenue − ¥84,000 incident-day revenue = ¥140,500
The ¥140,500 is not a confirmed amount of lost orders. The incident lasted 75 minutes within the noon-to-4 p.m. block. Demand changes, advertising, weather, and inventory during the rest of the block also contribute to the difference.
Sessions and RPS explain why revenue alone is insufficient. Sessions fell from 820 to 520, while RPS fell from ¥274 to ¥162. Fewer sessions were recorded, and the revenue produced per recorded session also declined.
If sessions fall while RPS stays near the baseline, investigate the traffic side first. If sessions stay near the baseline while only RPS falls, prioritize the cart and checkout path. If both fall, return to the logs and check whether the incident affected both arrival at the site and the purchase path.
How to diagnose a revenue drop in KPI order covers a decline whose cause is still unknown. This article begins only after the customer-impact period has been established from logs.
3. Examine the Post-Recovery Increase Separately#
Not every shopper who was unable to buy during an incident leaves permanently. A shopper may return after recovery, moving the revenue into a later time block rather than eliminating it.
That is why the calculation should not stop at the noon-to-4 p.m. block. Compare the blocks before and after it with their baselines for the same weekday.
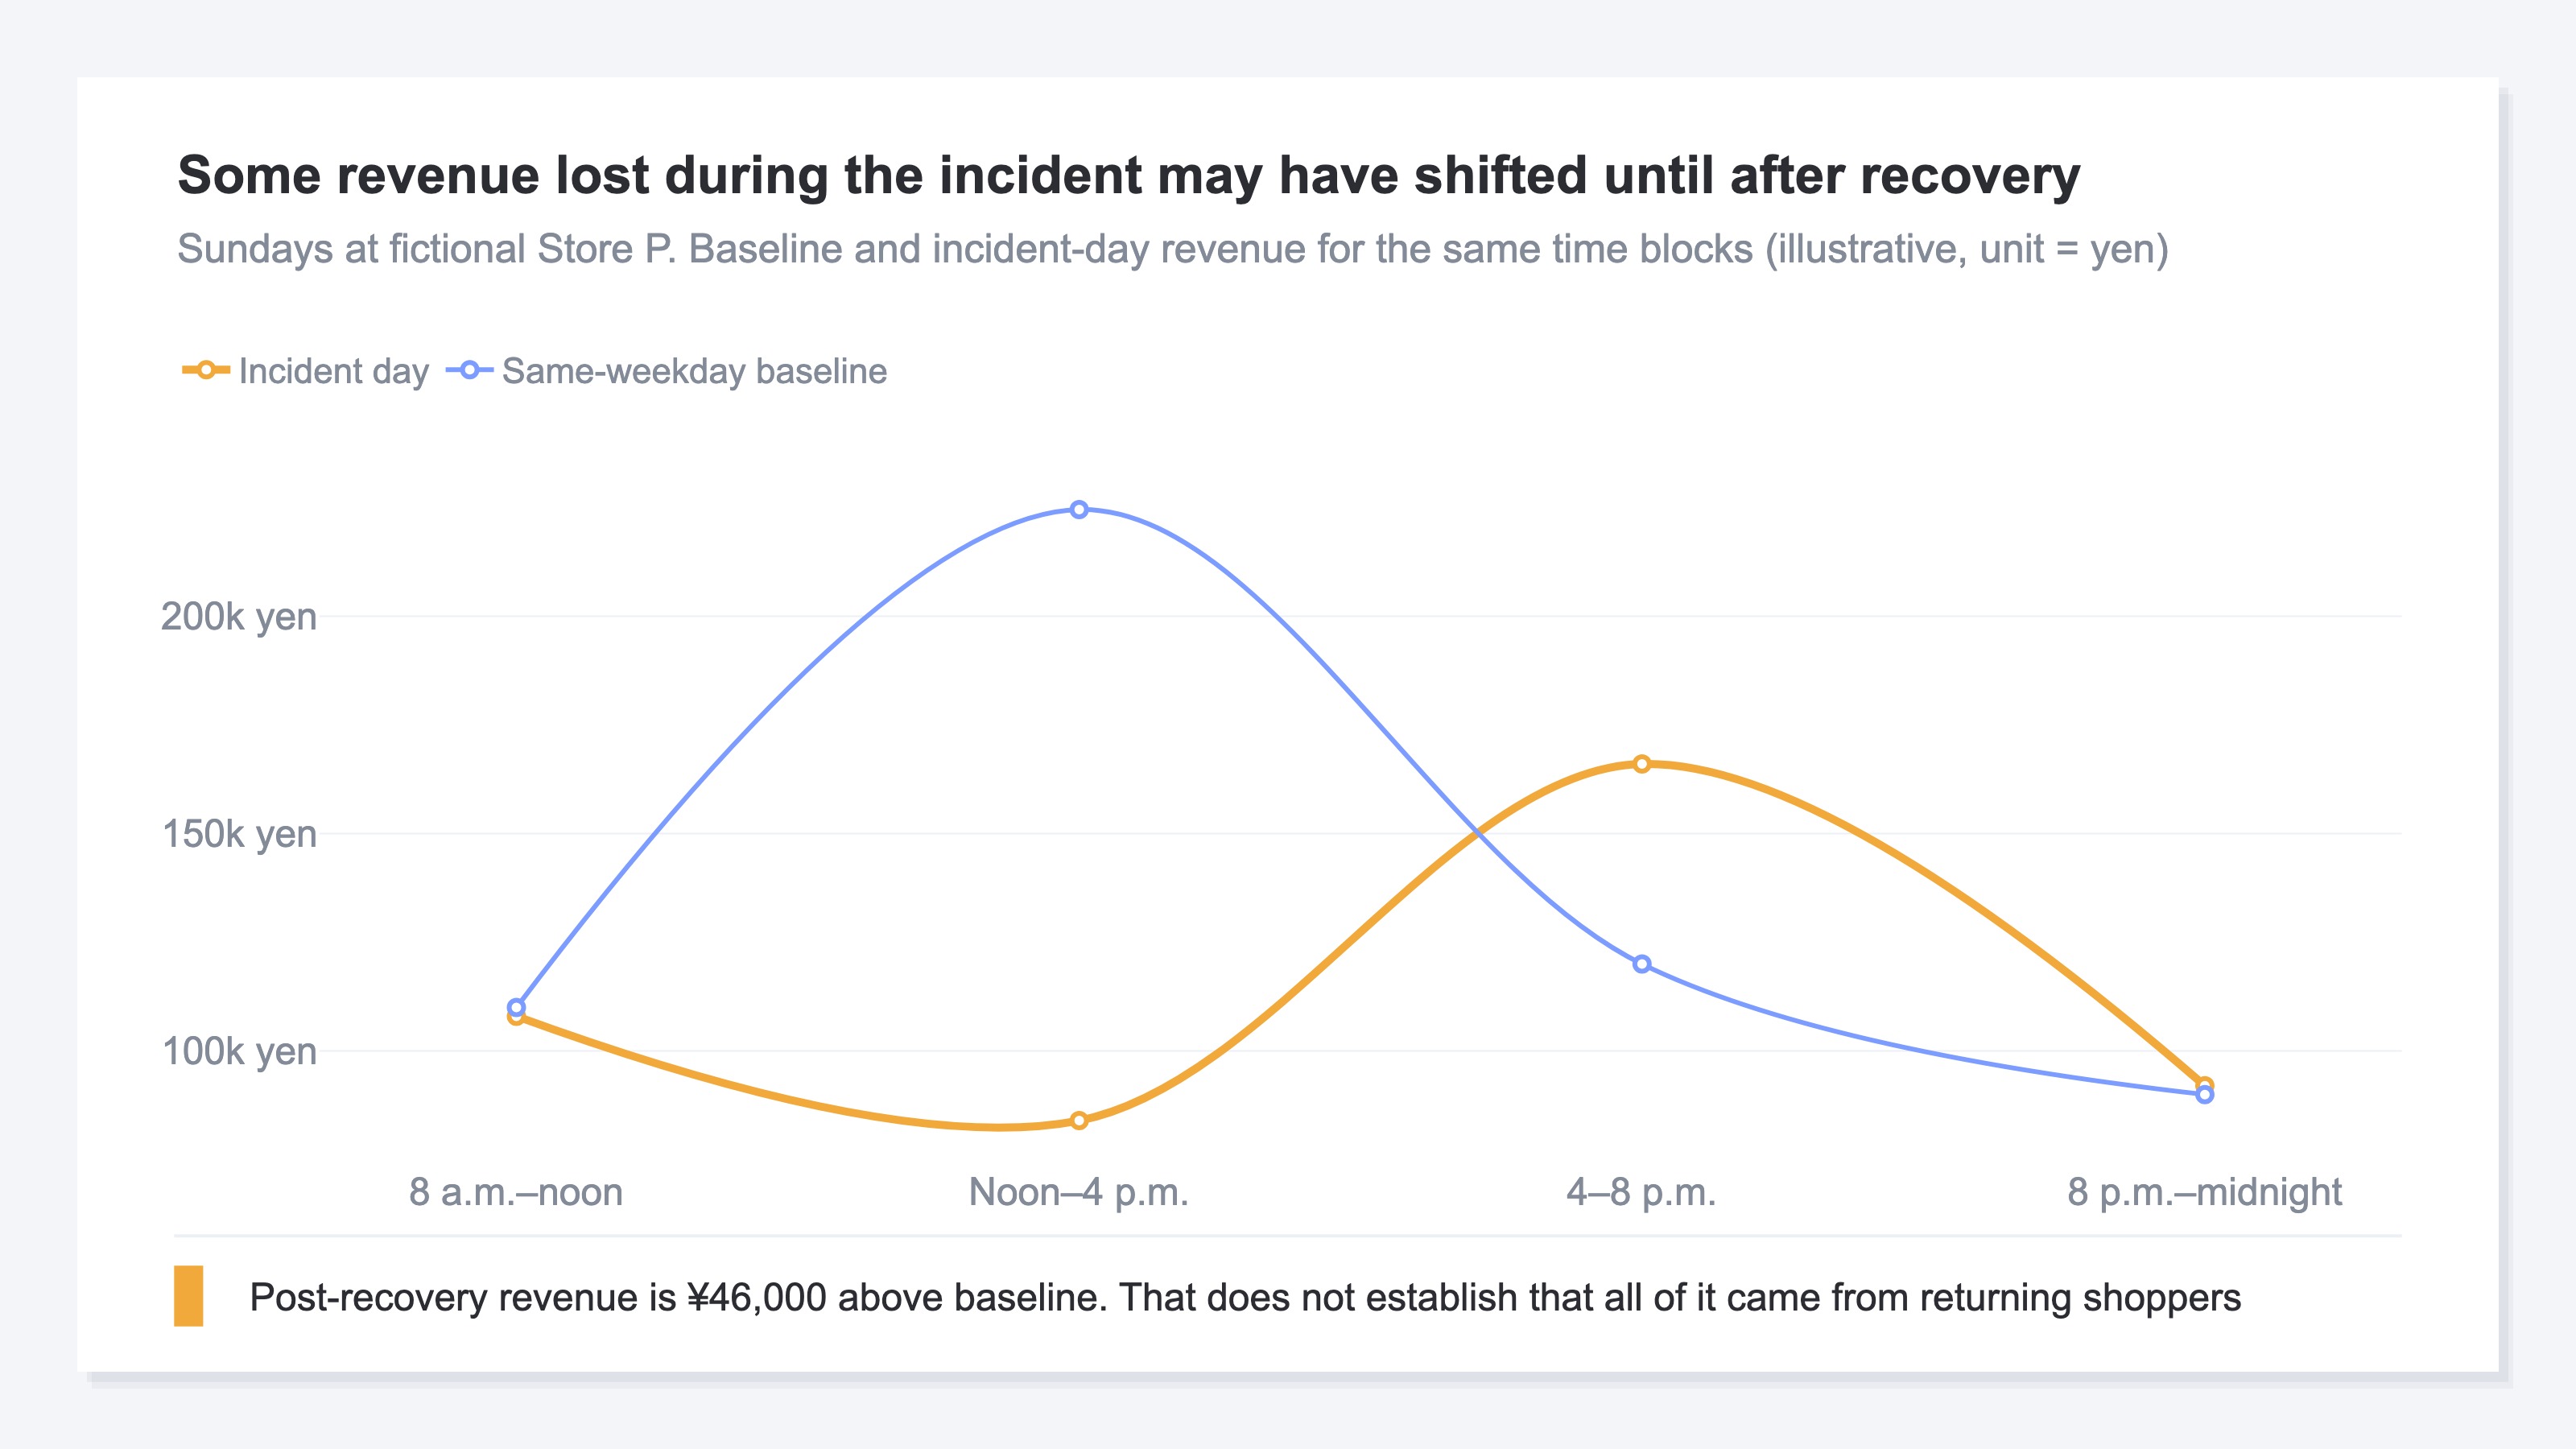
For Store P, revenue from 4 p.m. to 8 p.m. after recovery was ¥166,000 against a baseline of ¥120,000, an increase of ¥46,000. That does not establish that the entire ¥46,000 came from returning shoppers. Advertising that began after recovery or an ordinary rise in orders may also be present.
Calculate two scenarios instead:
- Without subtracting the post-recovery increase: ¥140,500
- Treating all ¥46,000 as purchases shifted until after recovery: ¥94,500
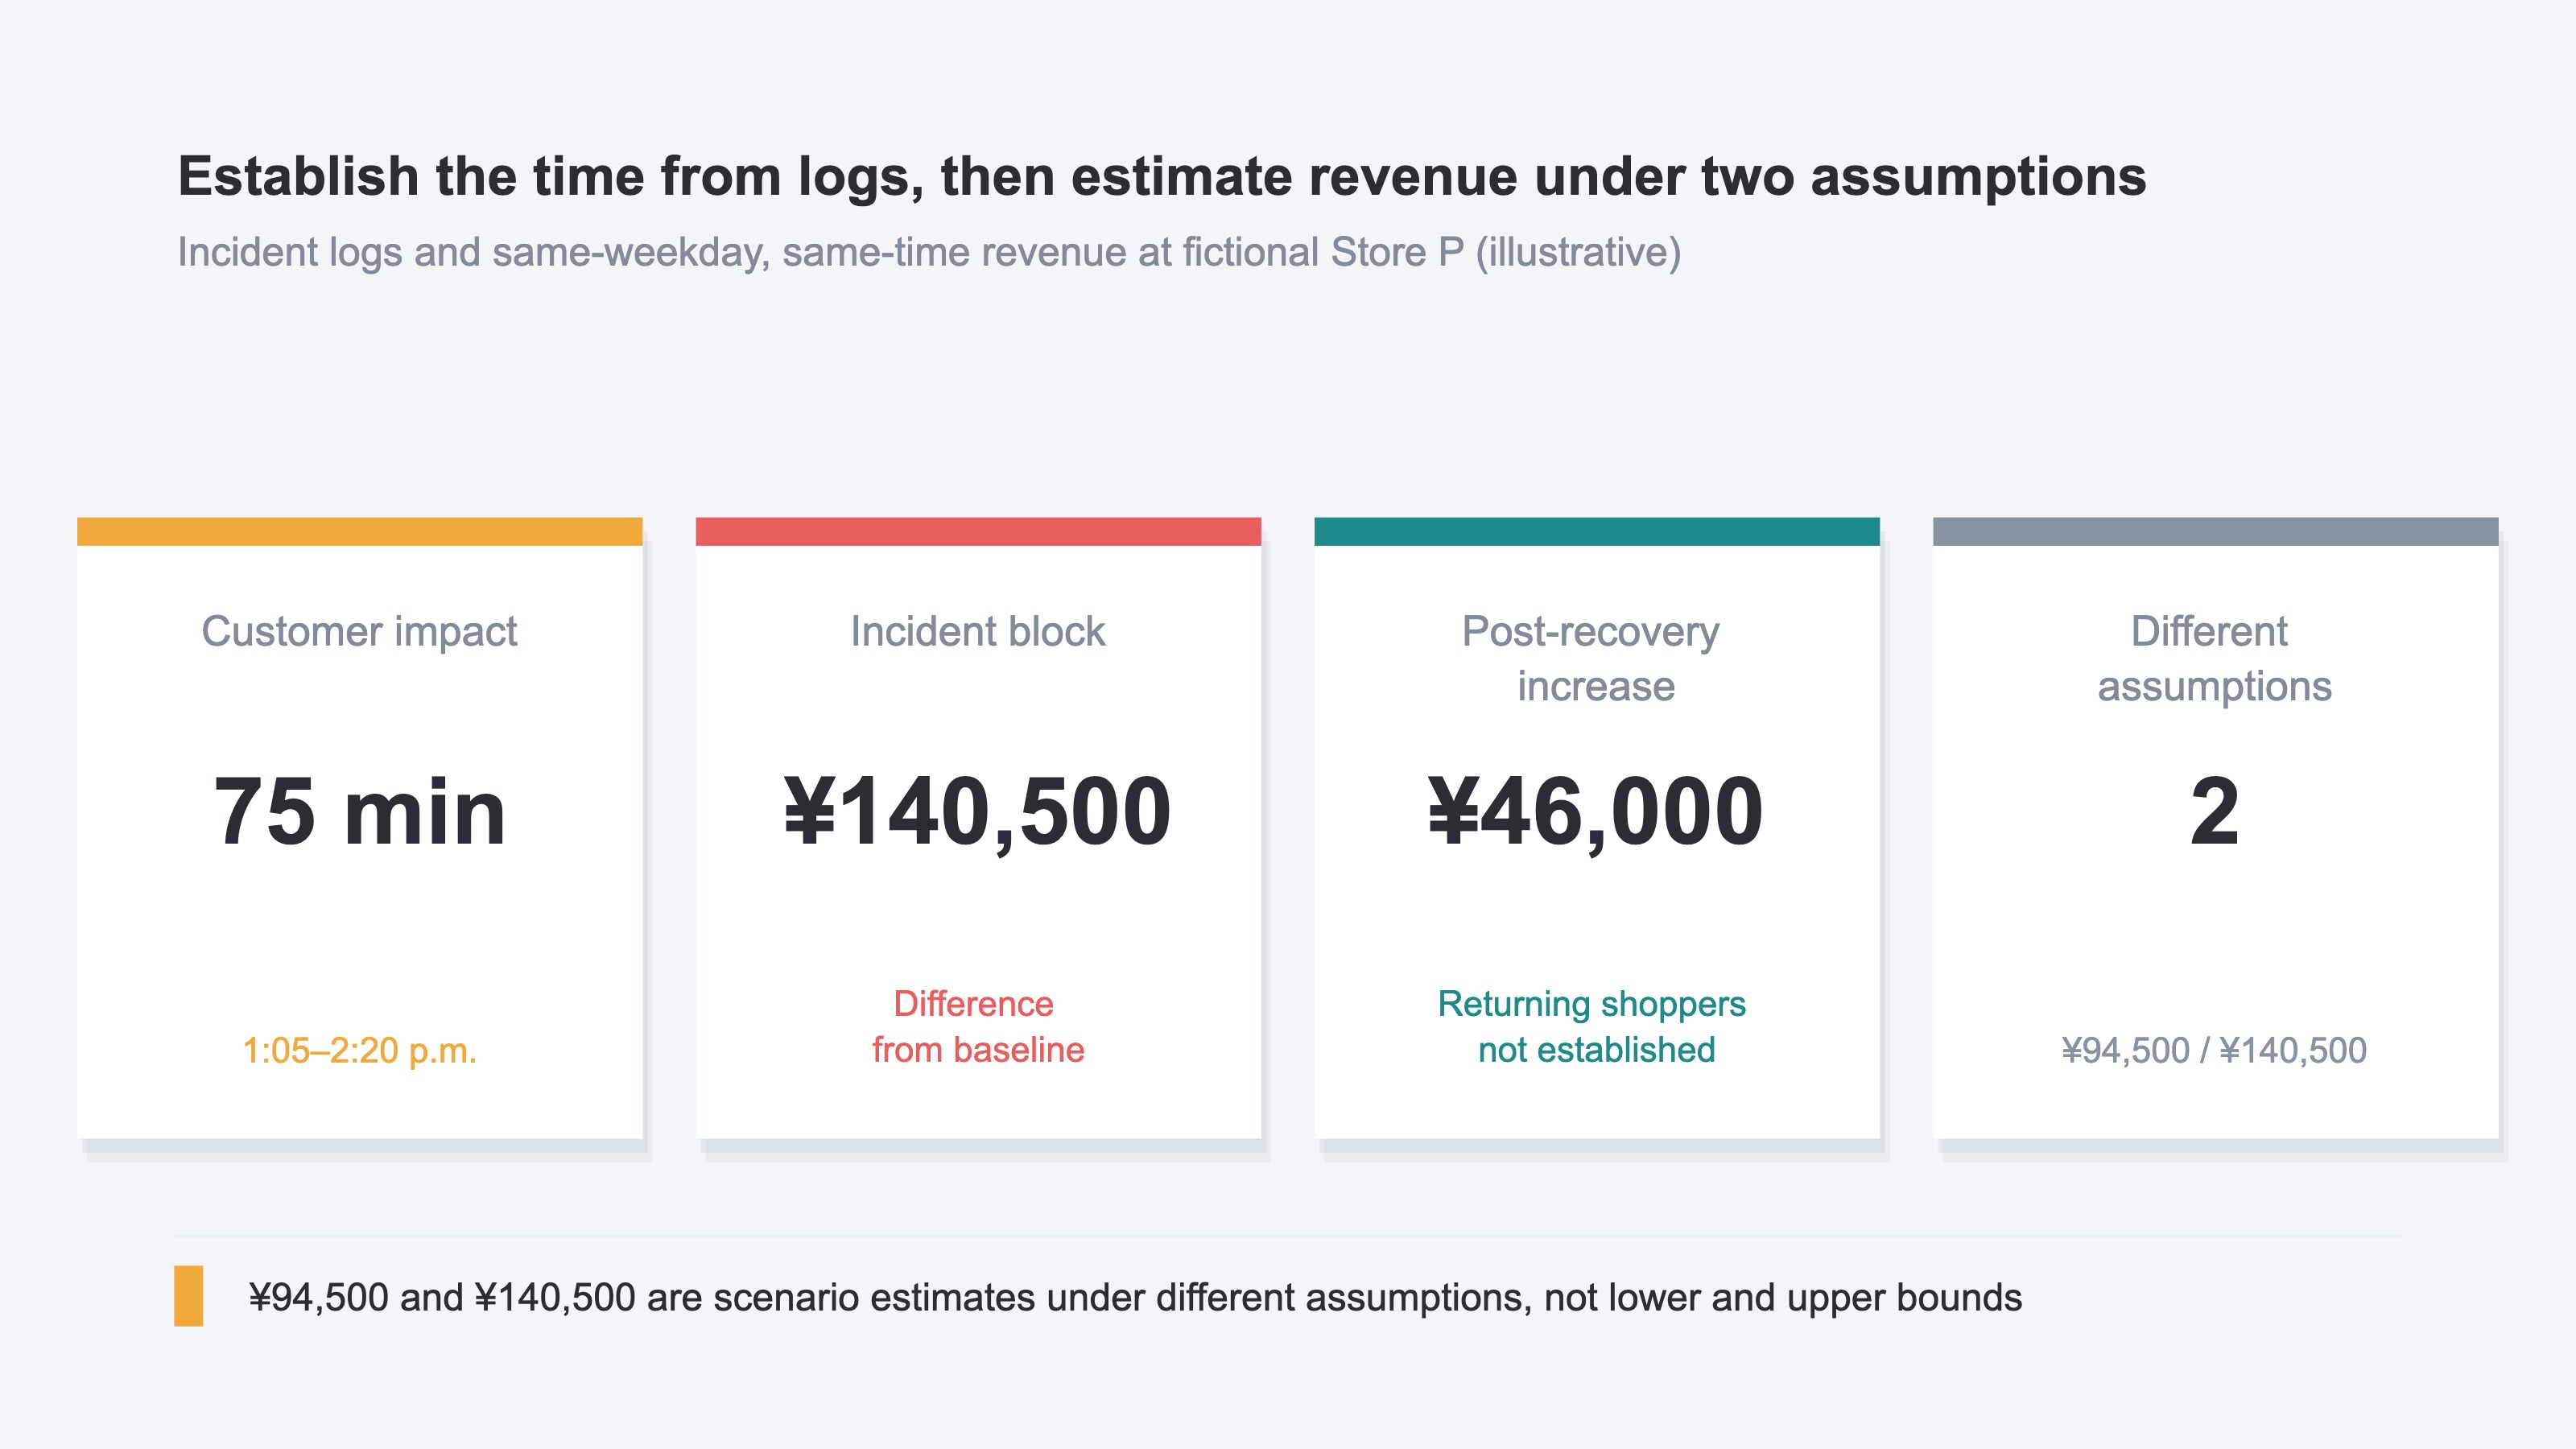
The two figures, ¥94,500 and ¥140,500, are not a lower and upper bound on the loss. If advertising, inventory, or pricing changed after recovery, the actual revenue impact may be smaller than both figures or larger than both. Compare the scenarios with the cost of monitoring, redundancy, and remediation when considering the scope of the response.
Finding revenue peaks by time block identifies the normal peaks. During an incident, those normal peaks become the fixed baseline. Unlike a recent-days revenue decline, the issue here is not delayed aggregation. It is the relationship between a customer-impact period established from logs and revenue in the corresponding time block.
Keep wasted advertising spend separate from the revenue shortfall. RevenueScope does not return advertising spend by time block. Whether to pause advertising during the incident is an operational decision, and the media platform's delivery history must be checked against the same timestamps.
RevenueScope solution
RevenueScope displays sessions, revenue, and RPS for each four-hour block in Japan Standard Time. Once the logs narrow the incident time, compare the block containing that time with the same block on prior occurrences of the same weekday.
RPS is the revenue produced per session. Select comparison dates one by one to assemble the baseline. Error detection and root-cause analysis remain in the CDN/WAF, origin, and application logs. RevenueScope does not detect 403 or 502 responses or determine the incident's exact start time.
The same on-screen revenue of zero can also occur when purchases happened but their measurement events did not arrive. GA4 revenue suddenly zero covers that separation. A sudden rise in cart abandonment covers payment failures and bot activity. The procedure here applies only when external logs establish that customers could not use the purchase path.
After the logs establish the 1:05 p.m. to 2:20 p.m. impact, use RevenueScope to inspect revenue, sessions, and RPS for noon to 4 p.m. Do not convert an error count into revenue. Fix the corresponding time block as the comparison unit.
For Store P, revenue in the affected block was about 63% below the baseline. The scenario that treats the entire post-recovery increase as shifted purchases produces an estimate of ¥94,500. The next decision is how much to spend to prevent the same incident. Multiply the two scenarios by the expected frequency and compare the result with the cost of monitoring, redundancy, or remediation.
FAQ#
Frequently Asked Questions#
Q. Can I multiply average hourly revenue by the incident duration?
A. It can provide a first approximation, but not a confirmed loss. Ecommerce revenue varies by weekday and time. Start with the same weekday and time block, then use finer-grained logs or order records to supplement a 75-minute incident.
Q. Does a 403 mean every shopper was unable to access the site?
A. No. A 403 shows that a request was refused, but the affected group may not include every user. Use logs to determine whether the response came from a WAF rule, IP denial, origin permission setting, or another route, and which customers it affected[1][2].
Q. Is all post-recovery revenue above the baseline from returning shoppers?
A. That cannot be established from the time-block aggregation. Advertising, inventory, and ordinary demand changes may be present. Calculate one scenario that subtracts the entire increase and another that does not subtract it.
Q. Which logs establish the incident period?
A. Find the first failed response and normal recovery in the CDN/WAF logs, then match the origin, application, and payment logs to the same timestamps. Record whether the response affected only a region, device, or other route.
Summary#
After 403 or 502 responses appear, do not begin by opening a revenue report. First use external logs to establish when customers could not use the product, cart, or checkout path.
Once the period is known, inspect revenue, sessions, and RPS for the same weekday and time block. The difference between baseline revenue and incident-day revenue is an estimated revenue shortfall, not a confirmed loss.
Finally, inspect the period after recovery. Separate a scenario that subtracts the revenue increase from one that does not. Use the two estimates and the incident frequency as one input when considering what to spend on prevention.
See which ads actually drive revenue, at a glance
Free up to 5,000 sessions/month, AI analyst included. No credit card required. Up and running in 5 minutes.