
You build the weekly report on Monday morning and only the most recent days are caved in. That dip isn't a decline — it's a stretch that hasn't finished being aggregated. How long it takes to settle differs by data source, so unless you decide in advance where to cut, the verdict flips from week to week.
Contents
TL;DR#
-
The dip at the right edge isn't a decline — it's a stretch that hasn't finished being aggregated
Collected Google Search Console data is normally available in 2-3 days
-
"Drop 3 days and you're safe" doesn't hold
GA4 has data arriving up to 7 days late, and attribution credit for key events can change for up to 12 days after it's recorded
-
Classify with the unsettled stretch left in, and the pages you name for repair change
On our own site, the count of articles judged to be declining swelled 3.1x
-
Decide in advance where to cut each week, and write down the period you dropped
Only the search side gets dropped. Revenue measured by your own tag doesn't wait for the delay
1. Only the Most Recent Days Are Down in the Monday Report#
The dip at the right edge isn't a decline — it's a stretch that hasn't finished being aggregated.
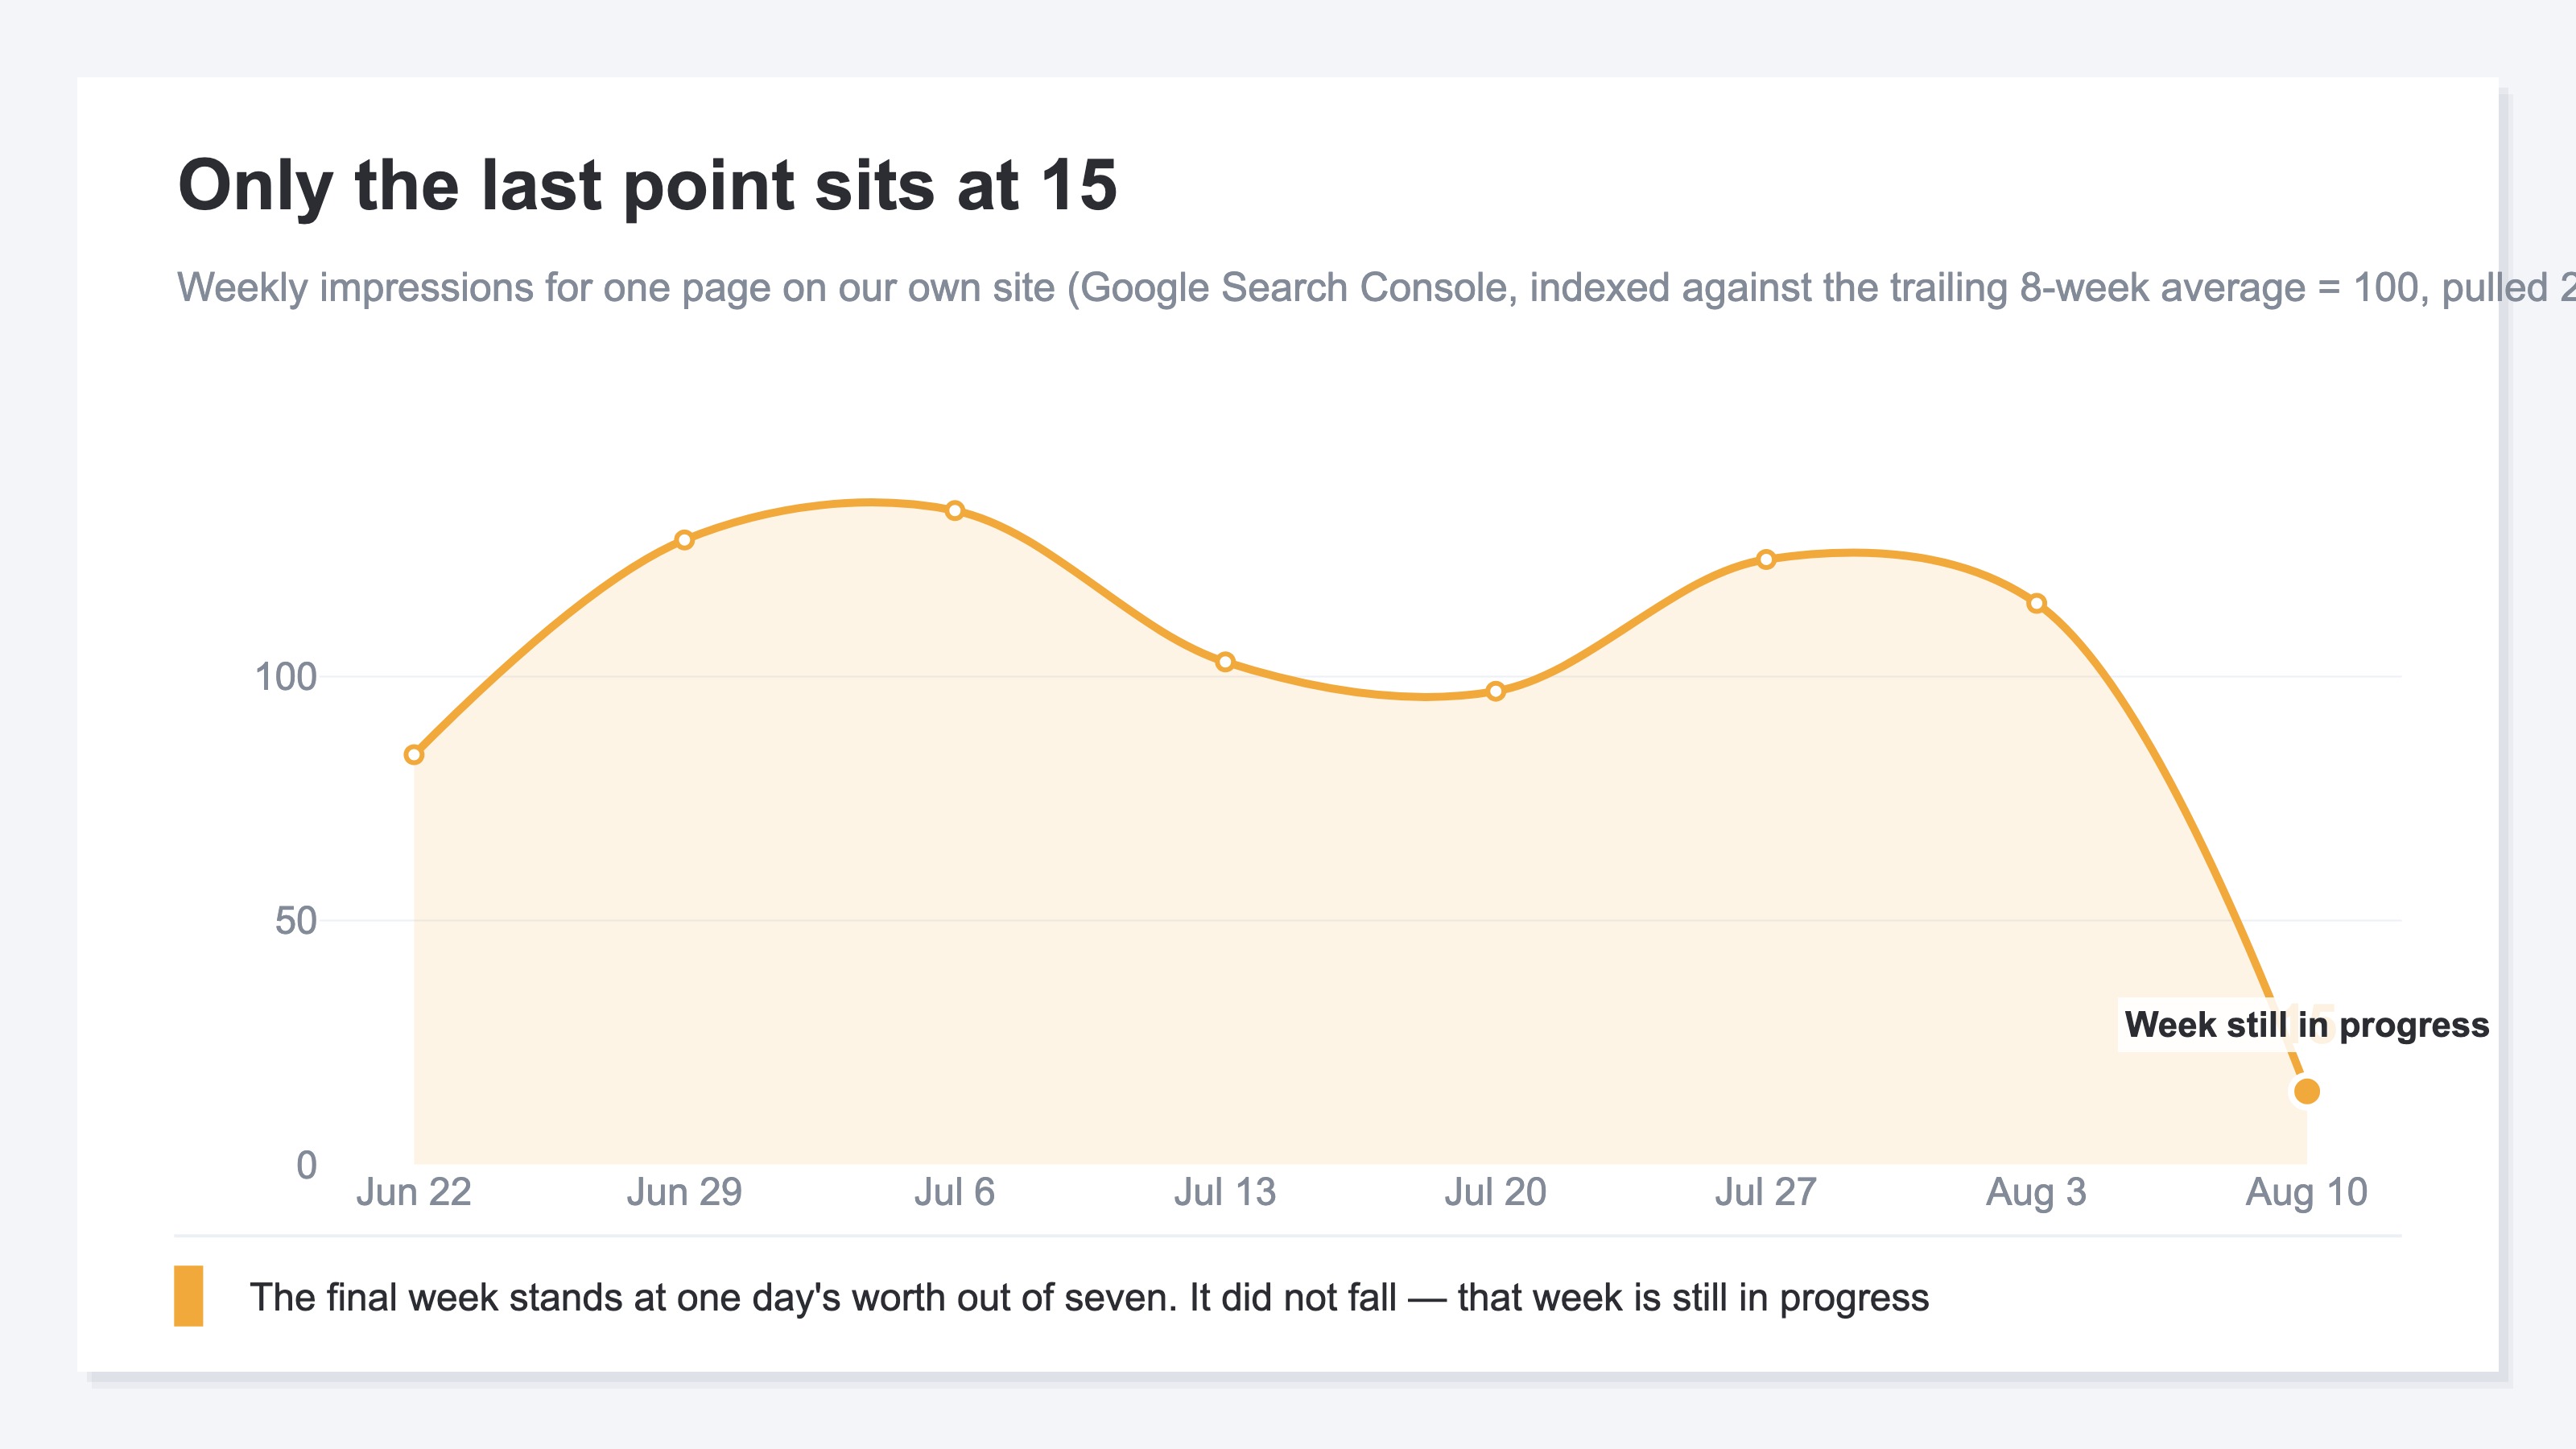
Plot weekly impressions and the last point alone comes out low. Build the same chart again the following week and the point that was caved in has returned to its former height. Down, back, down again. If that repeats every week, it isn't a symptom — it's how the thing works.
We picked one page with heavy search exposure on our own site and compared its weekly impressions against the trailing 8-week average. The seven weeks from late June to early August all land between 84% and 134% of that average. Only the final week reads 15%. That is the height of one day's worth sitting in a seven-day slot: the week isn't over.
Google Search Console Help states that collected data should normally be available in 2-3 days[1]. The "last 3 days" in the title is that 2-3 days plus a day of margin. GA4 takes a different amount of time again, so we split that out into the next section.
If updating itself has been stopped for weeks, that's a different symptom. How to tell the two apart is covered in Google Search Console not updating. That one is about a one-off delay and waiting for the fix to land. This one is about a stretch that arrives without fail every week, and where you cut it.
The thing to hold on to is that numbers are displayed for the unsettled stretch too. Nobody compares a blank cell, but if a number is showing, you compare it. How it's displayed comes up in the next section.
On December 12, 2024 Google announced the new 24-hour view and improvements to data freshness[4]. The same post says the average data delay was decreased by almost half[4]. It got faster, but the unsettled stretch didn't disappear.
2. Time to Settle Differs by Data Source#
How long it takes to settle is decided separately for each data source.
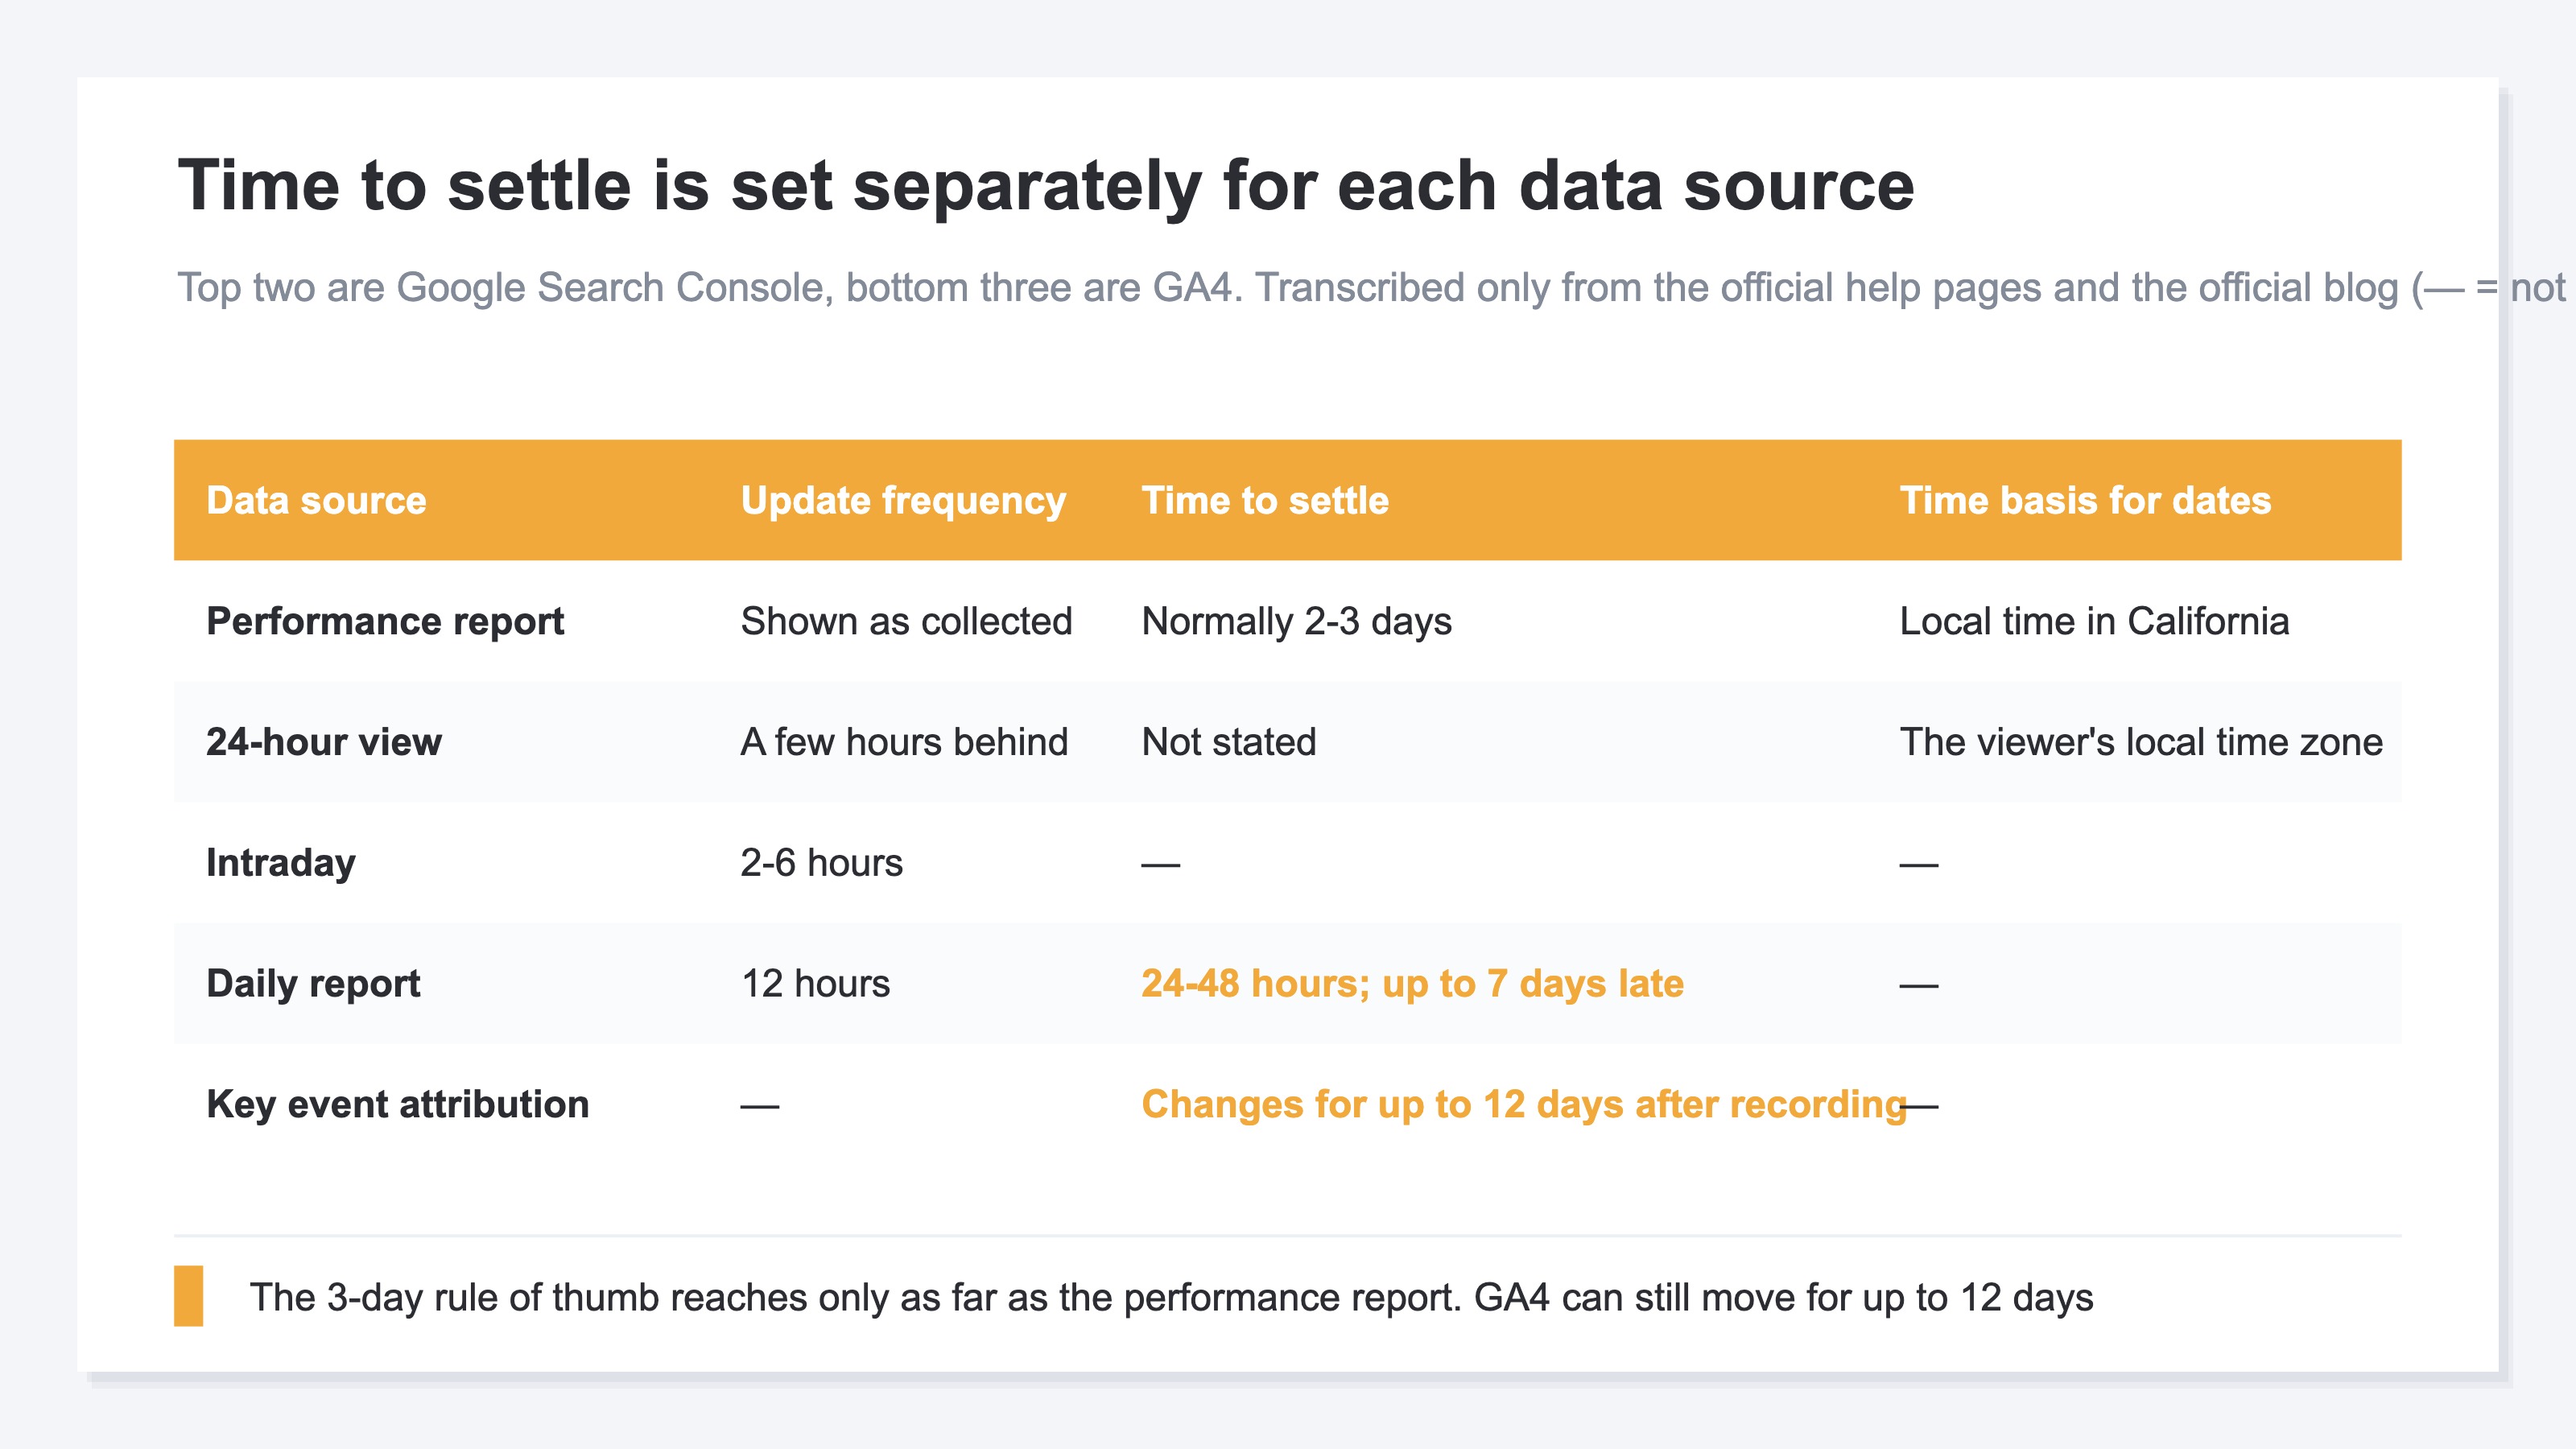
For the Google Search Console performance report, collected data is normally available in 2-3 days[1]. There is a second thing that shifts: the basis for the date. The report tracks daily data according to local time in California, so the timestamps are California local time[1]. That misaligns, every time, with week boundaries you drew in your own time zone.
There's guidance on provisional data as well. The newest data can be preliminary, meaning it's still being collected and might change in the next few hours, and preliminary data is indicated by a dotted line on the graph[2]. The 24-hour view added in December 2024 is displayed in the viewer's local time zone[4]. Two different time bases sit inside the same screen.
GA4 takes longer. Processing can take 24-48 hours, with a rough guide of 2-6 hours for standard intraday and 12 hours for daily[3]. Up to here, "drop 3 days and you're safe" looks like it would cover it.
A fixed three-day cutoff still does not cover GA4. The same help page says some data can arrive late, potentially up to 7 days delayed[3]. It also says attribution credit for key events can change for up to 12 days after the key event is recorded[3]. Drop 3 days and the revenue and conversions on the GA4 side can still move for another twelve.
Aggregation behaves differently in the stretch that hasn't come together yet. Stricter cardinality limits are applied until the daily data is available, which makes the "(other)" row more likely on properties with high-cardinality dimensions[3]. That phenomenon is covered in GA4 missing rows and the (other) row. Delay isn't the only route by which numbers move after they settle — there is also revenue revised downward by returns. And when the numbers don't match what you expected, why Google Search Console clicks don't add up takes the same shape.
3. An Unsettled Week Changes Which Pages Get Named#
Compare with a half-finished week left in, and the page you name for repair next changes.
Every week we classify the articles on the site, and articles whose search demand itself has run out are taken off the rewrite list. Adding content doesn't bring that surface back, so the effort goes elsewhere. We tried removing the step that drops any week that hasn't reached Sunday from this classification. The count of articles judged to have lost search demand swelled 3.1x. Articles that should have been rewritten get taken off the list along with the rest.
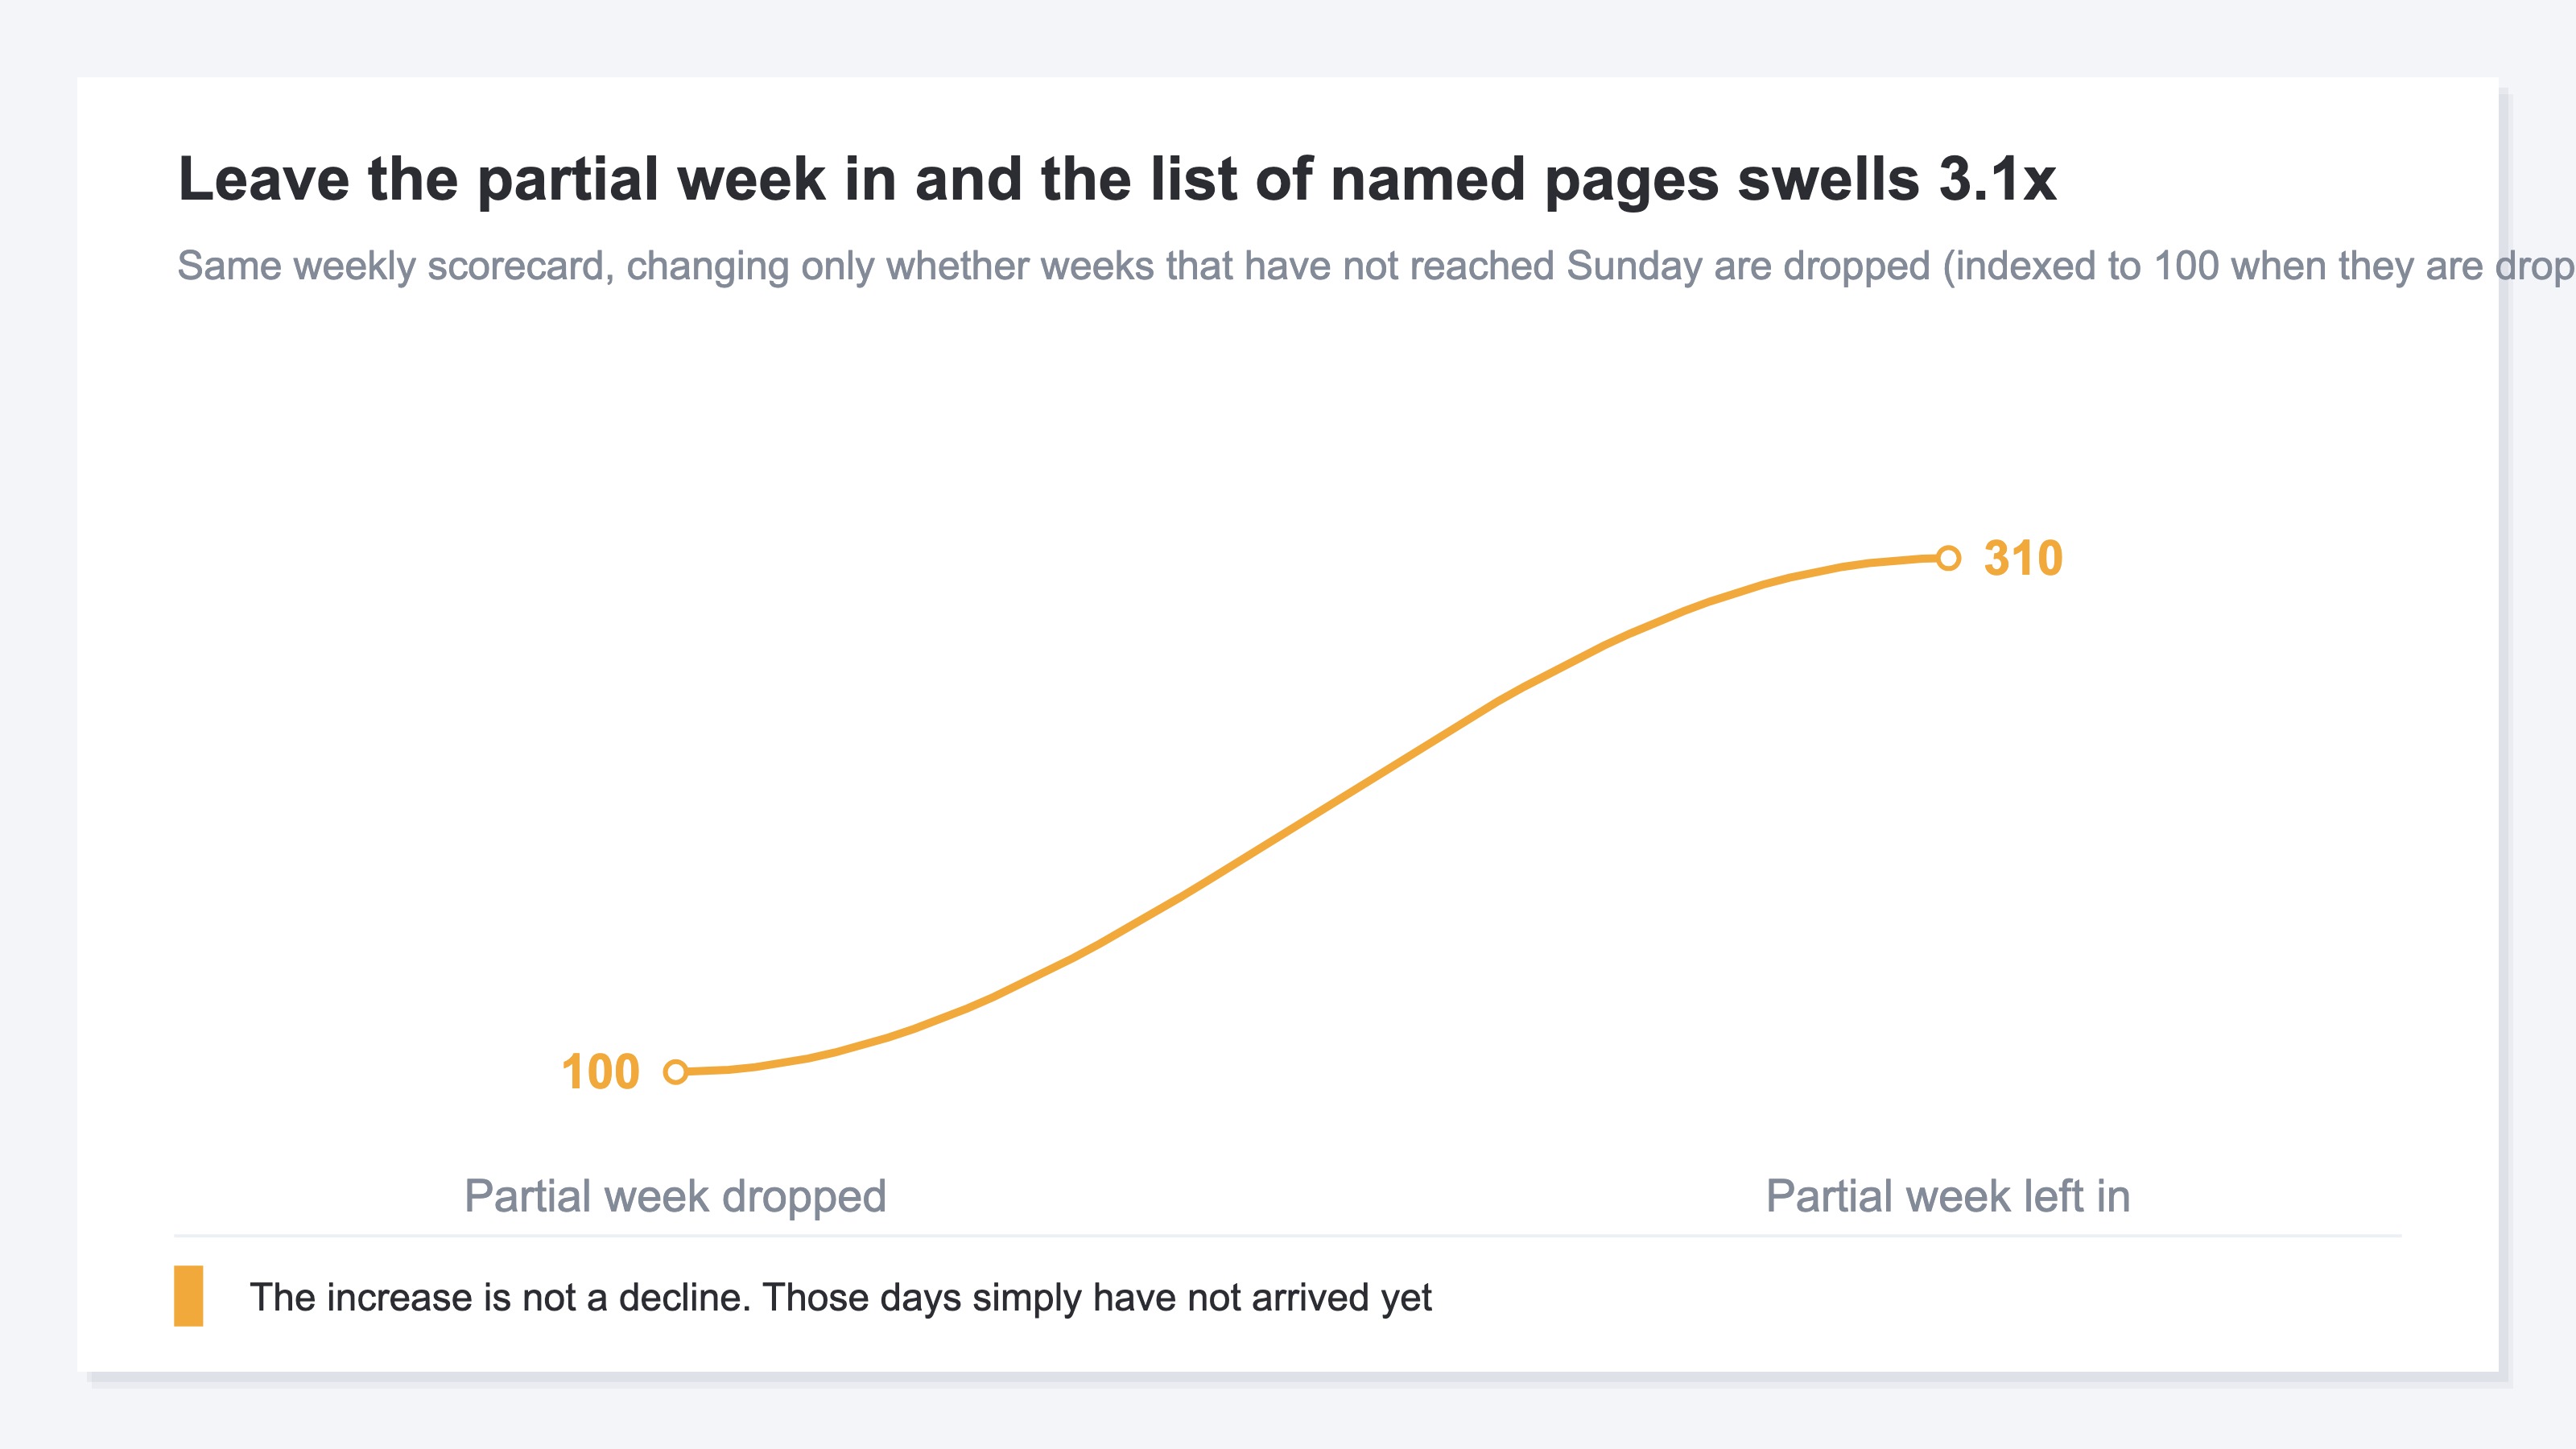
What we pulled was the same weekly scorecard. Weeks start on Monday, and the only thing changed was whether the step that drops weeks not reaching Sunday, the last day of the week, was applied.
The reason it swells is simple. A half-finished week holds only a few days' worth of clicks against seven days' worth of articles. Compared against the previous period it naturally reads lower. The drop lands almost uniformly across every page, so the top and the bottom sink alike. But the verdict is cut at a threshold, so only the pages that straddle the boundary change their label.
Here is where it gets awkward. As long as you're looking at the whole trend, the uniform sinking is visible and you notice it. The moment you classify individual pages, that sinking turns into a verdict reading "this page isn't coming back." Which pages you leave alone gets decided from there.
The same thing happens when periods aren't aligned page by page. If one page's prior-period comparison runs through Sunday and another's runs through Wednesday, the two comparisons aren't comparable. Comparing numbers while the measurement conditions differ is also covered in rank trackers and Google Search Console disagree.
The work itself fits on one line. The load sits in the weekly routine: recall where the right edge falls for each data source, realign the period page by page, record the week you dropped. Every week.
4. Decide Where to Cut Each Week in Advance#
Stop deciding on the spot each week and fix the cut position as an operating rule.
Turn that rule into two report steps. Any week that hasn't reached the last day of the week gets dropped from the comparison. And the dates of the week you dropped get one written line in the report.
The second one is tempting to skip, and it's the one that works. Whoever looks back at that report three months later has no idea how far the data ran. When someone in the company says "it's down from last month," whether you can show the range of the comparison is what changes.
Looking at things by week has itself become easier to handle than it used to be. On December 10, 2025 Google introduced weekly and monthly views, and the announcement notes that misaligned weekends can make the daily comparison chart difficult to interpret[5].
The revenue side is a different matter. Revenue and sessions measured by the tag on your own site don't wait for the search delay. Play it safe and drop 3 days off everything, and you throw away recent revenue that was never late in the first place. The side that should be dropped is the search side only.
And here is why this job never goes away. On the same single report, numbers from the settled stretch and numbers from the stretch that hasn't settled are displayed in exactly the same way. Which is which isn't written anywhere on the report. So every week, it's the human side that has to remember.
RevenueScope solution
RevenueScope classifies the content pages on a site into five states by their period-over-period movement, and shows landing sessions and landing revenue inside the same response. In doing so, it separates the aggregation window by data source. The classification and period comparison derived from Google Search Console put the right edge a few days back to allow for the delay, while sessions and revenue measured by the tag on the site itself run through today.
The separated periods land at the head of the response as they are. Pulled on August 12, 2026 with a 30-day specification, the current period ran from July 10 to August 9, 2026 and the prior period from June 9 to July 9, 2026. Not the 30 days counting back from today — the right edge is placed three days earlier. You don't have to remember where you cut each week because those dates ship with the response.
Ask an AI assistant such as ChatGPT over MCP "which pages are dropping out of search?" and for fictional store Minamo it comes back in this shape.
| Page | Clicks now/prior | Position now/prior | Verdict | Landing sessions | Landing revenue |
|---|---|---|---|---|---|
| /blog/sensitive-skin-toner-guide | 240 / 400 | 8.5 / 5.2 | Decaying | 900 | ¥360,000 |
| /blog/how-to-apply-toner | 6 / 5 | 14.0 / 15.0 | Growth candidate | 60 | ¥10,000 |
| /blog/pore-care-order | 150 / 90 | 5.5 / 9.0 | Rising | 500 | ¥150,000 |
| /blog/how-to-remove-sunscreen | 180 / 170 | 6.0 / 6.4 | Stable | 700 | ¥210,000 |
Note: the table above is one example (illustrative) built for fictional store Minamo to explain the point. Clicks and position come from the period with the right edge placed a few days back, while landing sessions and landing revenue come from the period running through today — even inside a single table, the coverage is split. The sample store that opens from the CTA runs on sample data refreshed daily, so the same cut will not produce matching figures.
A smaller position number means a higher rank. The article at the top has gone from 400 clicks to 240, and its position has slipped from 5.2 to 8.5. The verdict is Decaying, and its landing revenue is ¥360,000 — the largest of the four.
Nothing changes places here. The leader by clicks and the leader by landing revenue are the same article. The value isn't in discovering a reversal; it's in settling that this is the one row to protect. The second article is picked up as a growth candidate on 6 clicks, but its landing revenue is ¥10,000. The row to work on first is the one above it.
FAQ#
Frequently asked questions#
Q. Is dropping the last 3 days enough to be safe?
A. For Google Search Console, roughly speaking that guide is enough. GA4 is another matter. Some data arrives up to 7 days late, and attribution credit for key events can change for up to 12 days after the key event is recorded[3].
Q. What if I have to submit a report partway through the week?
A. Drop the half-finished week from the comparison and add one written line for the period you dropped. Revenue and sessions measured by the tag on your own site don't wait for the search delay, so those can be used right up to the present.
Q. Does the dip in average position happen for the same reason?
A. It does. Average position over a stretch with few impressions gets pulled around by the small amount of data. On our own site too, the average position for a week that hadn't arrived was displayed lower than for the weeks that had come together. That doesn't mean the ranking itself fell.
Summary#
When only the right edge of a weekly report is down, that isn't a decline — it's a stretch that hasn't finished being aggregated. Collected Google Search Console data is normally available in 2-3 days, and daily data is recorded according to local time in California[1]. GA4 takes longer still, with data arriving up to 7 days late and attribution credit for key events changing for up to 12 days after it's recorded[3].
"Drop 3 days and you're safe" works as a statement about Google Search Console, but it doesn't apply to the report as a whole. Classify with the unsettled stretch left in and, on our own site, the count of articles judged to have lost search demand swelled 3.1x.
There are only two things to settle. Weeks that haven't reached the last day of the week get dropped. The period you dropped gets written into the report. Next time you build the weekly report, how far does the data behind that right-edge point actually run?
See which ads actually drive revenue, at a glance
Free up to 2,000 sessions/month, AI connection included. No credit card required. Up and running in 5 minutes.
References#
- [1] Google Search Console Help "About Search Console data" (2026)
- [2] Google Search Console Help "Performance report (Search results): Overview and basic setup" (2026)
- [3] Google Analytics Help "[GA4] Data freshness" (2026)
- [4] Google Search Central Blog "An improved way to view your recent performance data in Search Console" (2024)
- [5] Google Search Central Blog "Introducing weekly and monthly views in Search Console" (2025)