There are so many rank tracker tools that the moment you start comparing them on features and price, you're lost in a maze. Which one crawls the most terms, how much a month, can you export to CSV. The things to compare never stop piling up. And yet, past all that, the thing you really need to decide isn't "which tool to use." It's "which ranks to chase." Any tool can pull ranks all day. The problem is that a rank table can't tell you whether a rank that went up actually turned into revenue for your store. Before you compare tools on features and price, this piece walks through, in order, how to choose the ranks worth chasing — the ranks that move revenue when they rise.
Table of contents
TL;DR#
- Comparing rank trackers on features and price doesn't settle anything: unless you've decided which ranks to chase, whichever tool you pick leaves you with the same uncertainty.
- A rank worth chasing is one that is both "nearly there (positions 8-20)" and "moves revenue when it rises." A term sitting at position 1 that no one buys from stays low-value to chase.
- Hunting for positions 8-20 is the right starting point, but it's only half. Only when you layer on the other half — "does this term move revenue?" — do the ranks worth chasing narrow down.
- The idea is easy, but matching rank against revenue term by term, every time, is heavy work. That's exactly why it pays to have rank and revenue lined up in one view from the start.
1. Choose a rank tracker by which ranks to chase, not by features or price#
Bottom line: before you compare rank trackers on features and price, choose by whether the tool helps you decide which ranks to chase. Unless which ranks to chase is settled, whichever tool you pick leaves you with the same uncertainty.
Comparing tools turns into a swamp fast. Crawl volume, supported search engines, monthly price, CSV export, API. The items keep multiplying, and some people get so put off by the pricing that they run off to build their own. "It just crawls a site — this price is ridiculous" is a complaint you'll see on forums over and over. But this comparison swamp is built on the wrong axis in the first place. Every tool will tell you "what position a term is at now" and "how many places it moved since last week." That's not where the difference is. The difference is whether, sitting in front of that rank table, you can decide "so, which ranks do I chase?"
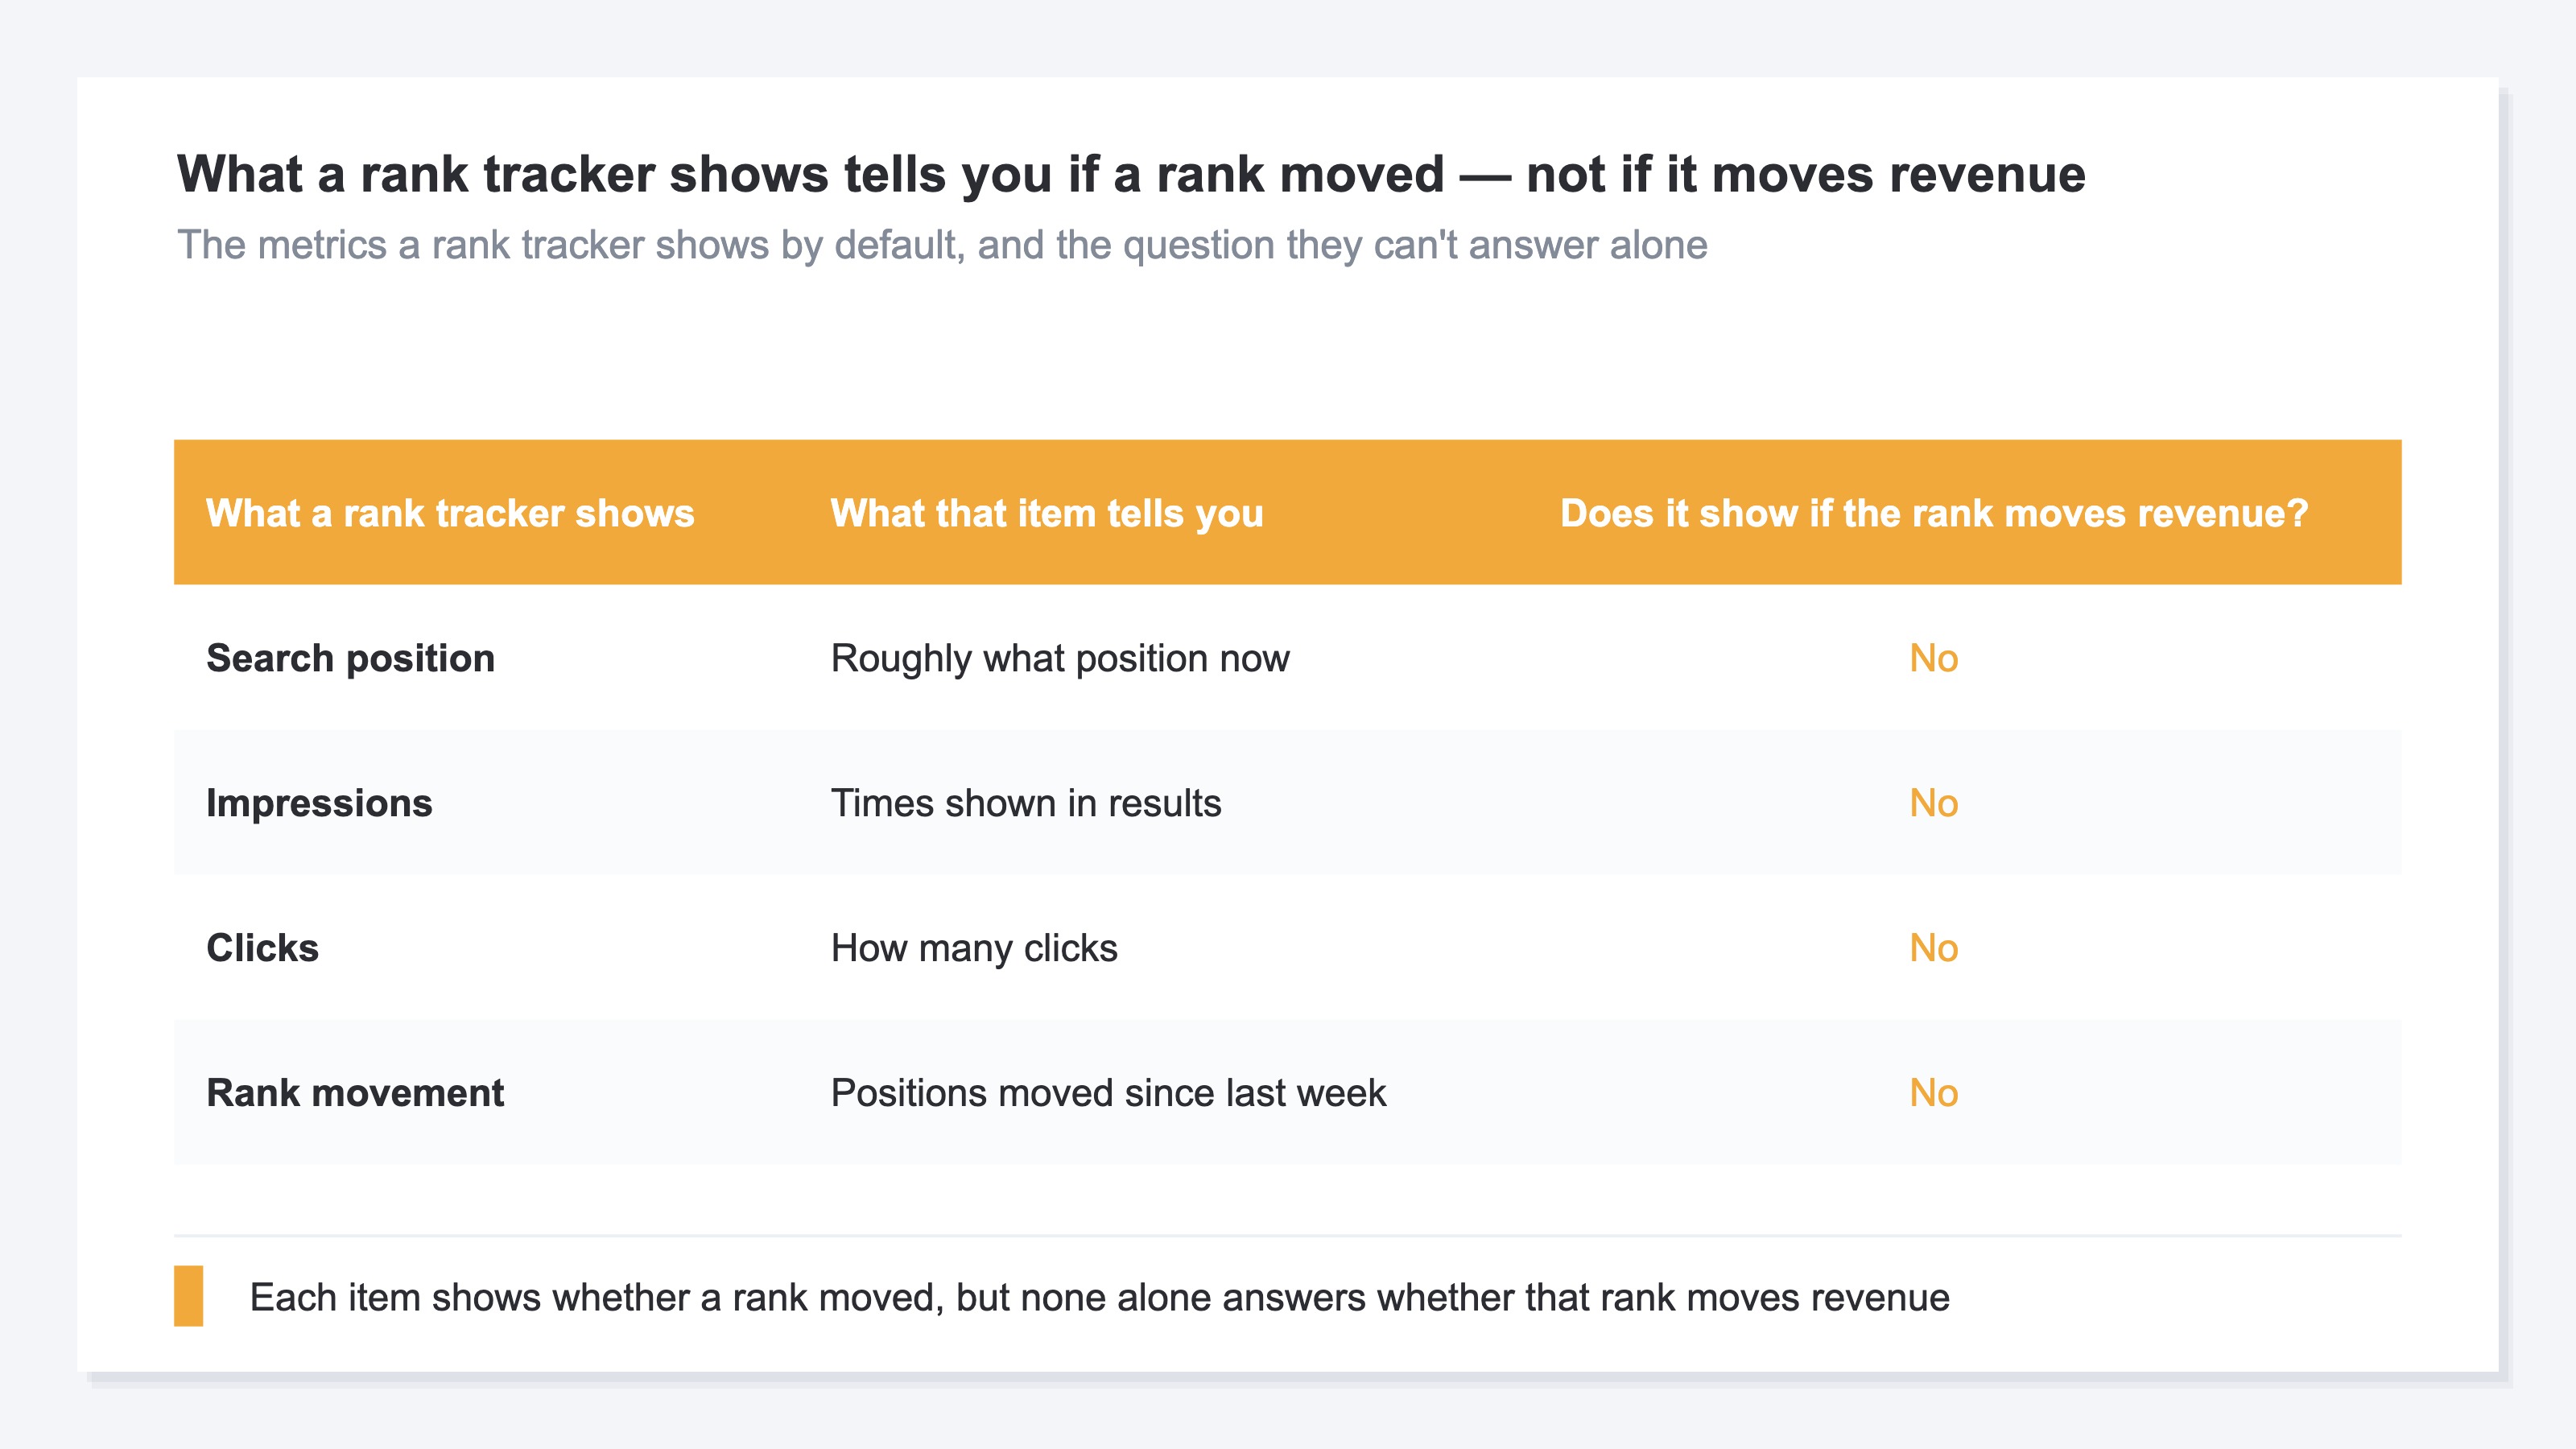
There's a weakness common to rank trackers here. They can pull the ranks, but they can't show whether those ranks did anything for revenue. Search position, impressions, clicks, rank movement — every one of them tells you "did the rank move?" None of them tells you "is this a rank that moves revenue?" So when you stare at every rank equally, you get worn down chasing the ups and downs of hundreds of terms. The first question in choosing a tool isn't how many features it has. It's "can it narrow down to the ranks that move revenue when they rise?"
2. Ranks worth chasing meet two tests: nearly there and revenue-moving#
Bottom line first: a rank worth chasing is decided by the overlap of two conditions — "nearly there" and "moves revenue when it rises."
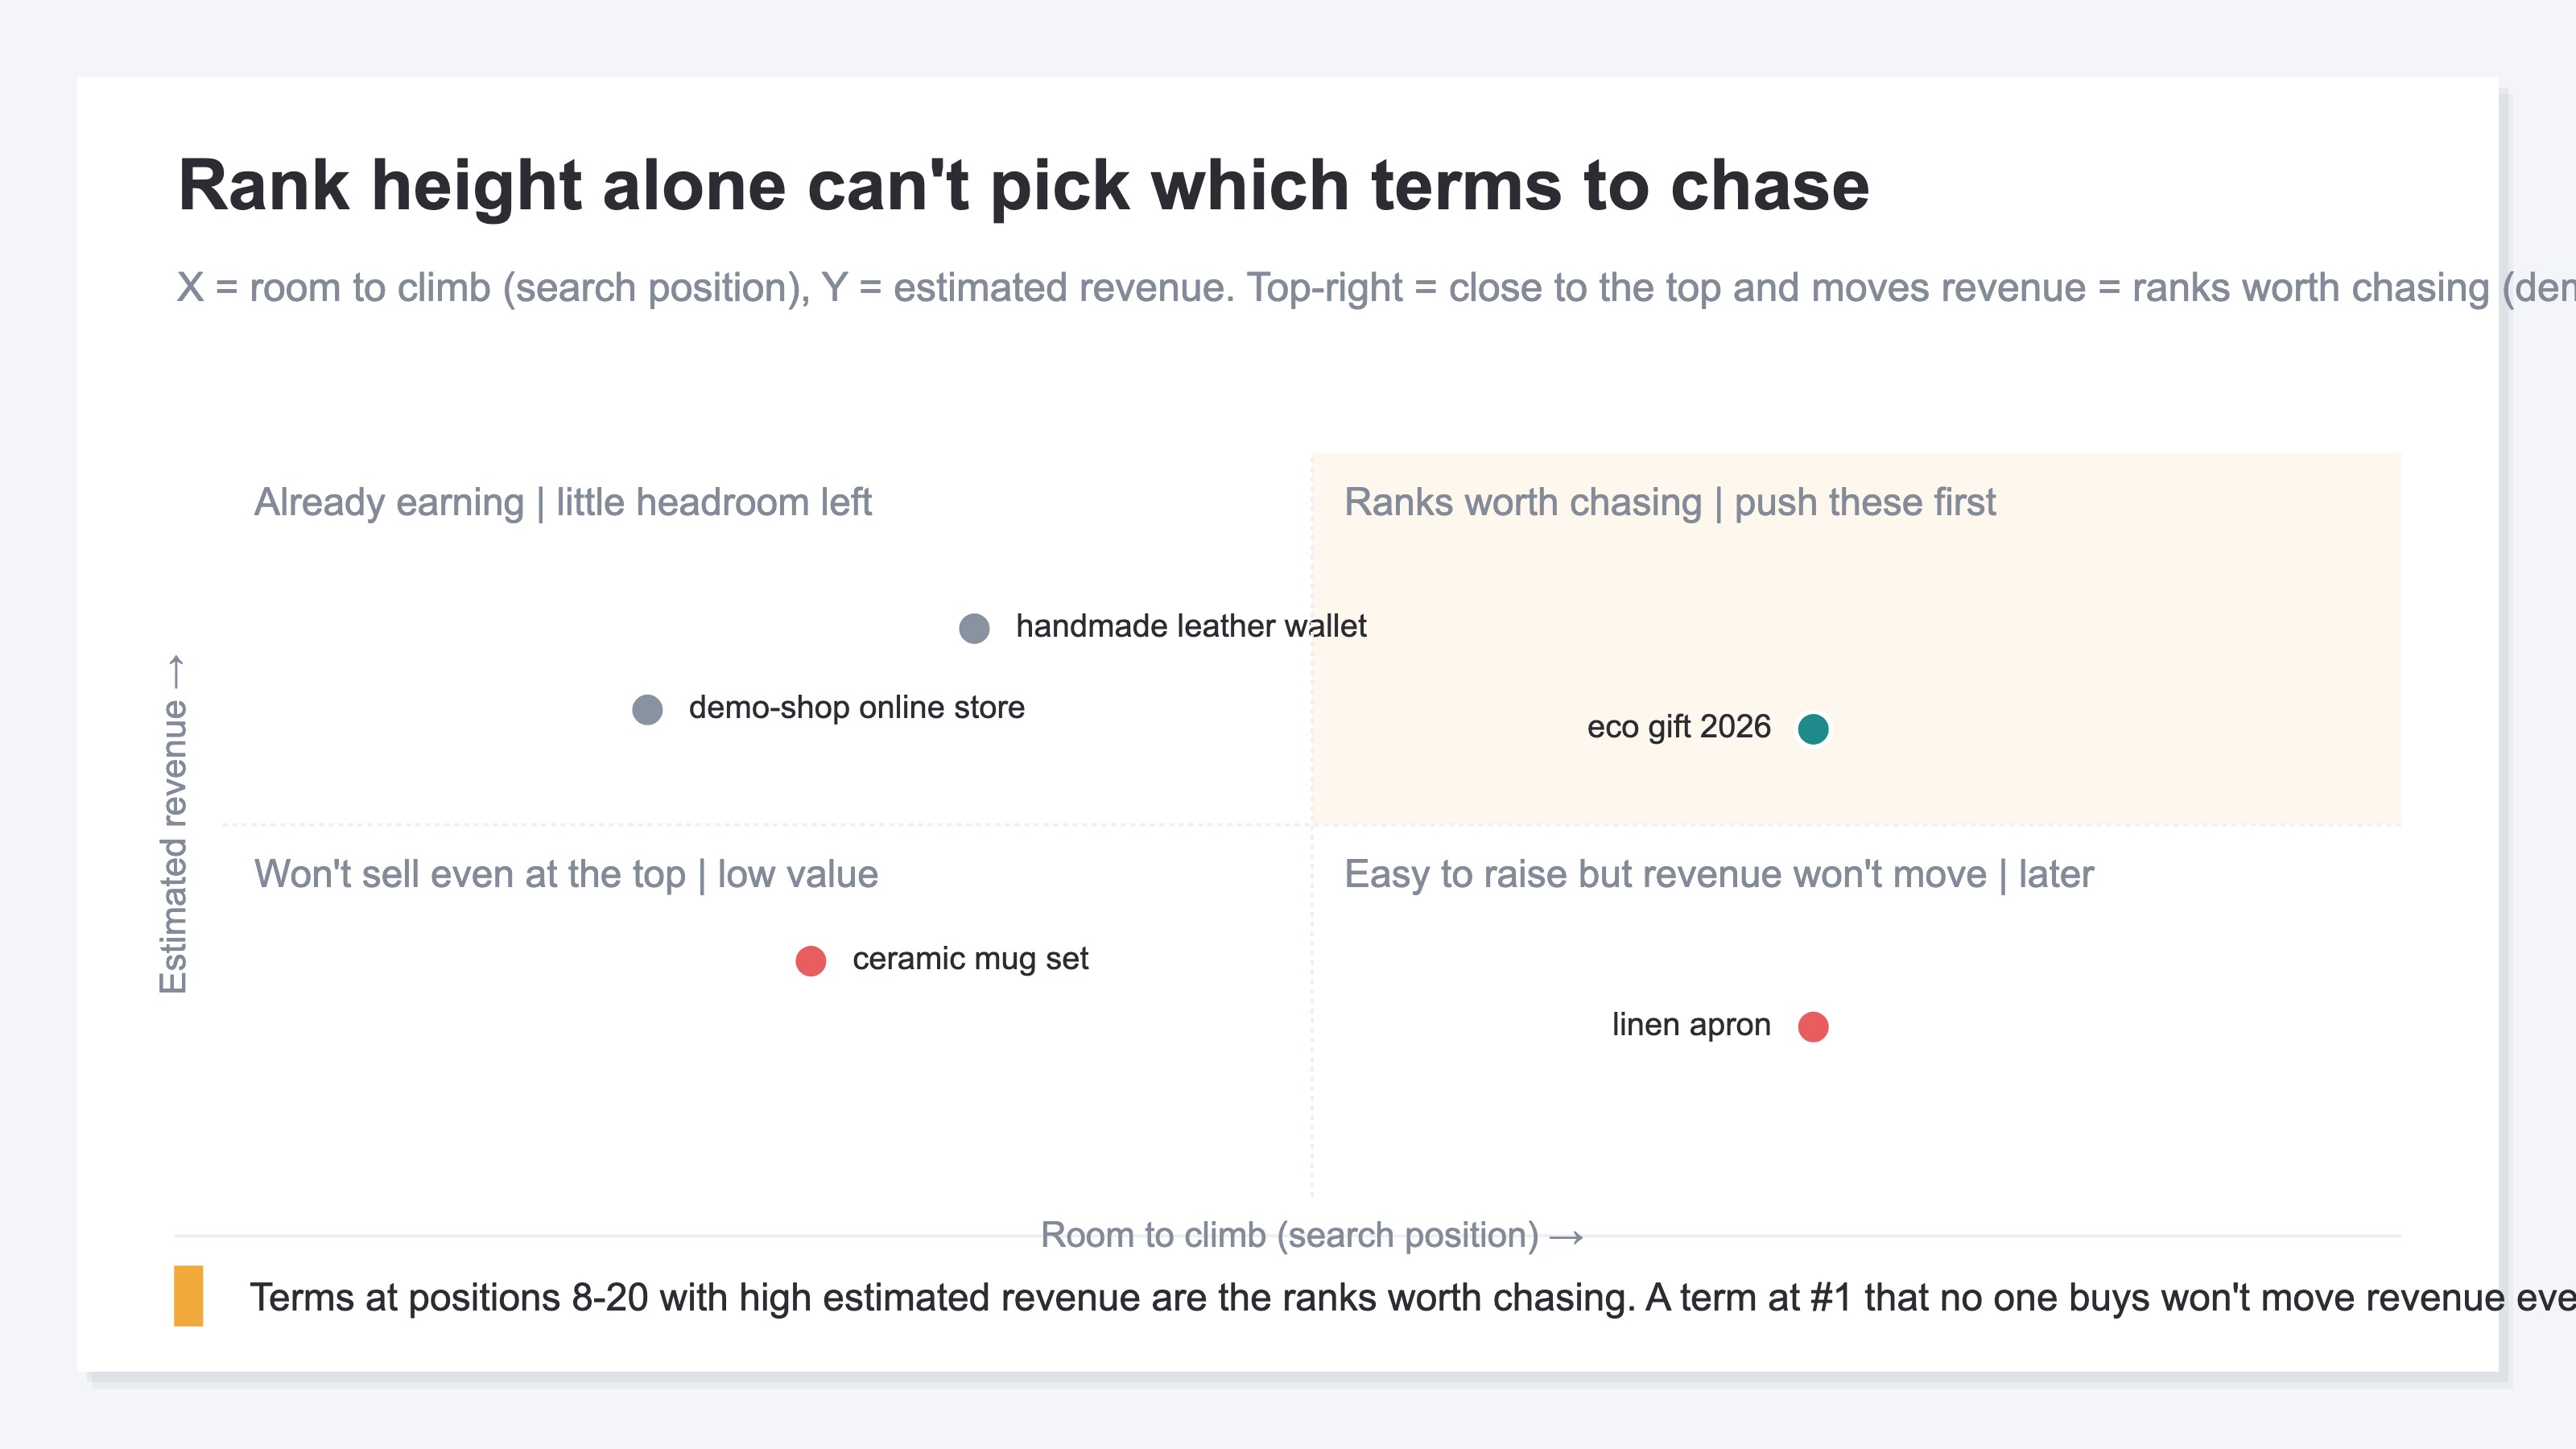
Start with the first half, "nearly there." The terms with the most room to break into the top are the ones sitting around positions 8-20. Among practitioners, "open Google Search Console (GSC) and look for pages at positions 8-20 — they're almost there" has become a standard line. Pushing a term already at position 1 has little headroom left, and a term at position 50 is a long way from arriving. The "nearly there" band in between is where the return per unit of effort is largest. This far, opening GSC once is enough to get your bearings.
But that alone is only half. "Nearly there" only tells you it's "easy to raise," not that it's "worth raising." A term at position 9 whose visitors almost never buy will barely move revenue no matter how far you push it up the page. Conversely, a term at position 2 whose visitors buy well is already a breadwinner, with little headroom left. So onto "nearly there" you layer a second axis: "does this term move revenue when it rises?" A rank worth chasing is where these two overlap — a rank that is both "nearly there" and "moves revenue when it rises." The disconnect where a rank goes up but revenue doesn't move is covered in detail in How to read revenue per search keyword.
3. Fold the rank list into one axis, ordered by revenue impact#
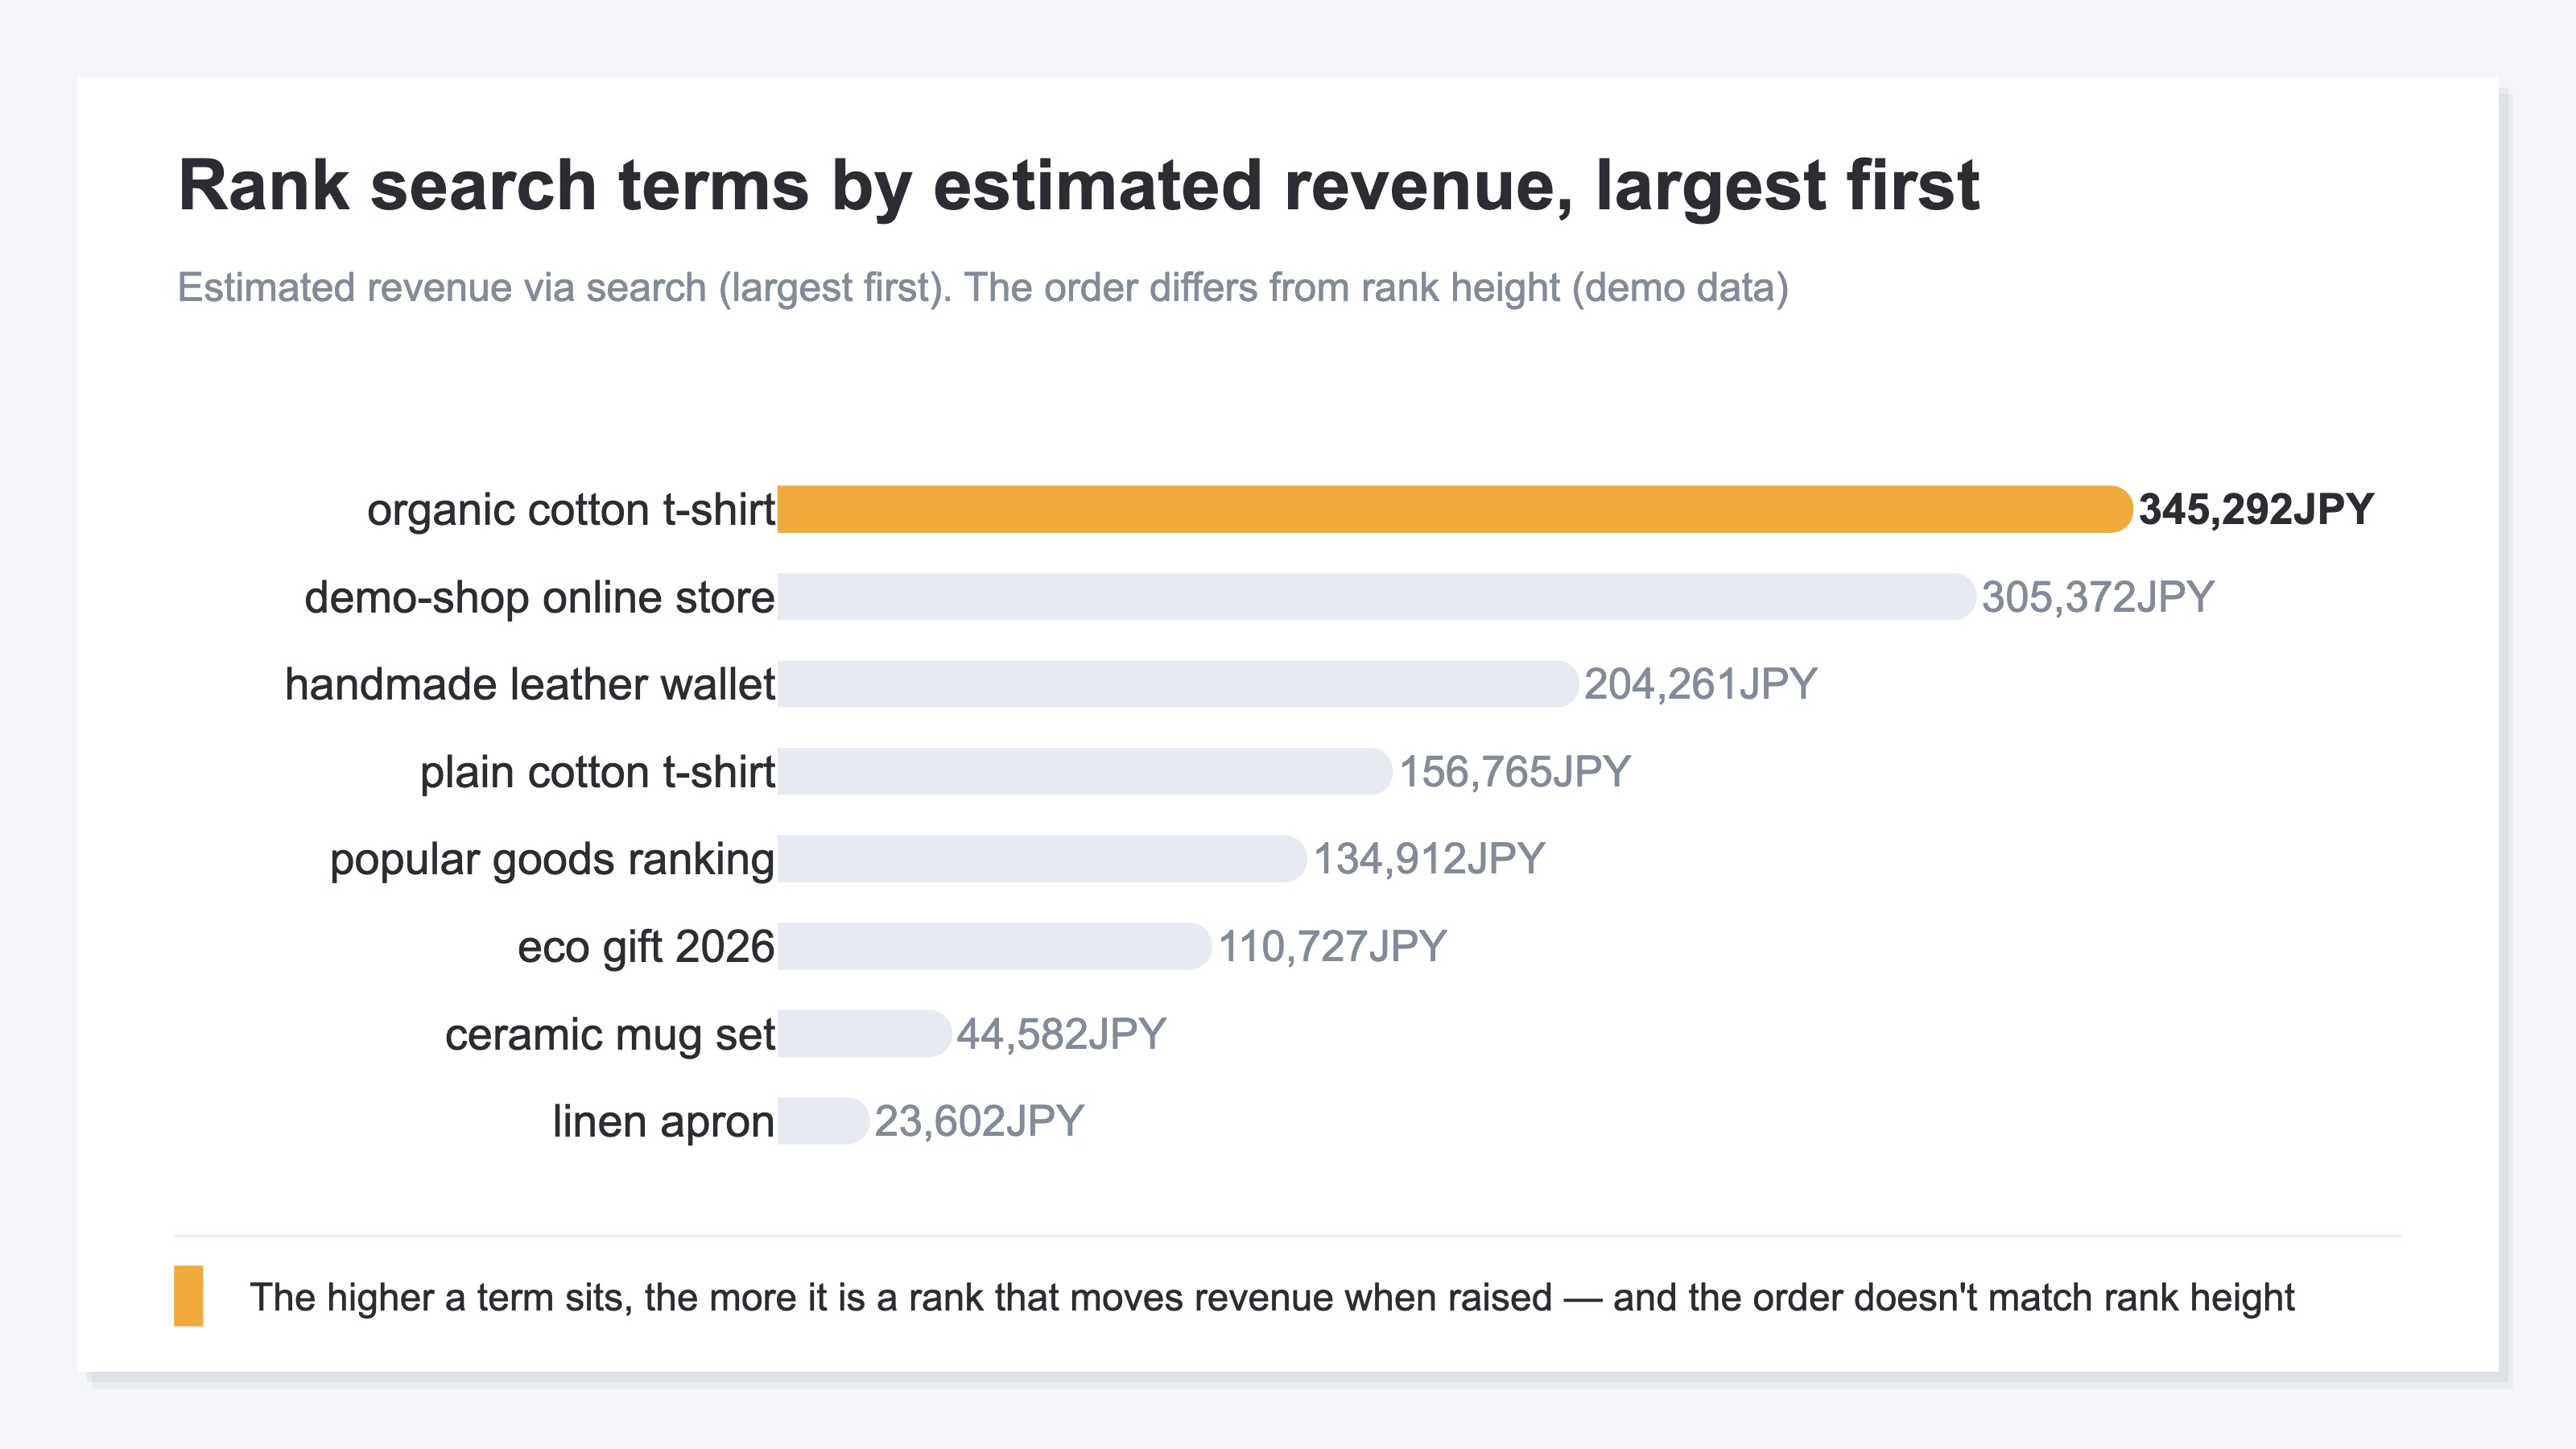
Bottom line: the fastest way to narrow the ranks you chase is to fold the rank list into a single axis — "order by how much revenue rises when the rank does." Rather than juggling two axes, re-sort by revenue impact; it's quicker.
The idea is simple. For each search term, work out the estimated revenue it seems to generate, and sort by that, largest first. Estimated revenue is a rough figure: the revenue per visit from search — Revenue Per Session (RPS) — multiplied by that term's clicks. Loosely put, it's a way of reading, term by term, "roughly how much revenue does this term seem to lead to?" Sort this way and the order shifts away from rank height. A term at position 1 with small estimated revenue sinks to the bottom, and a term at position 9 with large estimated revenue rises to the top. Then, looking only at terms in the "positions 8-20" band, you get the terms that are "nearly there and, on top of that, large in revenue" lined up from the top. That's your list of ranks worth chasing.
One caveat: estimated revenue isn't a figure that nails the exact yen. It's a conservative approximation, deliberately skewed low; it covers Google Search only, and there's a two-to-three-day lag before it's reflected. So use it not as the amount itself but as a tool for reading scale and order — "which terms are large and which are small." Branded search (searches on your own company or brand name) tends to inflate both rank and revenue, so it can sit higher than its real strength deserves. How to spot that inflation is laid out in How branded search inflates your SEO numbers.
The idea itself is easy enough, as far as we've gone. What's heavy is keeping it up every time. The rank tracker is one screen, revenue is another. There are dozens to hundreds of terms, and both rank and revenue shift day to day. Matching them by hand, term by term, working out estimated revenue and re-sorting — you can grind through it once on willpower, but repeating it every week and every month is, honestly, real work. That's exactly why there's value in having rank and revenue lined up in one view from the start.
RevenueScope helps
By now it's clear that ranks worth chasing are decided by the overlap of "nearly there (positions 8-20)" and "moves revenue when it rises." What's left is how to keep that match-up going every time. This is the point where a rank tracker alone gets structurally heavy. The rank tracker is the rank screen; revenue is a separate screen. Which ranks move revenue can only be worked out by matching them across channels, by hand, every time.
RevenueScope folds that match-up into one view from the start. For each search term, it lines up clicks, average search position, and estimated revenue, and lets you re-sort by estimated revenue, largest first (figures shown are demo data). On top of that, it surfaces the terms that are "one step from the top" (around positions 8-20), ordered by the size of the estimated-revenue opportunity. Without hopping between a rank tracker and a revenue table, "which ranks to chase to move revenue" lines up from the top in one view.
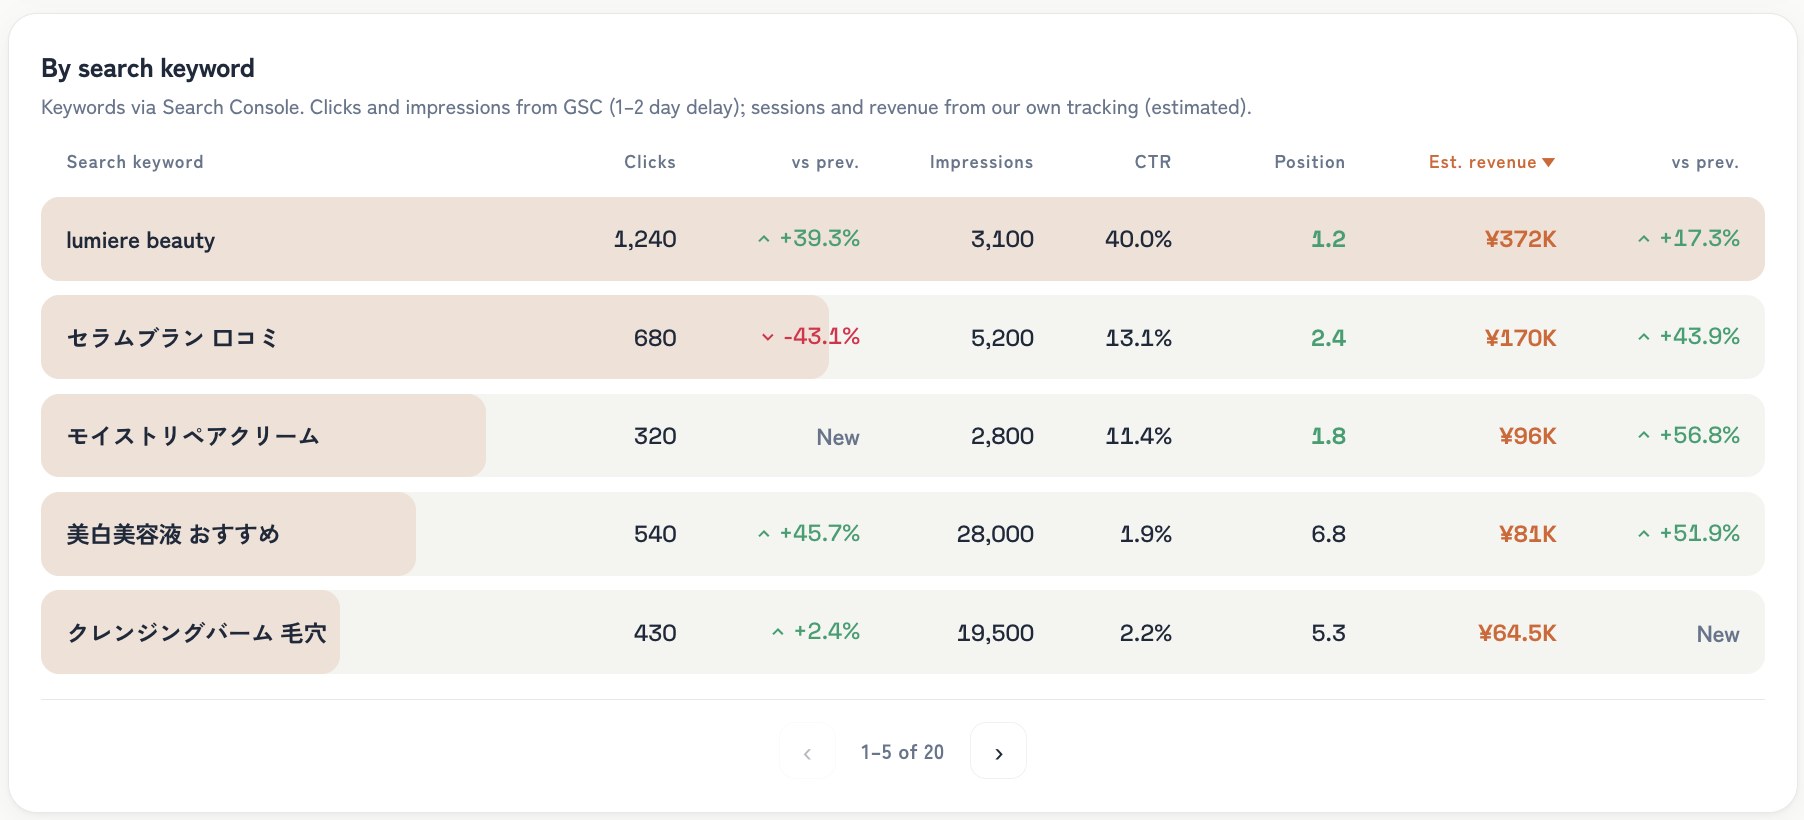
RevenueScope's by-search-keyword dashboard (demo data, fictional store / last 90 days). Clicks, impressions, position, and estimated revenue per search term in one view, read largest-revenue-first.
What to read on this screen isn't the size of any single number, but that search position, impressions, and estimated revenue don't sit in the same order. The term with the most impressions on screen — 28,000 — brings only ¥81K in estimated revenue; the volume of impressions hasn't turned into revenue. Conversely, a term with just 2,800 impressions comes out higher at ¥96K. The branded term (lumiere beauty) stands out at position 1.2 and ¥372K, but branded terms inflate in both rank and revenue and can look stronger than they really are. Watching rank or impressions alone, you might have graded a high-impression term as "producing results" and overlooked the terms that actually move revenue.
The estimated revenue RevenueScope shows is a conservative approximation — revenue per visit from search times clicks — a tool for reading which terms move revenue by their scale and order. Rather than gross margin or inventory, RevenueScope stays on rank and estimated revenue per search term and lines them up in one view. So instead of getting worn down staring at hundreds of ranks, you can choose your next move starting from the ranks that move revenue when they rise.
FAQ#
Frequently asked questions#
Q. So which rank tracker should I choose in the end?
A. Before choosing a tool, we'd suggest having a way to decide which ranks to chase. Ranks themselves are pulled by pretty much any tool, so they hardly make a difference. The difference is "can you narrow down to the ranks that move revenue when they rise?" Once you hold that axis, comparing features and price only as far as you need is plenty.
Q. Is "chase positions 8-20" the right advice?
A. As a starting point, yes. Position 1 has little headroom left, and far-off ranks are a long way from arriving. The "nearly there" band in between returns the most per unit of effort. But that only tells you it's "easy to raise," not that it's "worth raising." Only when you narrow that band down to the terms that move revenue when they rise do the ranks worth chasing get decided.
Q. Is estimated revenue an exact amount? Can I trust it?
A. It isn't a figure that nails the exact yen. It's a conservative approximation, deliberately skewed low: revenue per visit from search times clicks. It covers Google Search only, and there's a two-to-three-day lag. So use it not for the amount itself but to read the scale and order of "which terms are large and which are small."
Summary#
Comparing rank trackers on features and price leaves the same uncertainty unless which ranks to chase is settled. Every tool can pull ranks, but whether a rank moves revenue never shows up in a rank table. So the first axis in a comparison isn't how many features there are — it's "can it narrow down to the ranks that move revenue when they rise?"
Ranks worth chasing are decided by the overlap of "nearly there (positions 8-20)" and "moves revenue when it rises." You can get your bearings on the first by opening GSC, but without layering on the second, you end up chasing terms that sit at position 1 yet no one buys. Sort the terms that meet both by estimated revenue, largest first, and you have your list of ranks to chase. The idea is easy, but matching rank against revenue term by term, every time, is heavy work. That's exactly why, with rank and estimated revenue lined up in one view, you can choose your next move starting from the ranks that move revenue when they rise.
See which ads actually drive revenue, at a glance
Free up to 5,000 sessions/month, AI analyst included. No credit card required. Up and running in 5 minutes.