
You open an exploration to compare against the same month last year, and last year's data isn't there. GA4's data retention period is 2 months by default, and unless you have changed it to 14 months, explorations and funnel reports show nothing older than 2 months. The data hasn't been deleted, though. This article lays out what is still there, and what you can still keep from disappearing if you act today.
Contents
TL;DR#
- Last year's data going missing happens in explorations and funnel reports. Standard aggregated reports are not affected by the retention setting
- Comparison against the same month last year runs today, as-is, if you do it in the standard aggregated reports
- Increasing the retention period applies to data you have already collected and have not already deleted. Deletion runs on a monthly basis, so the sooner you change it, the more data stays
- Even after you switch to 14 months, event-level retention is automatically reduced to 2 months once the property becomes Large
- If you're going to feed a year-over-year change into your ad allocation, check first whether measurement even existed across the period you're comparing against
1. Only Explorations and Funnel Reports Lose the Data#
Whether last year's data shows up depends on which GA4 report you opened.
The Google Analytics help draws a firm boundary around what the retention setting reaches. "Keep in mind that the data retention setting does not affect standard aggregated reports (including primary and secondary dimensions) in your Google Analytics property, even if you create comparisons in the reports. The data retention setting only affects explorations and funnel reports"[1]. Over on the standard aggregated reports side, last year's figures are sitting there untouched. Which is to say the data was not deleted. What shrank is the range explorations and funnel reports can work with.
So the axis here is which report you compare in. That the standard aggregated reports are untouched by this setting is a point covered earlier in Do you need GA4's BigQuery export. That article uses it as a criterion for deciding whether the export is something your business needs; this one uses it as what to do after you notice something isn't showing. Same fact, used as a remedy rather than as a fork in a decision.
Isolation takes two steps. If you specified a date range in last year and came back empty in an exploration or a funnel report, the cause is the retention setting. If the same thing happens in a standard aggregated report, the cause is not retention. This article covers the former; if you landed on the latter, start by checking the date range you specified and which property is selected.
There are two retention periods to choose from. For a Google Analytics property, user-level data retention can be set to 2 months or 14 months, and other event data has the same two options. 26 months, 38 months and 50 months are choices for Analytics 360 properties only. Age, gender and interest data is always kept for 2 months regardless of the setting[1].
There is one more thing to watch at the boundary of the date range. If you use a date range longer than your retention period in a report that works on non-aggregated data, the data for that additional time is not visible. Even with retention set to 14 months, specify a date range of 14 months plus 1 day and that additional 1 day does not come back[1]. If shifting the date range by a single day turned the report empty, check the range you specified before you suspect the setting.
2. Switch to 14 Months Today and What Hasn't Been Deleted Stays#
Increasing the retention period is not only about the data you collect from here on.
The help says "when you increase the retention period it is applied to data that you have already collected." It goes on to state that "if you increase the retention period for a Google Analytics property, the change is applied to data that you have already collected and that you have not already deleted." And deletion happens automatically on a monthly basis once data reaches the end of the retention period[1]. Which means data past its expiry is not gone the same day. It is still there until the monthly process runs. Switch to 14 months today and whatever is still there falls under the extended setting. What has already been deleted does not come back.
You make the change in the admin screen. From Admin, in the Property column, open Data Settings > Data Retention, choose the Event data retention period you want, and click Save. This requires the Editor role. Analytics waits 24 hours before implementing the change, and during that period you can revert it with no effect on your data[1]. If you touch the setting and the exploration looks the same right afterward, that's because you're inside those 24 hours.
The setting doesn't necessarily hold after you change it, either. Once a standard property becomes Large (or a 360 property becomes XL), the event-level data retention setting is automatically reduced to 2 months. Event-level data older than 2 months becomes inaccessible and is permanently deleted. There is a warning first. As the property approaches the limit, a warning email goes to all property administrators, and another email is sent once the limit is reached[1]. Before you set 14 months, check that the administrators who receive those warning emails are in a position to actually read them.
Retention as a setting to get out of the way before you start is covered in GA4 explorations for ecommerce. This article covers the case where you opened last year's month without having done that.
There is one more move available: change where you compare. The retention setting doesn't reach the standard aggregated reports, so comparison against the same month last year runs there today, as-is. That said, explorations and standard reports don't return matching numbers even for the same period and the same metric. Why that is, is laid out in Why GA4 explorations show different numbers. Decide up front which number answers which question, and moving the comparison over to the standard aggregated reports won't shake your judgment.
3. A Year-Over-Year Number Alone Can't Decide the Next Allocation#
Revenue is up against the same month last year. What do you decide next?
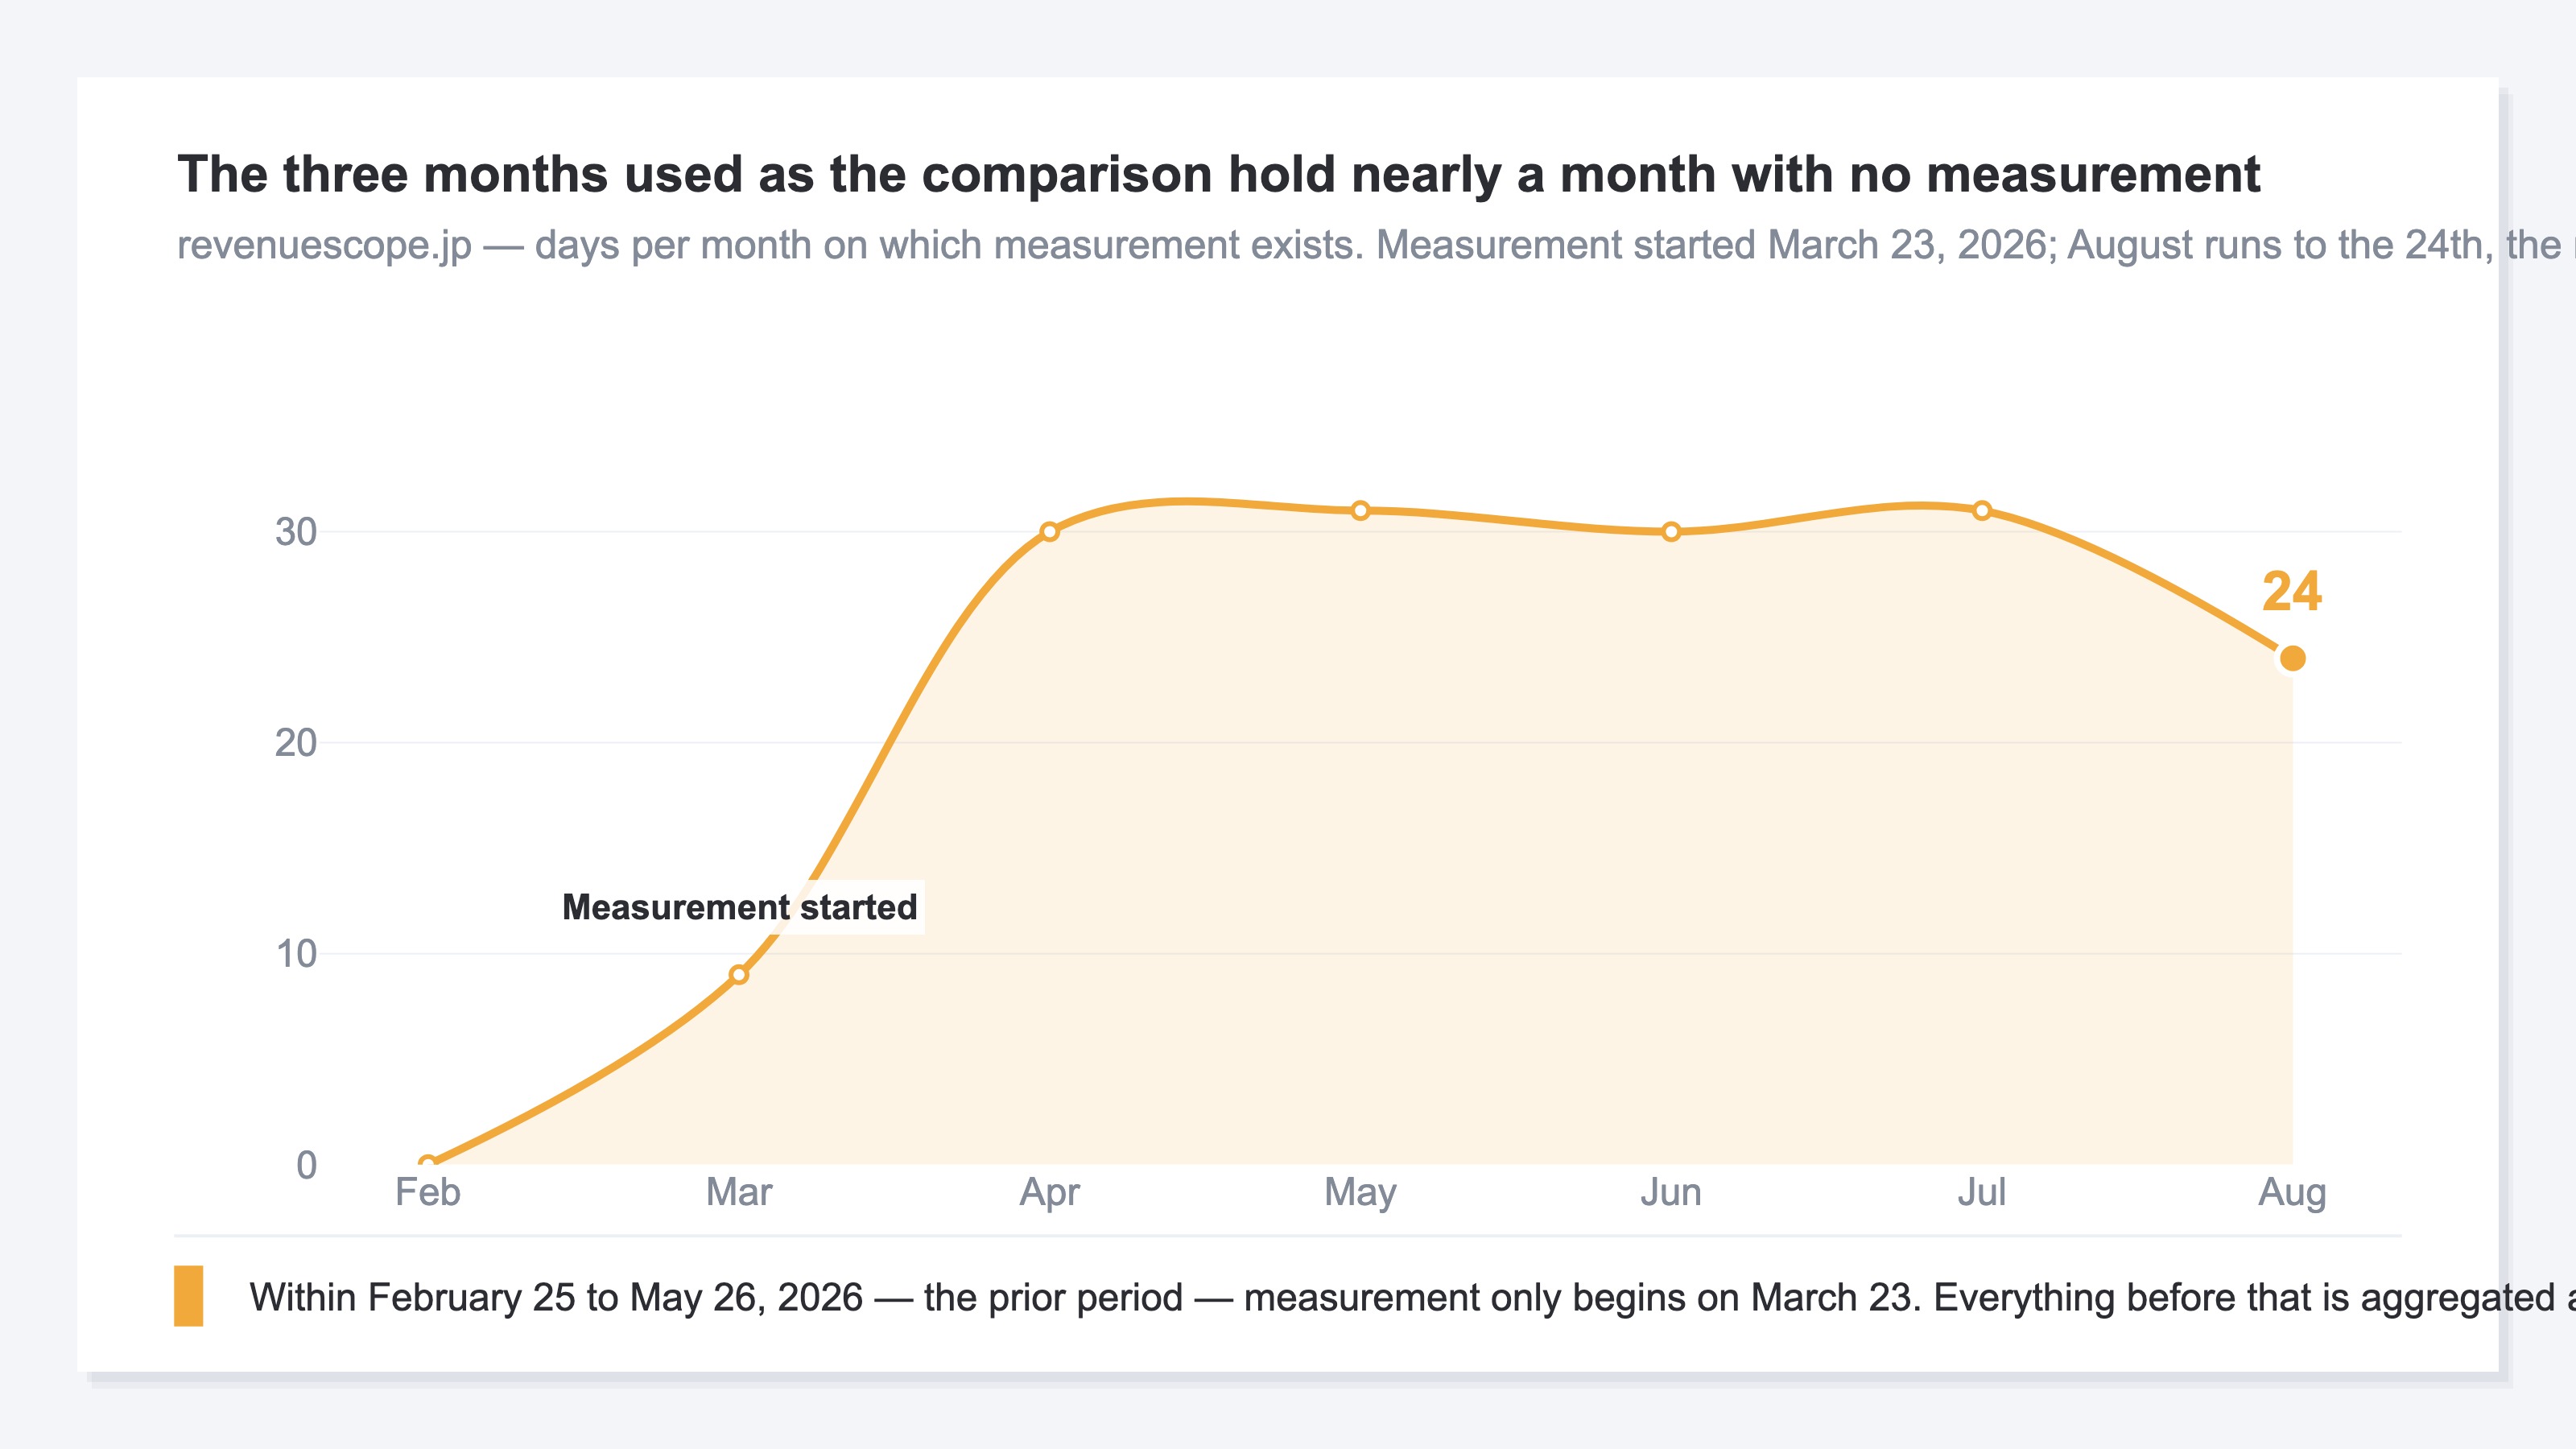
There's something to confirm first. A comparison only holds over a period where data exists. We aggregated our own site, revenuescope.jp, in RevenueScope. Retrieved on August 24, 2026, for the last 90 days (May 26 to August 24, 2026). Sessions over that period were up 311.4% against the prior period. The comparison counterpart is the immediately preceding 90 days (February 25 to May 26, 2026). Measurement on this site, however, started on March 23, 2026. For roughly 30% of the period serving as the prior period, measurement itself does not exist. A period with no measurement is aggregated as zero, so that +311.4% carries the gap in when measurement began, folded straight into it.
Even when the periods you're comparing are fully covered, what a standard aggregated report tells you stops at whether the number went up or down. GA4 aggregates sessions and revenue by channel, but there's no screen that puts revenue per visit — the unit of efficiency — at the center of a decision. The totals of the rise and fall are displayed, so from there it becomes a job of switching between reports and reassembling per-channel efficiency yourself. Repeat that every month and the reassembly costs more time than the comparison does.
Back to that +311.4%. Put that number alone in a report and it reads as more than tripled. In reality, measurement doesn't exist for roughly 30% of the prior period, and that stretch is aggregated as zero. Would someone handed only this number know the prior period contains a stretch with no measurement? If not, +311.4% is not a basis for allocation. To use a year-over-year change for allocation, you need per-channel efficiency compared over the same period.
RevenueScope solution
What you need once a year-over-year change is in hand is the breakdown of which channel the movement happened in. RevenueScope displays revenue, sessions, RPS (revenue per visit), AOV (average revenue per order) and CVR for a period you specify, with the current period alongside a comparison to the prior one. The daily trend sits on the same screen. The channel breakdown shows sessions, revenue and RPS for each channel, and for periods where ad spend has been entered, that channel's ad spend is shown alongside.
The prior-period comparison counterpart is the immediately preceding period of the same length. Handle the same-month-last-year comparison in GA4's standard aggregated reports, then break the change you saw there down by channel in RevenueScope. In that order, the information displayed on each screen is enough on its own to decide the allocation.
Here is an example where how you take the period changes the conclusion.
RPS by channel at fictional store D, aggregated over separate periods (illustrative)
| Channel | Same month last year | Last 30 days |
|---|---|---|
| Search | ¥120 | ¥90 |
| ¥80 | ¥150 | |
| Social ads | ¥60 | ¥70 |
Note: the figures above will not match the sample store's demo screen if you compare them. The demo screen runs on sample data, refreshed daily; this table is a teaching example built to isolate one shape only, the case where the order changes hands between periods.
Look at the same month last year alone and search leads on RPS at ¥120. Over the last 30 days, though, search has fallen to ¥90 and email has taken the lead at ¥150. Social ads went from ¥60 to ¥70 but stayed in last place. Decide next month's allocation off that one table for the same month last year, and the decision is to concentrate budget on a search channel that has already given up the lead.
The next move is to not fix on a single period. Aggregate RPS for both the same month last year and the last 30 days, and if the leader is the same channel, concentrate the allocation there. If they've changed places, confirm whether the change lasted one month or held across the last three months before you change the allocation. Fix the allocation off a table from one point in time and that chance to confirm disappears.
FAQ#
Frequently asked questions#
Q. If I switch retention to 14 months, does past data come back?
A. What has already been deleted does not come back. The extended setting does, however, apply to data that has already been collected and not yet deleted[1]. Deletion runs on a monthly basis starting from data that has reached the end of the retention period, so change it today and whatever hasn't been deleted yet falls under the extension.
Q. Do I have to extend retention to compare against the same month last year?
A. Not in the standard aggregated reports. The retention setting only affects explorations and funnel reports[1]. That said, the numbers you had built in an exploration and the numbers in a standard report won't match. When you move the comparison to standard reports, decide first which number answers which question.
Q. I set 14 months and at some point it was back to 2 months. Why?
A. Because once the property becomes Large, the event-level data retention setting is automatically reduced to 2 months. Event-level data older than 2 months becomes inaccessible and is permanently deleted[1]. Emails go to all property administrators both when the property approaches the limit and when it reaches it[1].
Q. I changed the setting and the exploration still looks the same
A. The change takes 24 hours to be implemented. During that period you can revert it, with no effect on your data. If nothing older than 2 months shows up after 24 hours have passed, check whether the date range you specified exceeds the retention period. With retention set to 14 months, specify 14 months plus 1 day and that additional 1 day is not shown[1].
Summary#
If what you had open today was an exploration or a funnel report, move where you compare over to the standard aggregated reports. Comparison against the same month last year runs there. On top of that, go to Data Settings > Data Retention in the admin screen and change the retention period to 14 months. Data retention is a choice between 2 months and 14 months, and increasing it applies to data that has already been collected and not yet deleted[1]. Deletion runs on a monthly basis, so the sooner you change it, the wider the range that survives.
Last, whether a year-over-year change becomes the basis for your ad allocation comes down to whether measurement existed across the period you're comparing against. The last 90 days I aggregated for revenuescope.jp were up 311.4% against the prior period, but roughly 30% of the period serving as the prior period predates the start of measurement. What that number expresses is the length of the comparable period more than the size of the growth. Put the basis for the decision on per-channel efficiency compared over the same period.
See which ads actually drive revenue, at a glance
Free up to 2,000 sessions/month, AI connection included. No credit card required. Up and running in 5 minutes.