
How common are measurement tags across e-commerce sites? We examined public HTML and public Google Tag Manager (GTM) containers for 823 normalized URL hosts for e-commerce sites extracted from search results. Among 765 hosts where tags could be assessed, 56% had an ad tag and 23% showed no detectable GA4 tag. This article separates each denominator, explains what the observations do not prove, and moves the decision back to a store's own channel revenue.
Contents
TL;DR#
- Of 823 normalized hosts, public tags could be assessed on 765
- On the 765 assessable hosts, 56% had ad tags, 49% retained old Universal Analytics (UA) tags, and 23% showed no detectable GA4 tag
- Among the 432 hosts with ad tags, 67% had tags from at least two platforms
- A visible tag does not prove current ad spend or successful measurement
- Budget decisions should use the store's own revenue, sessions, and RPS by channel
1. Do Not Divide Every Result by the 823 Normalized Hosts#
The 823 normalized hosts are the units the study attempted to scan, not the denominator for every result.
We selected e-commerce sites that appeared near the top of searches for the legally required merchant disclosure used in Japan. Marketplace-only sellers and stores outside those top results were not included. Observations were collected from August 15 through 23, 2026. This non-random group does not represent all e-commerce businesses in Japan.
One item in this article is a search-result URL host lowercased and deduplicated after removing a leading www.. It is neither a company count nor a registrable-domain count. Different subdomains remain separate items.
The study used only HTML returned to ordinary visitors and public GTM containers. Of the 823 normalized hosts, 773 returned HTTP 200 with readable content. Tags could be assessed on 765 of those hosts. Fifteen acquisition failures were scanner-side SSL connection failures, which do not establish a problem on the merchant's site, so they were excluded from the assessable denominator. A host whose public implementation did not reveal its tags was not counted as having no measurement setup.
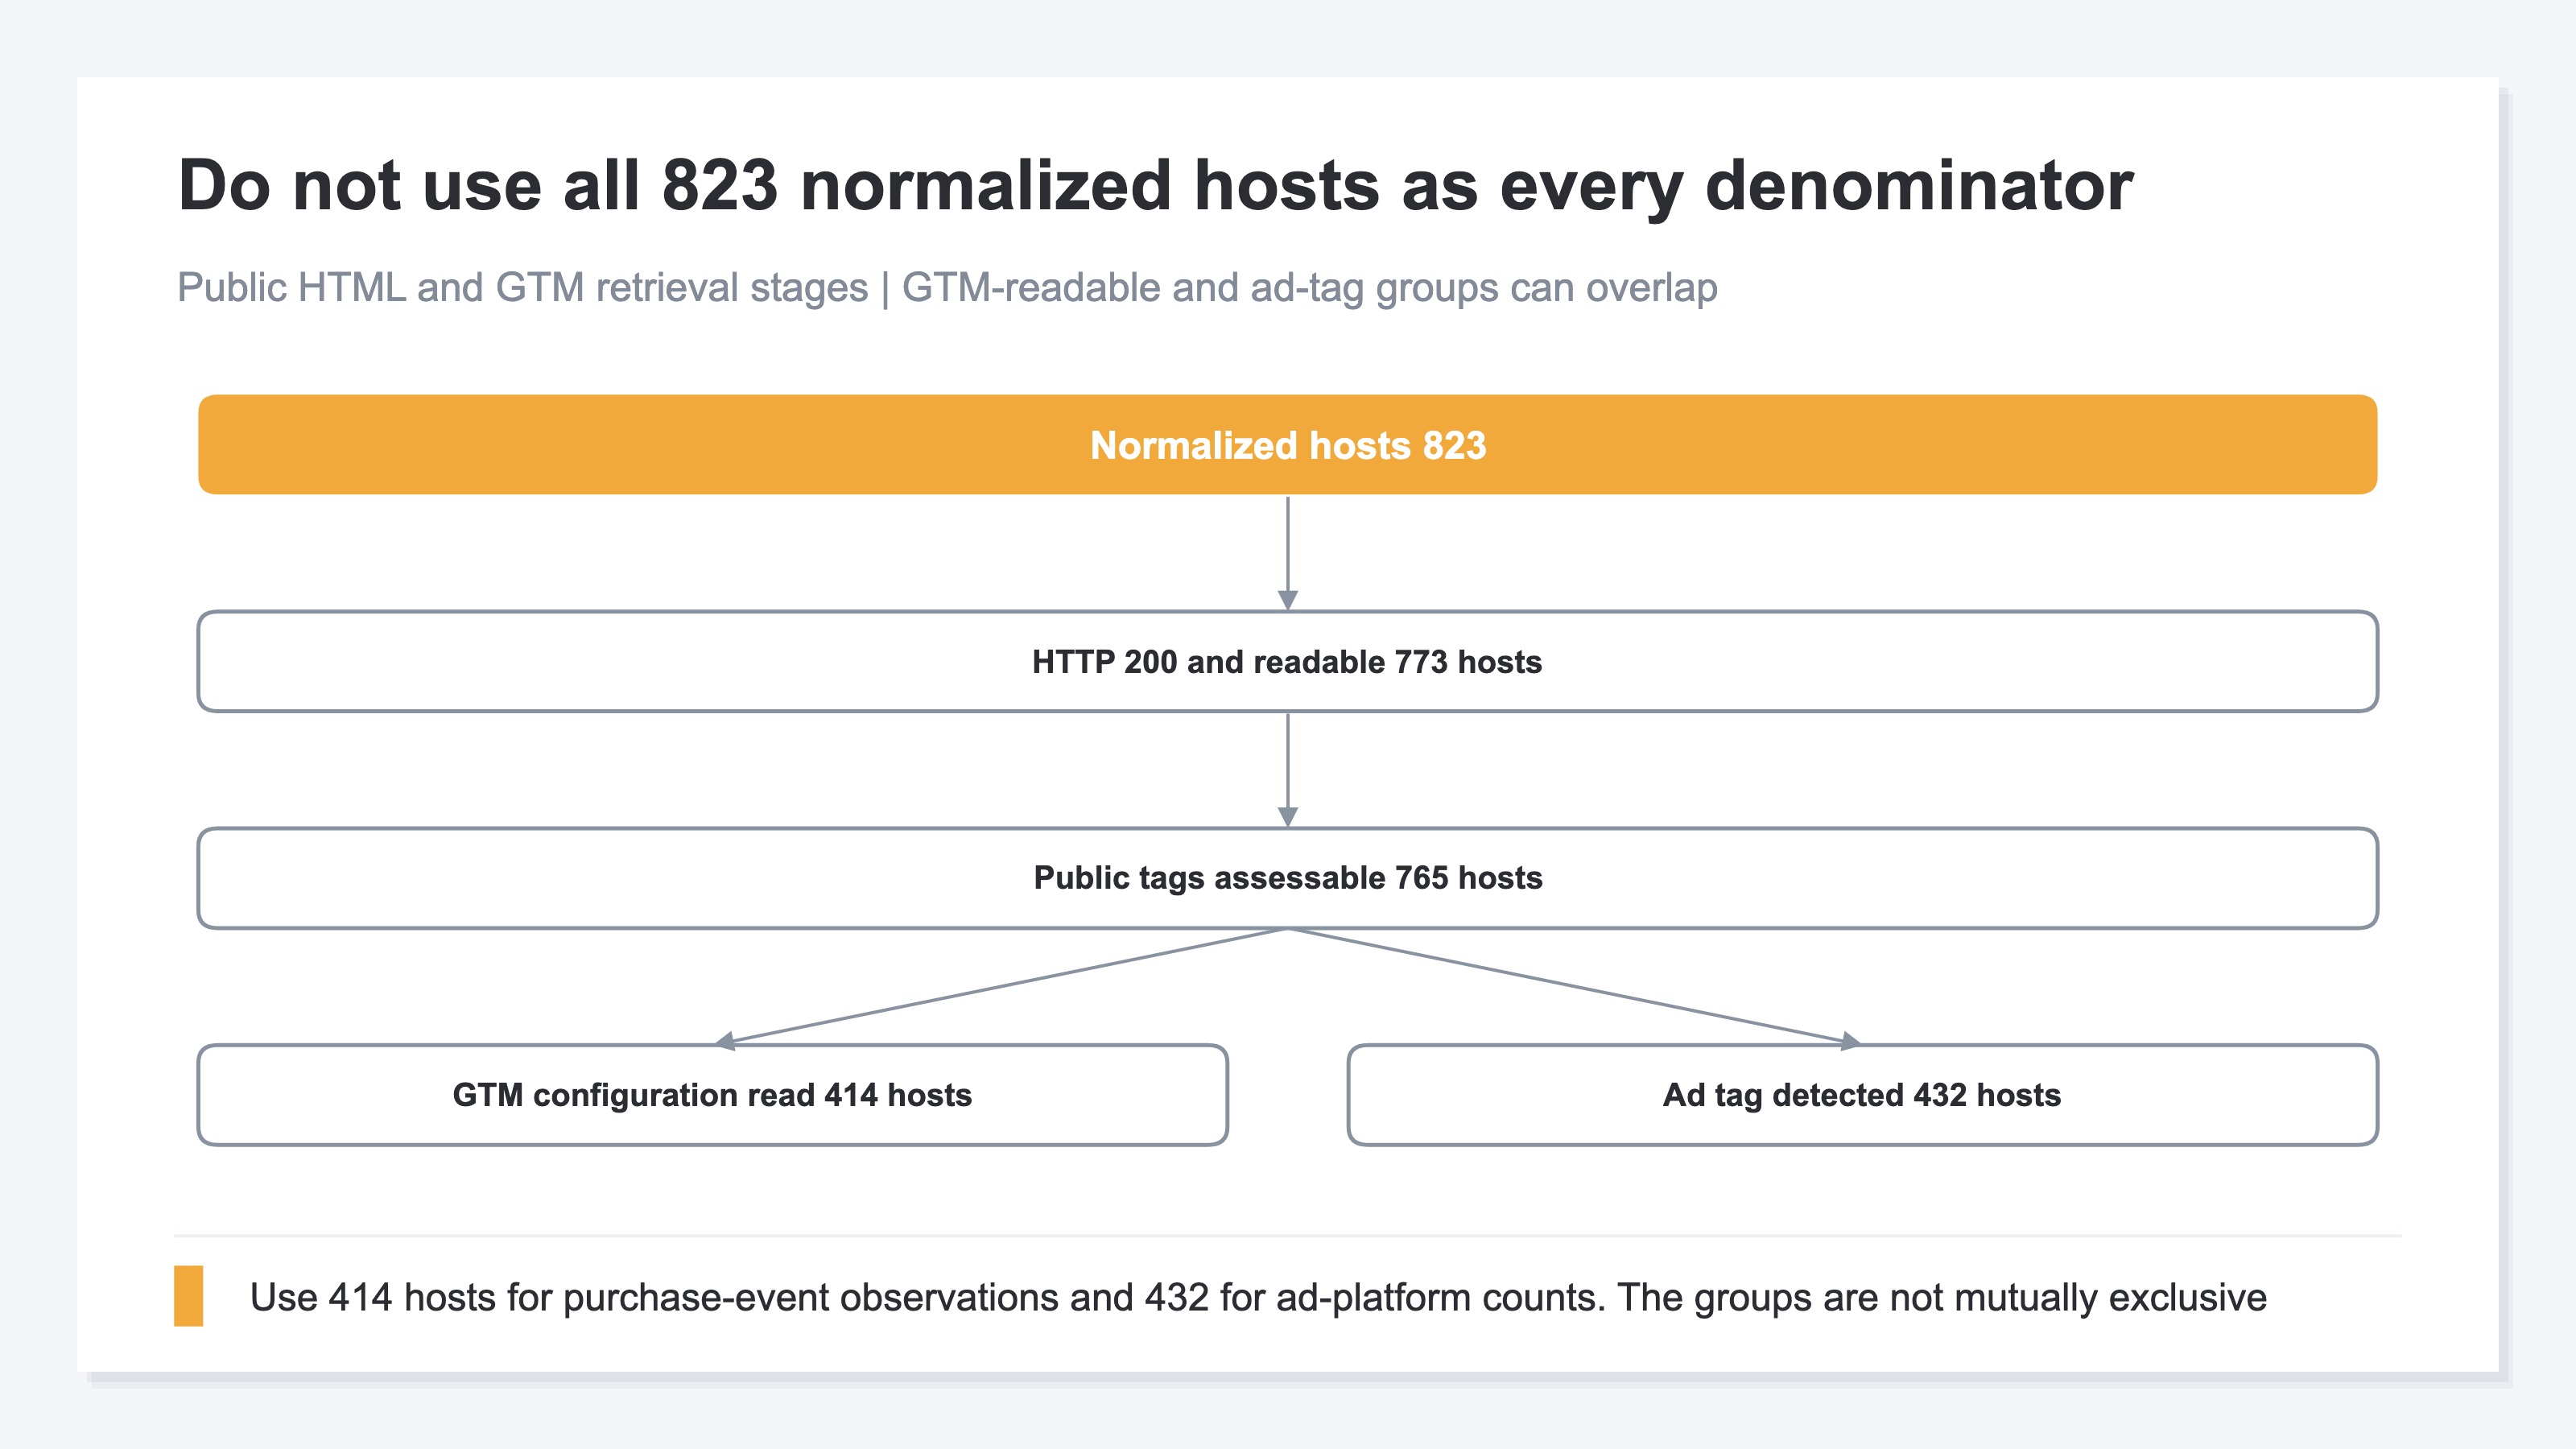
Two different denominators branch from the 765 assessable hosts. The 414 hosts whose public GTM configuration could be read form the denominator for examining purchase events. The 432 hosts where an ad tag was detected form the denominator for counting the number of ad platforms. These groups are not mutually exclusive, and they do not sum to 765.
The 414-host denominator excludes 25 hosts where a GTM container ID was visible but the container contents could not be read. Counting those hosts as having no purchase event would confuse an unobserved configuration with an absent event. Some hosts also failed because of the scanner's SSL connection rather than a problem on the merchant's site. Every percentage must therefore state whether its denominator is 765, 414, or 432.
Among the 414 readable GTM configurations, a purchase event appeared in 258/414, or 62%. The absence of a purchase event from a public GTM container is not evidence that the store measures no purchases. A cart's standard integration, a direct gtag.js implementation, or a thank-you-page implementation may not appear there.
2. Ad Tags Appeared on 56% of the 765 Assessable Hosts#
Among the 765 assessable hosts, 56% had at least one detectable ad tag.
The count was 432/765, or 56%. “Ad tag detected” means only that a relevant tag appeared in public HTML or a public GTM container. It does not prove that the company is currently running ads or that ad-driven revenue is measured correctly.
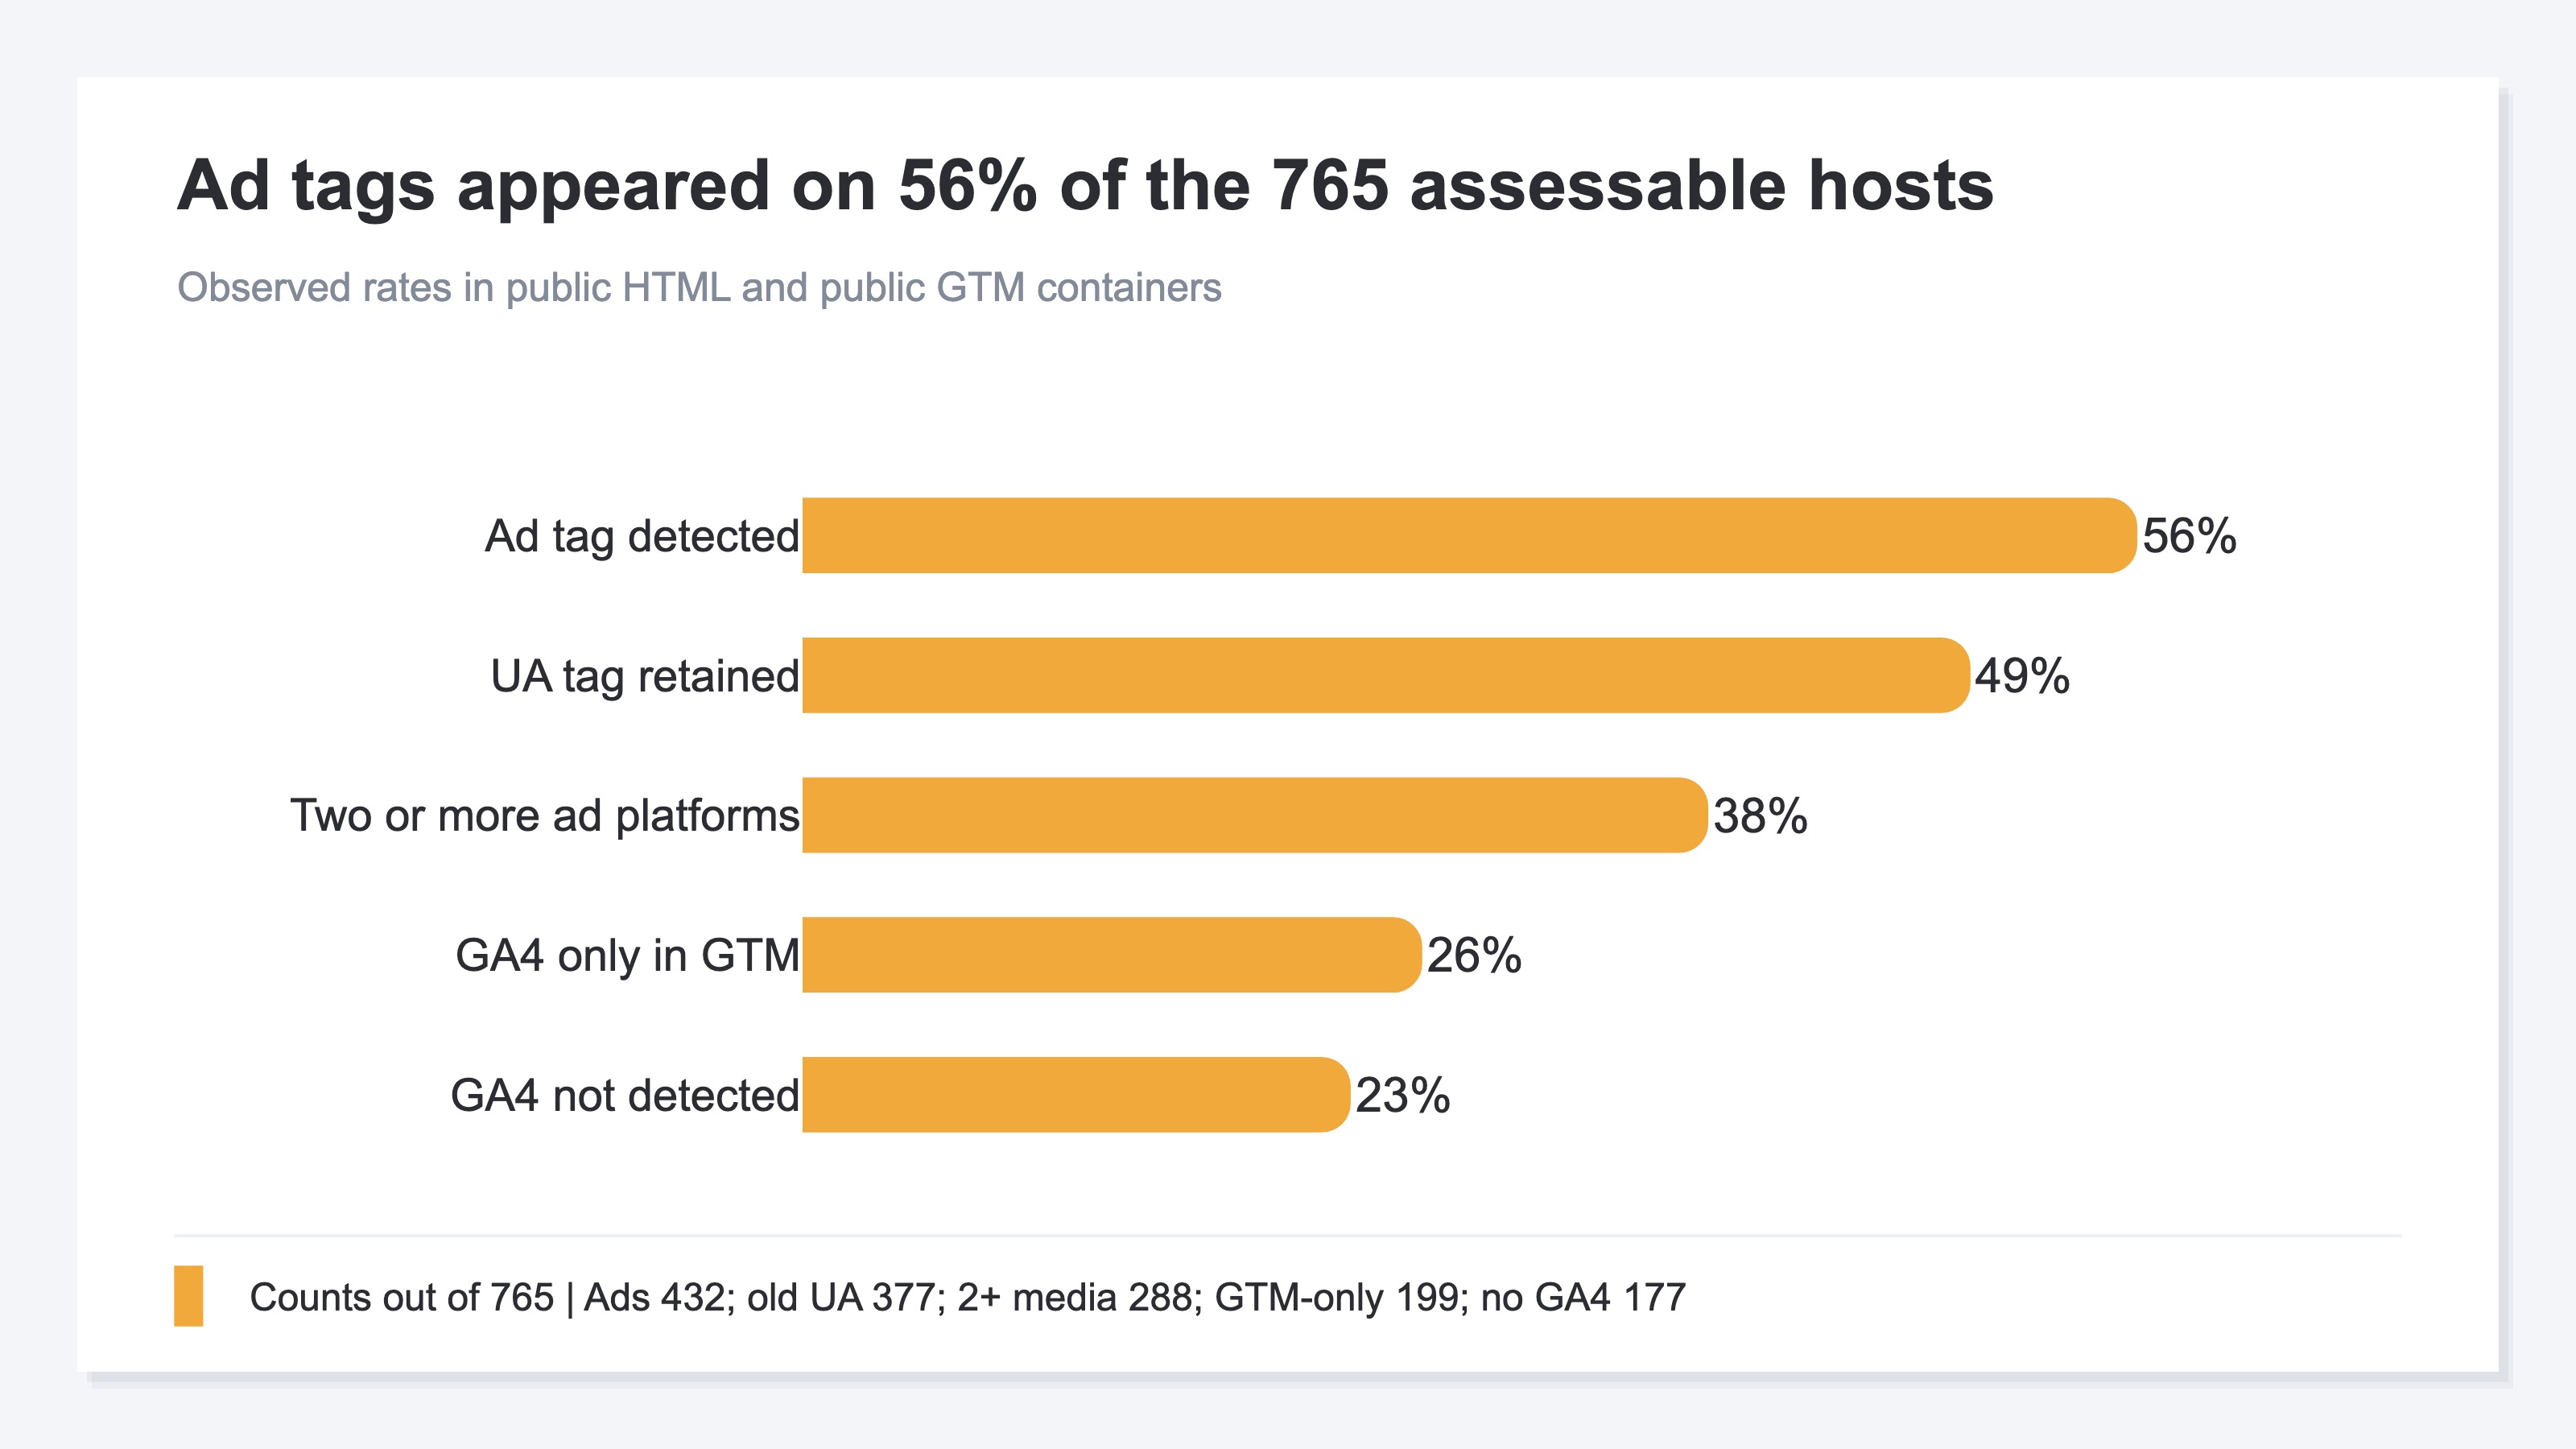
An old Universal Analytics (UA) tag remained visible on 377/765 hosts, or 49%. A retained tag is an observation in public code. It does not establish that the tag is still sending data or that an operator can use UA reports today.
No GA4 tag was detectable on 177/765 hosts, or 23%. “GA4 not detected” is not the same as “GA4 not installed.” Consent-gated loading, server-side measurement, or an implementation outside the scanner's view could produce the same observation.
GA4 appeared only inside GTM on 199/765 hosts, or 26%. Looking only at page HTML would miss this group. Conversely, seeing a GTM container does not establish that purchase events and revenue are sent correctly.
Tags from at least two ad platforms appeared on 288/765 hosts, or 38%. This 38% uses all 765 assessable hosts as the denominator. The 67% in the next section uses only the 432 hosts with an ad tag. Both percentages describe the same 288 hosts from different starting questions.
3. Among 432 Hosts With Ad Tags, 67% Had at Least Two Platforms#
Restricting the denominator to the 432 hosts with an ad tag, 67% had tags from at least two platforms.
The count was 288/432, or 67%. The remaining 144 hosts (144/432), or 33%, had one ad platform. Because one host can contain tags from several platforms, percentages for individual platforms would add to more than 100%. Multiple tags are a reason to examine how each platform assigns credit for a purchase.
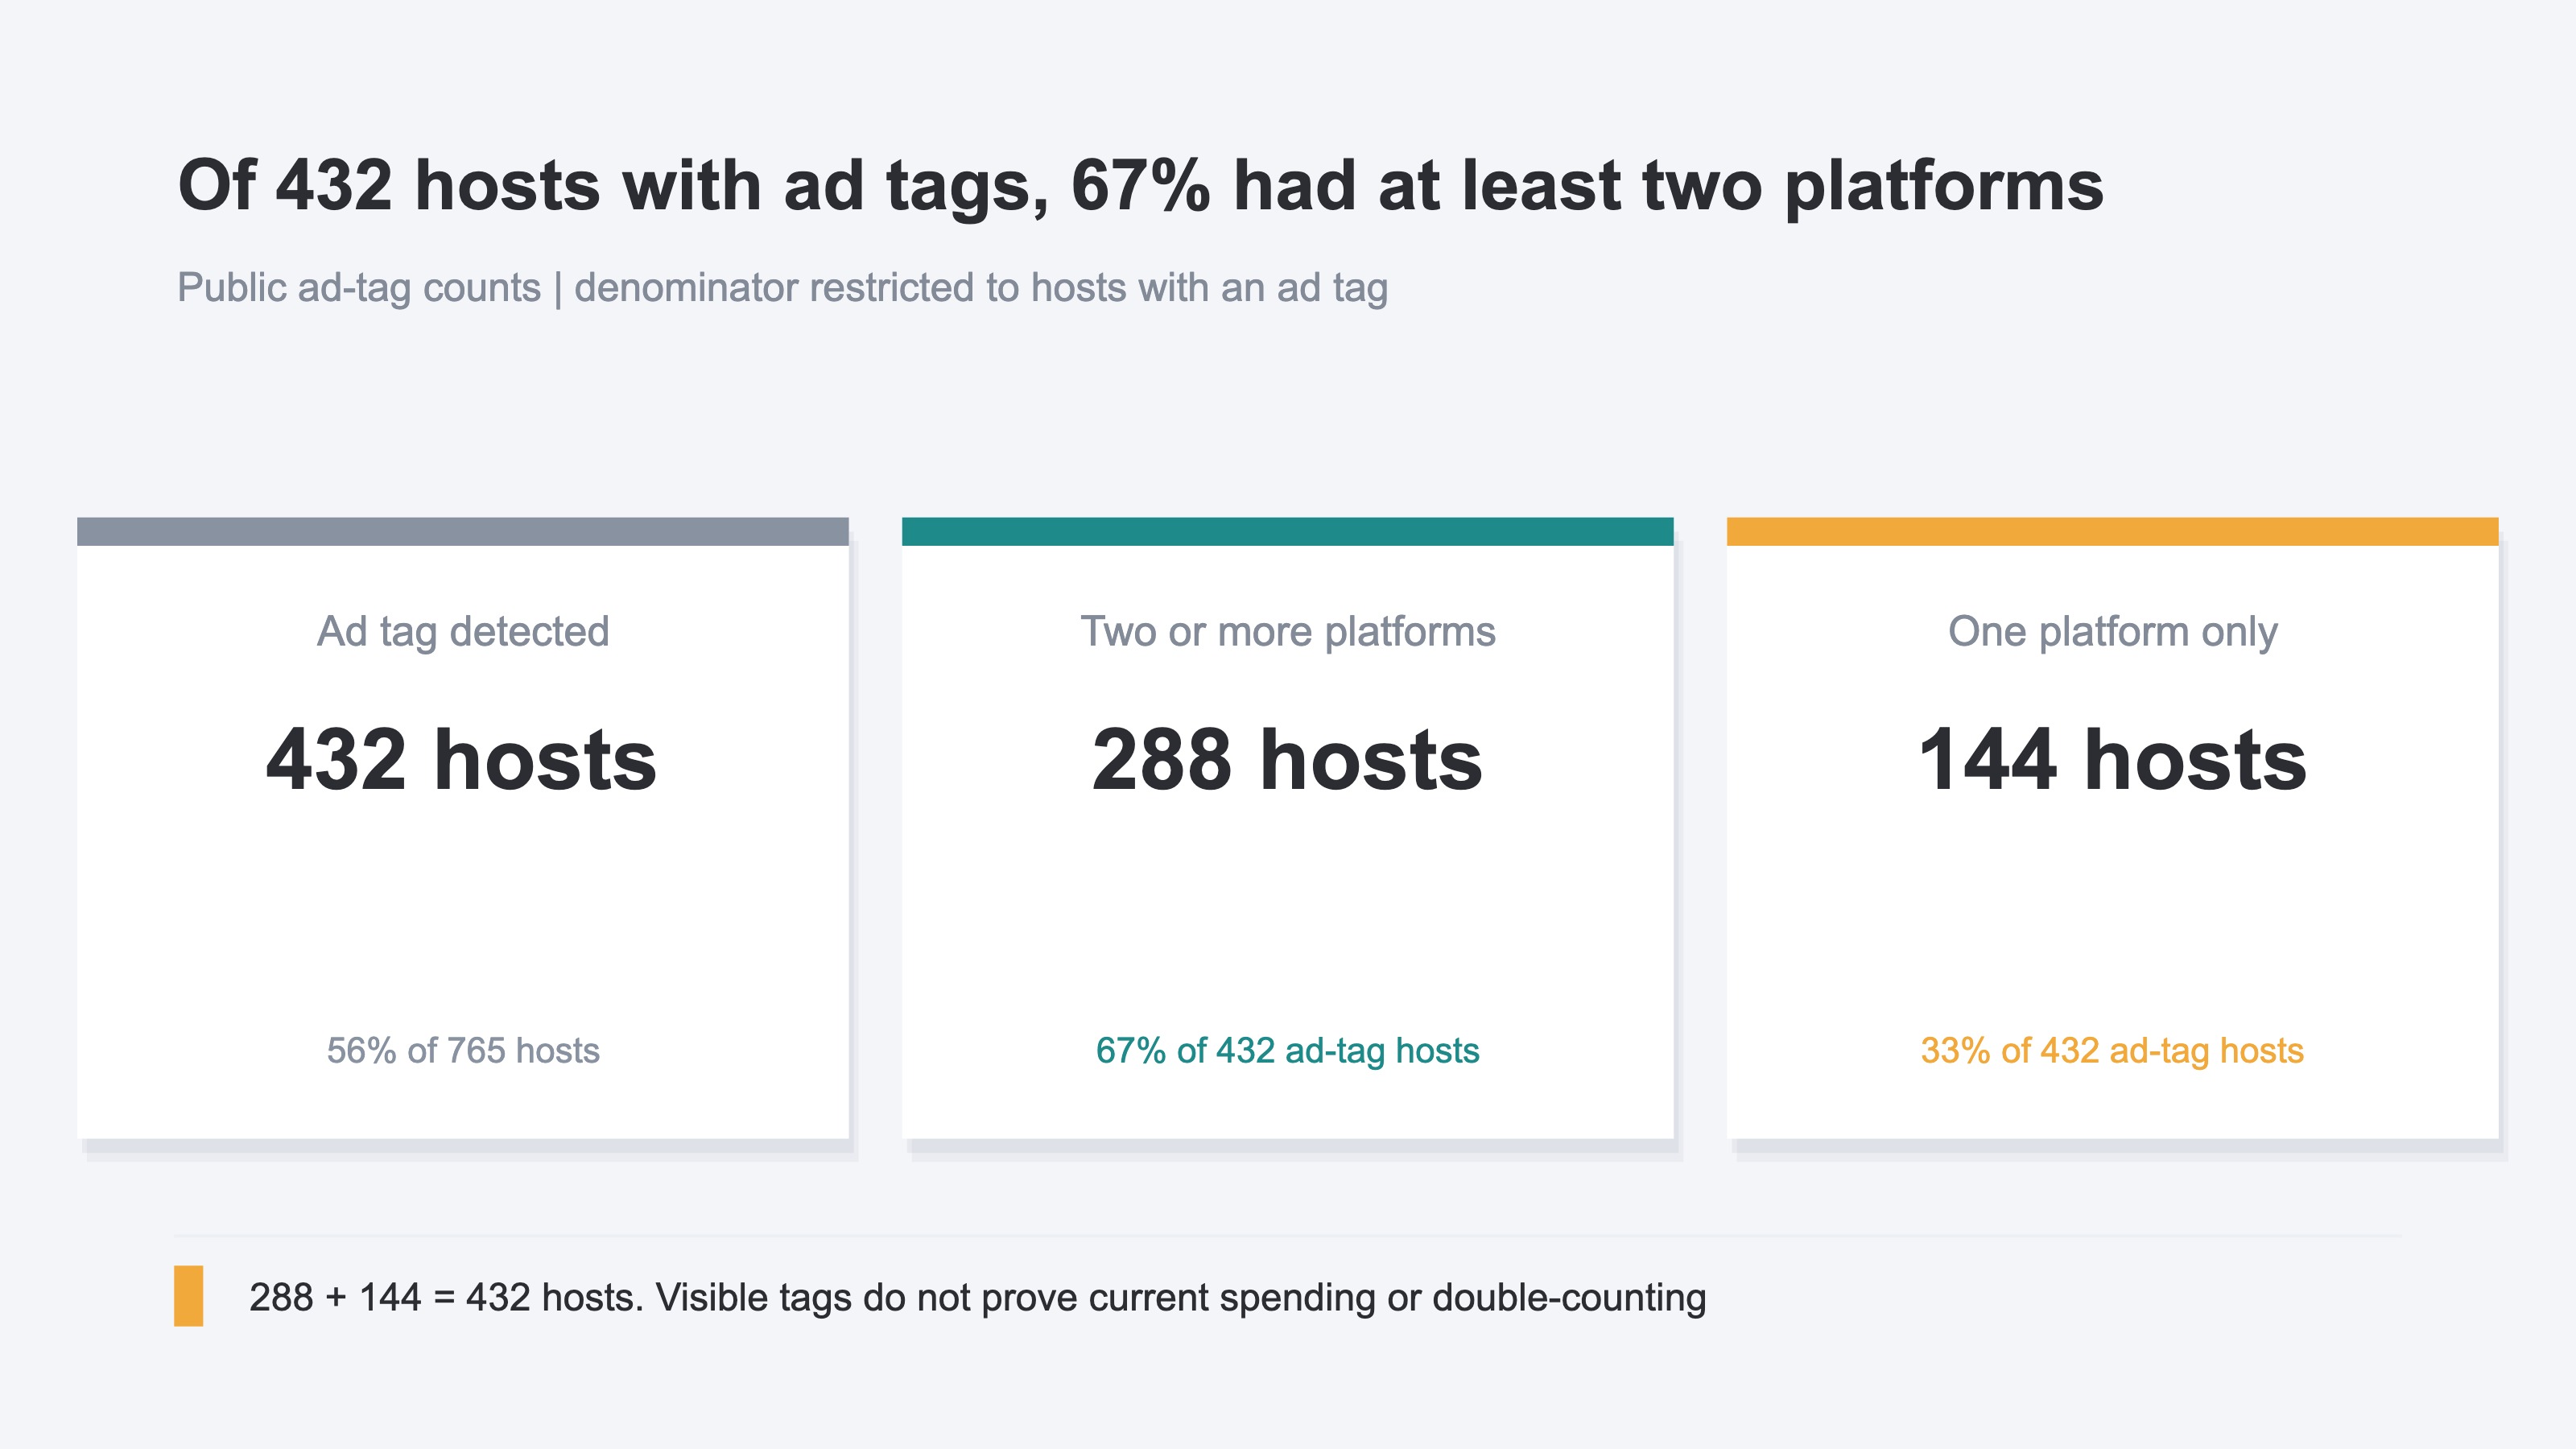
The presence of two tags does not prove that a purchase has been double-counted. That conclusion requires the firing conditions, order-ID deduplication, and each platform's attribution window. Why GTM can double-count purchases covers that mechanism separately.
The tag count is not a maturity score either. More tags do not necessarily mean better measurement, and fewer tags do not necessarily mean poorer measurement. A health check compares orders and measured conversions over the same period instead of ranking sites by tag count. See how to check ad-conversion measurement.
When several platforms are present, each advertising dashboard reports results under its own attribution rules. Adding every platform's claimed conversion value can count overlapping touchpoints as if each platform independently produced the full purchase. Platform ROAS and company-measured efficiency explains why the denominators and attribution rules must be separated.
Among the 432 observed hosts with an ad tag, 288 exposed tags from at least two platforms. This is not a target for the number of platforms a store should use. If a store currently runs multiple media channels, it should compare the revenue each channel produced over the same period instead of using tag count as the decision rule.
4. Move From Observed Tag Rates to Decisions Based on Your Own Revenue#
Whether to retain or revise a channel should be decided with the store's own channel revenue, not the tag rates in this observed group.
The 56% ad-tag rate and the 67% multi-platform rate are not pass-or-fail thresholds for an individual store. A high tag count among other merchants does not justify keeping budget in a channel that produces little revenue. A single-platform setup is not a problem by itself when that platform generates efficient sales.
The first three metrics to align are sessions, revenue, and Revenue Per Session (RPS) over the same period. RPS divides revenue by sessions, allowing traffic volume and sales output to be read on one scale. It separates a high-volume channel with weak sales from a channel that produces more revenue per visit.
Average Order Value (AOV) and conversion rate (CVR) add context when the order count is large enough. AOV is revenue divided by orders, while CVR is orders divided by sessions. RevenueScope shows “—” for channel-level AOV and CVR when the channel has fewer than 10 orders, avoiding a comparison in which one additional order would move the rate sharply.
Revenue attribution also changes by model. RevenueScope supports last touch, first touch, linear, and time decay. Compare channels within one model instead of mixing AOV under one model with CVR under another. Retargeting channels are especially sensitive to this choice; how to read Criteo results explains why last-touch credit can overstate one role.
Repeating the comparison manually requires the same channel names, period, bot exclusions, and attribution rules every time. How to choose an e-commerce analytics tool covers tool selection. The conclusion here is narrower: do not turn this group's tag rates into a target; compare the store's own channel revenue under a consistent measurement basis.
RevenueScope solution
RevenueScope displays the metrics needed to assess revenue for the site as a whole and by channel.
At the site level, RevenueScope shows revenue, sessions, RPS, AOV, and CVR for the same period. The channel breakdown shows sessions, revenue, RPS, orders, AOV, and CVR. AOV and CVR appear only for channels with at least 10 orders.
You can switch among last touch, first touch, linear, and time decay. Revenue, RPS, orders, AOV, and CVR are compared within the selected model. Revenue that cannot be assigned to a channel remains visible as Unattributed.
The public-tag study describes which measurement structures appeared in this observed group. RevenueScope brings the decision back to revenue measured on the store itself. The basis for a budget decision becomes the channels that produced sales, rather than the number of tags other sites happened to expose.
FAQ#
Frequently Asked Questions#
Q. Does this study represent all e-commerce businesses in Japan?
A. No. It covers normalized URL hosts for e-commerce sites that appeared near the top of searches for legally required merchant disclosures. Marketplace-only sellers and stores outside those results are not included.
Q. Does 23% with no detected GA4 mean that 23% had not installed GA4?
A. No. It means that no GA4 tag was found in the public HTML or public GTM container available to the scanner. Consent-gated loading, server-side measurement, and other implementations outside that view may be included.
Q. Does the 56% ad-tag rate show how many stores are currently advertising?
A. No. It shows where an ad tag was detectable in public code. A tag can remain after a campaign stops, so current spending must be checked separately.
Q. Does the 67% multi-platform rate mean that 67% double-count purchases?
A. No. It means that 288 of the 432 hosts with an ad tag had tags from at least two platforms. Double-counting requires separate evidence about firing rules, order IDs, and attribution settings.
Q. What should an individual store compare?
A. Compare sessions, revenue, and RPS by channel over the same period and under the same attribution model. Add AOV and CVR when order counts are sufficient, and decide based on revenue contribution rather than the number of tags.
Summary#
Of 823 normalized URL hosts for e-commerce sites extracted from search results, public tags could be assessed on 765. Among those 765 hosts, 56% had an ad tag (432/765), 49% retained an old UA tag (377/765), and 23% showed no detectable GA4 tag (177/765).
Among the 432 hosts with an ad tag, 67% had tags from at least two platforms (288/432). A visible tag does not prove current ad spend, successful measurement, or double-counting. Do not use this group's tag rates as a target; make decisions from channel revenue, sessions, and RPS measured over the same period and under the same attribution rules.
See which ads actually drive revenue, at a glance
Free up to 5,000 sessions/month, AI analyst included. No credit card required. Up and running in 5 minutes.
References#
No external references were used. The figures are RevenueScope's primary aggregation of public HTML and public GTM container observations collected from August 15 through 23, 2026.