As of June 2026, everything outside Google accounts for about 41% of Japan's search market. On desktop alone, Bing is nearly level with Google. Google Search Console, meanwhile, covers only Google search. As long as you judge SEO results by the numbers in Google Search Console, up to 40% of your search traffic goes uncounted.
Contents
TL;DR#
- Statcounter estimates put Japan (all devices) in June 2026 at Google 59.0%, Bing 33.1%, and Yahoo! 6.2%. Everything outside Google adds up to about 41%
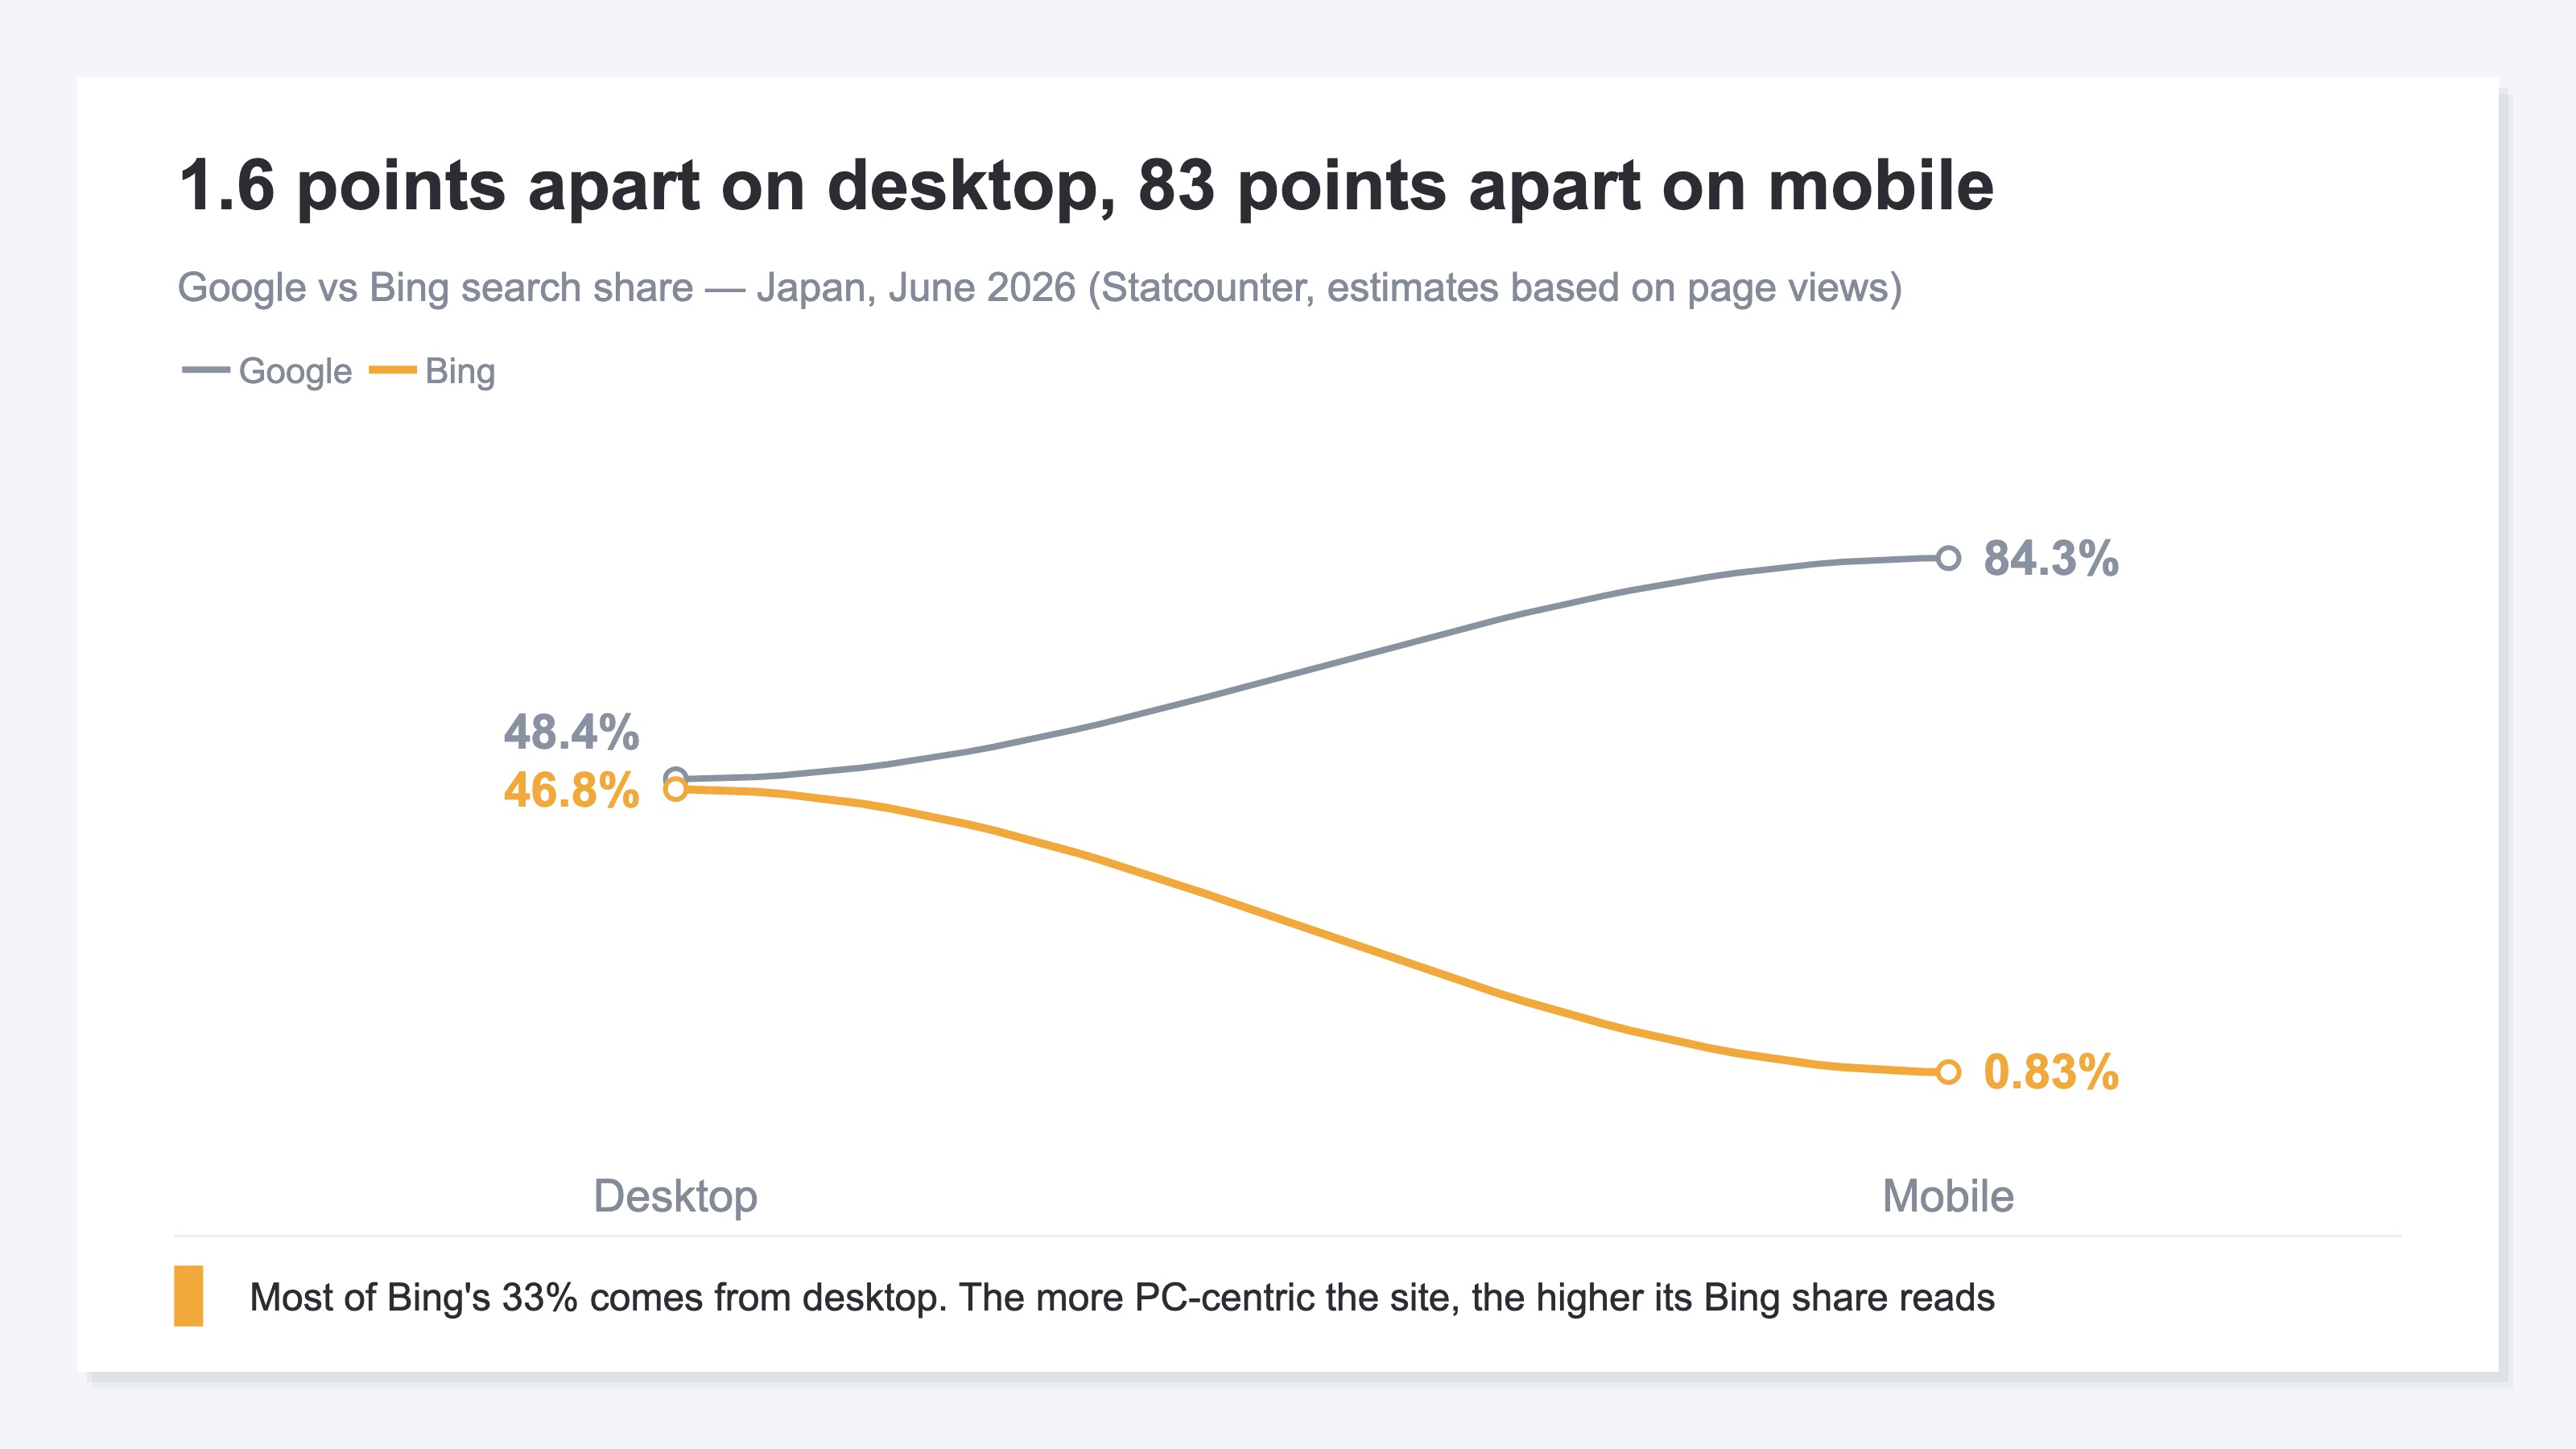
- On desktop alone it is Google 48.4% against Bing 46.8% — nearly level. On mobile Bing falls to 0.83%, and the runner-up is Yahoo! at 12.2%
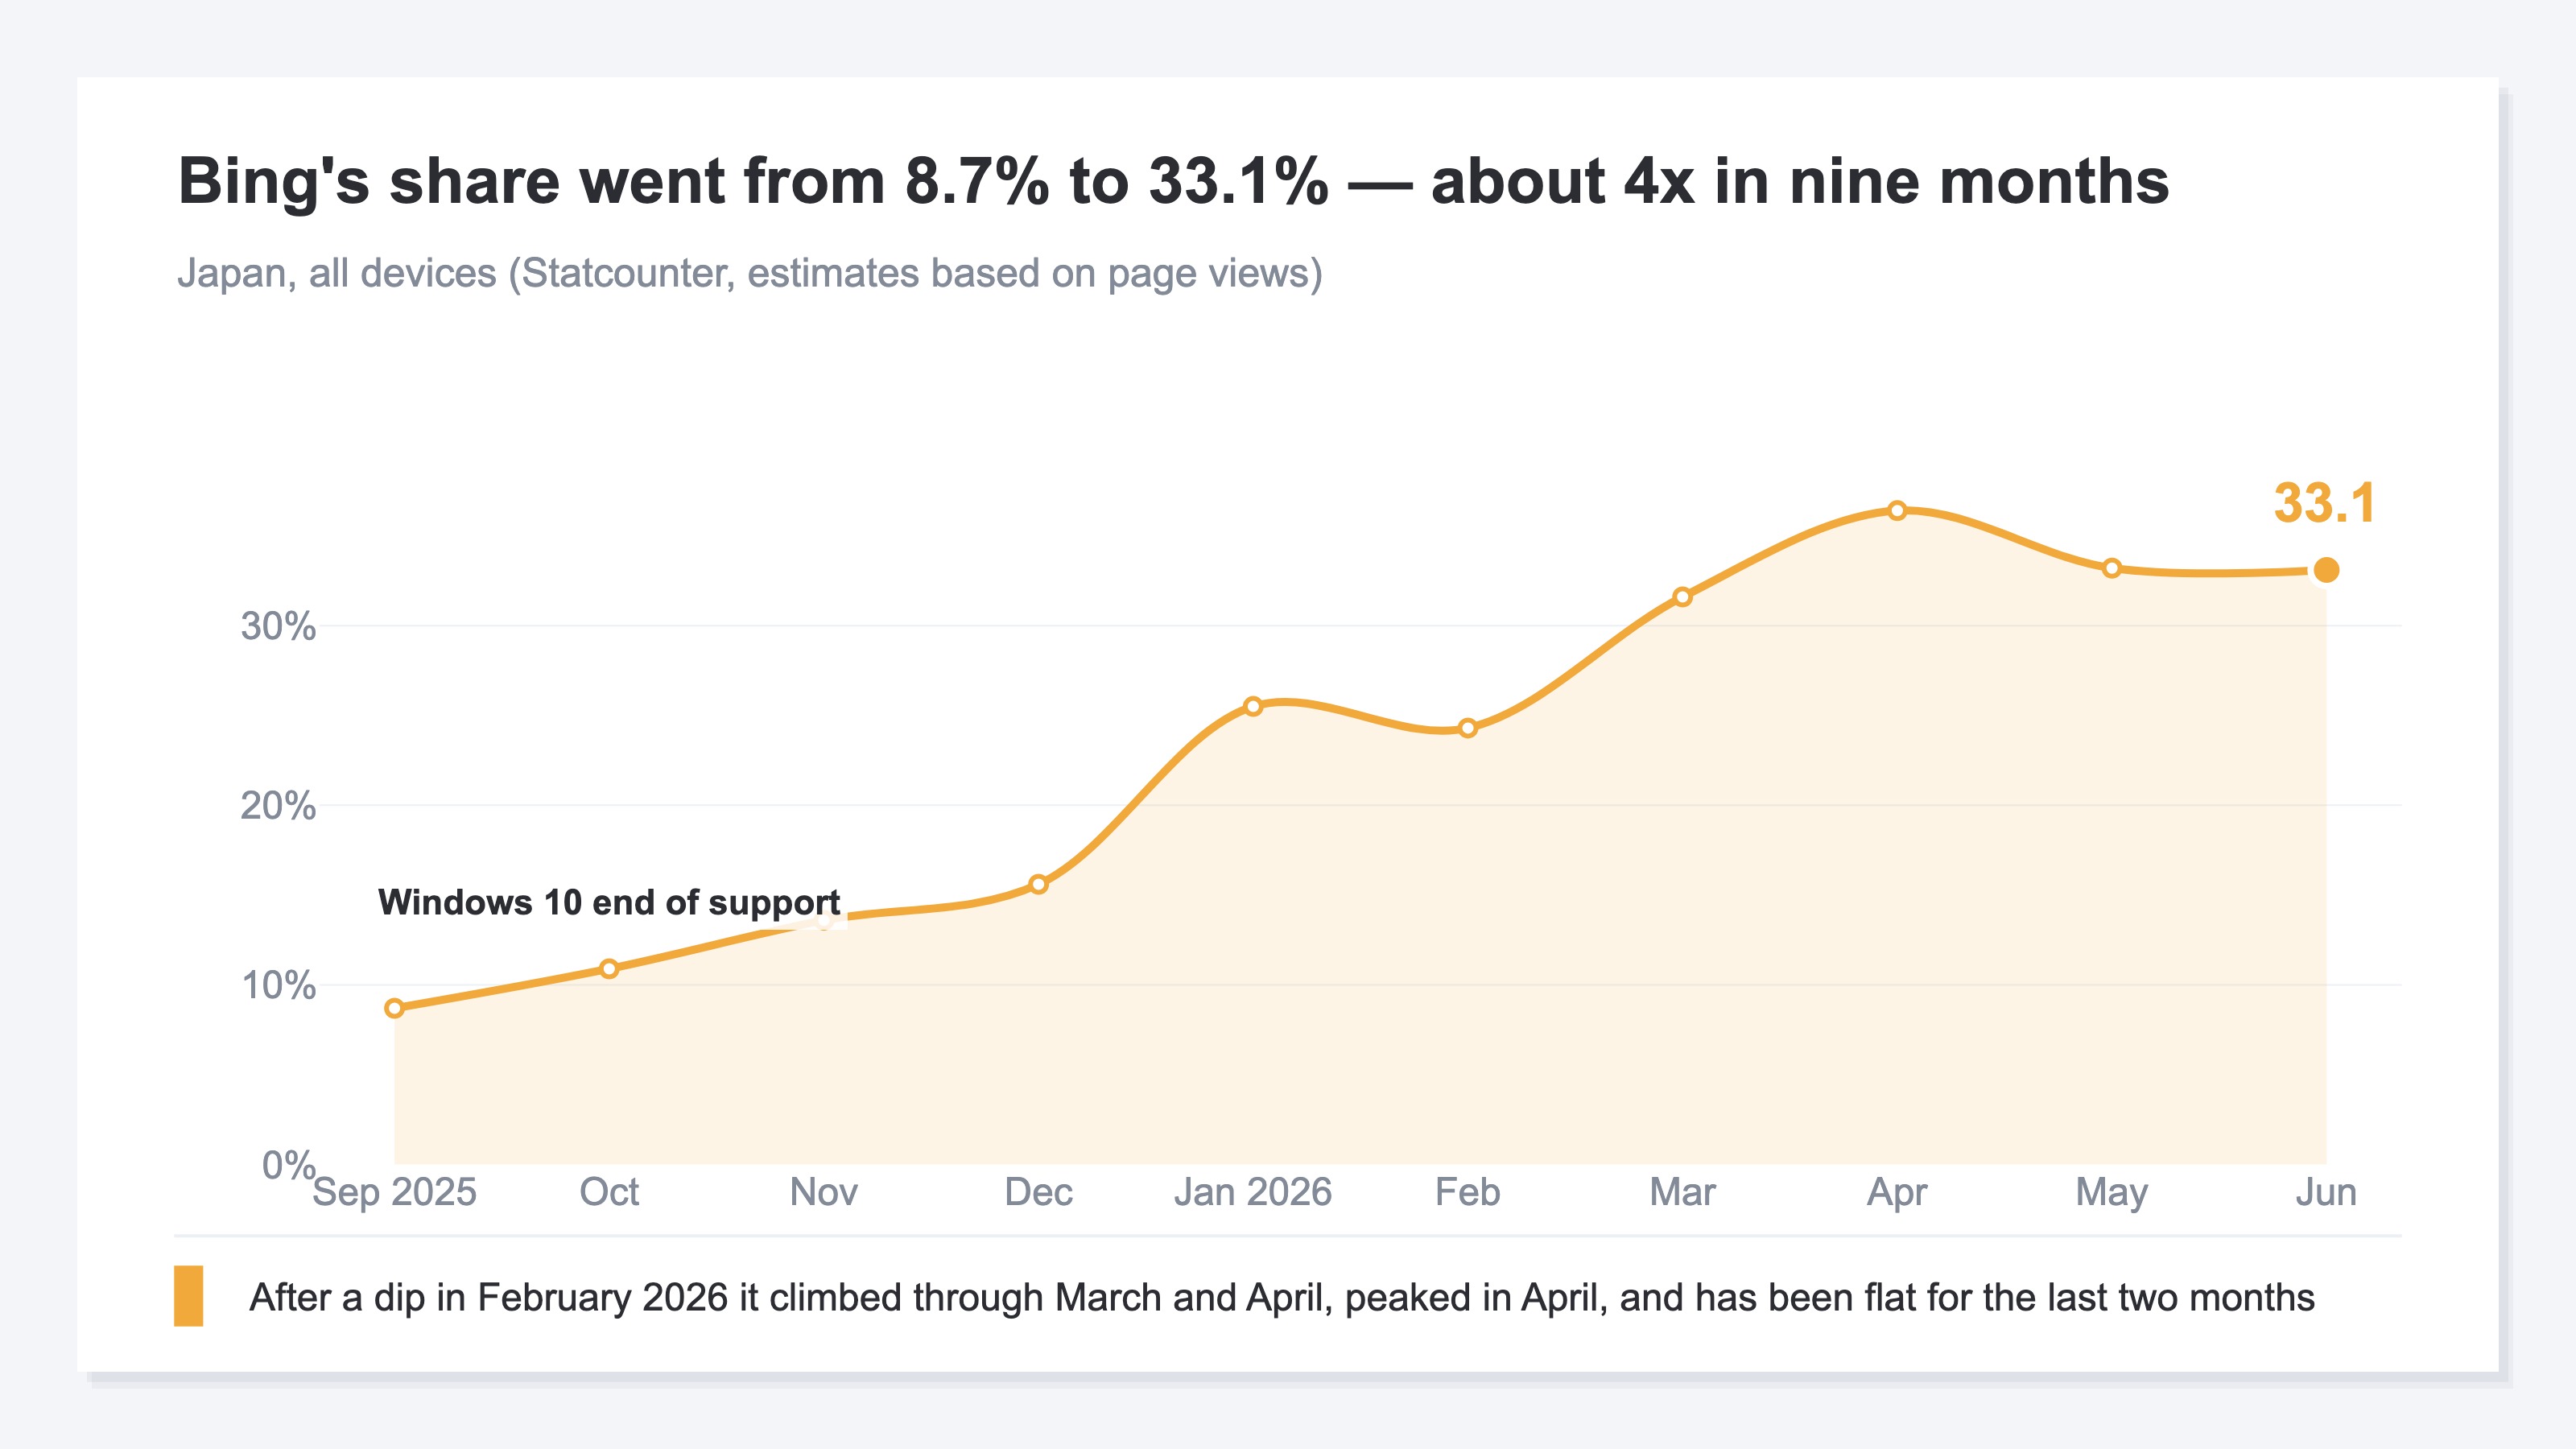
- Bing's surge began around the end of support for Windows 10 (October 2025), climbing from 8.7% to roughly 33%
- Google Search Console covers only Google search. Traffic from Bing and Yahoo! Search is absent there by structure, not because of a setting
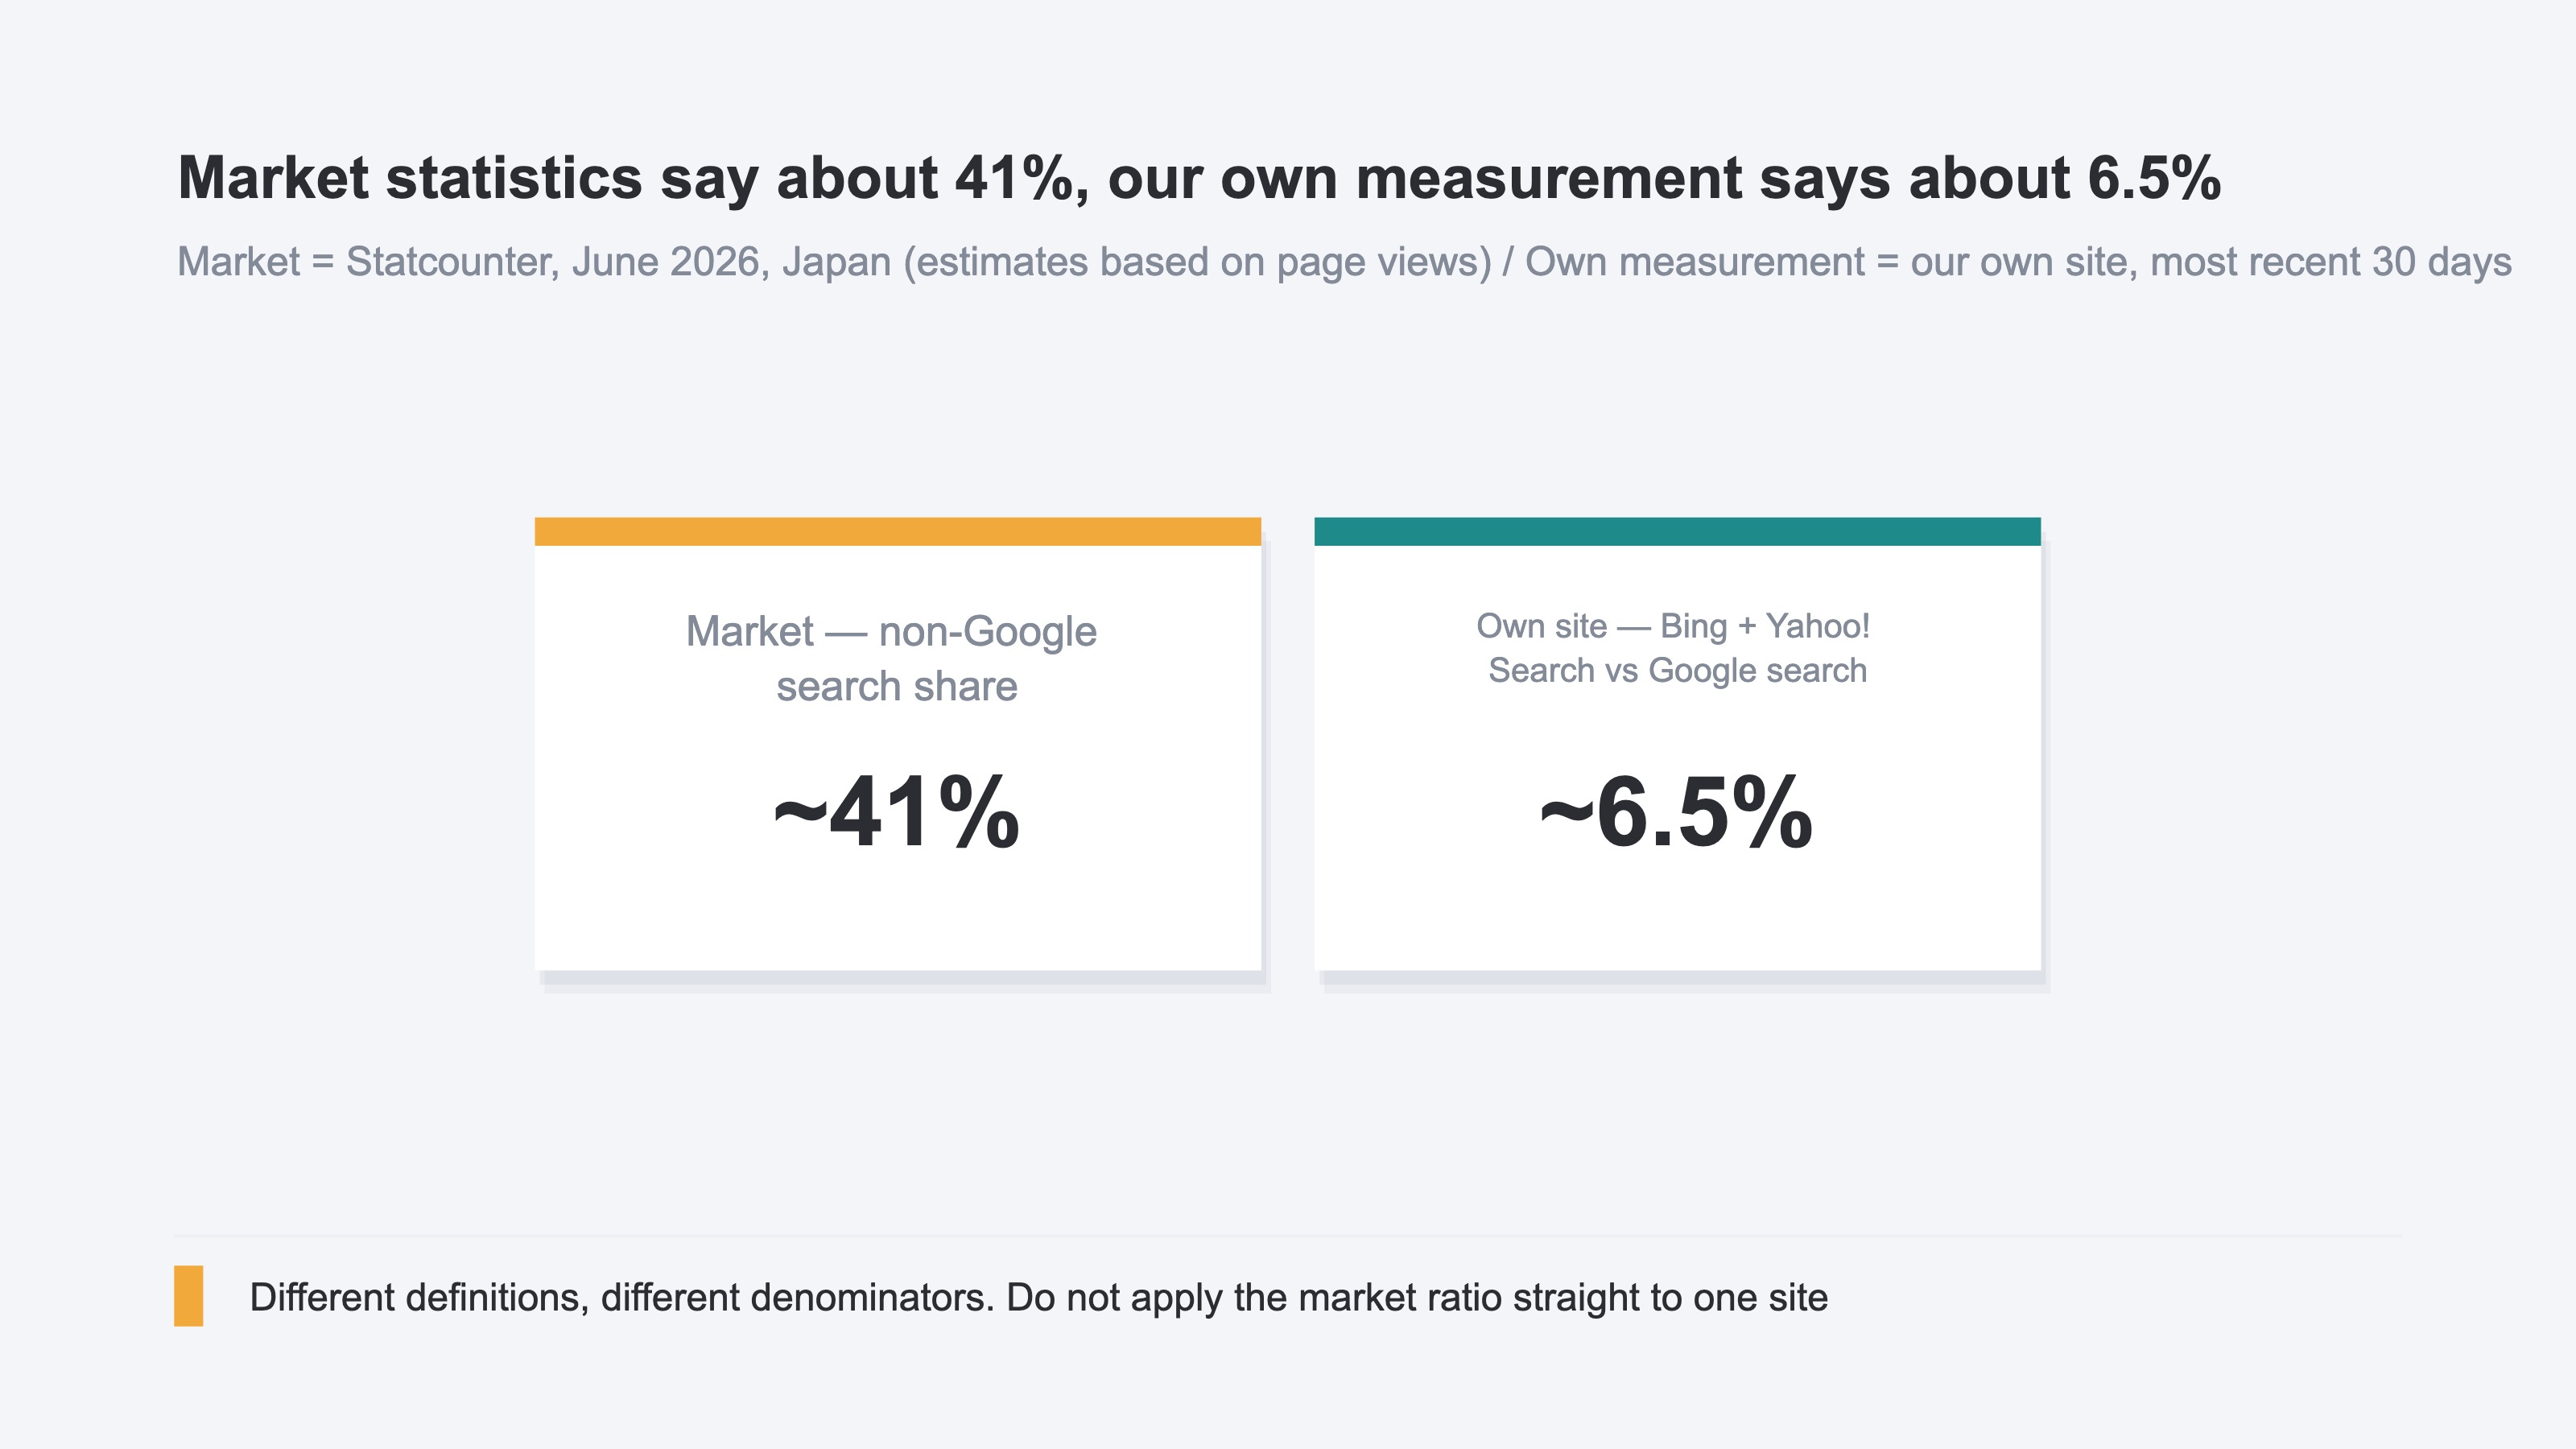
- Market-wide share and your own share are different things. On our own site over the most recent 30 days, Bing and Yahoo! combined came to about 6.5% of Google search
1. Japan's Search Share: Bing at 33%, Nearly Half on Desktop#
In June 2026, Japan's search share was Google 59.0%, Bing 33.1%, and Yahoo! 6.2%[1]. Those are all-device figures, and adding up everything outside Google gives about 41%.
Split by device and the picture changes. On desktop alone it is Google 48.4% against Bing 46.8%[2]. The gap is under two points, so on a PC, Bing sits essentially level with Google. On mobile, by contrast, Bing falls to 0.83%. Google takes 84.3% and the runner-up is Yahoo! at 12.2%, which means smartphone search is almost entirely Google and Yahoo![3].
In other words, most of Bing's 33% comes from desktop. The more a site's buyers shop from a PC, the higher its Bing share tends to read.
These figures are estimates based on page views, not a direct count of users[4]. Month-to-month swings run around three points: after a peak of 36.4% in April 2026, May came in at 33.2% and June at 33.1%, so the last two months have been flat. Figures can also be revised for 45 days after publication[4]. Read them as a rough range, not down to the decimal.
The Surge Lines Up With the End of Support for Windows 10#
The shape of the growth is distinctive too. Bing was at 8.7% in September 2025. From there it went 10.9%, 13.6%, 15.6%, and reached 25.5% in January 2026. February dipped to 24.3%, but March came in at 31.6% and April at 36.4%, with the most recent months around 33%. That is close to four times in nine months.
The period when this surge began overlaps with the end of support for Windows 10 (October 2025)[5]. That was when replacements and migrations put more Windows 11 machines in people's hands. It reads naturally that more people simply stayed with Microsoft Edge, the default browser, and with Bing, its default search engine. Matching timing is not proof of cause. But there is also nothing here to mark it as a temporary swing.
2. That Traffic Never Shows in Google Search Console#
Google Search Console covers only what happens in Google search. It is not a tool that looks at search as a whole.
Google's own documentation describes Google Search Console as showing a site's ranking and impressions in Google search results[6]. Turn that around: how often you appeared in Bing or Yahoo! Search results, and how many times you were clicked there, simply do not exist inside Google Search Console. It is not a setting problem and not a data delay — it sits outside the tool's scope.
This matters when SEO results are judged on "clicks in Google Search Console." Apply Japan's all-device mix straight across and about 40% of search traffic goes uncounted. On a desktop-heavy site, close to half can go unmeasured.
This Is Not the Query-Total Mismatch#
The point people usually raise about Google Search Console is that per-query clicks never add up to the overall total. That is about a gap inside Google search itself (anonymized queries), and it has its own causes and its own remedies (why Google Search Console clicks don't add up). What this article covers sits one layer further out: there are search engines Google Search Console never counted in the first place.
Tools That Help, and Where They Stop#
It is not that Bing's numbers are impossible to get. Bing Webmaster Tools shows impressions, clicks, and ranking in Bing search[7].
But what you learn stops at Bing-side search performance. How many orders followed, and how much revenue was booked, are not there. And because Google Search Console and Bing Webmaster Tools are separate tools, every month means opening two screens, lining up the date ranges, and adding things together by hand.
Another route is to look at source/medium in GA4 and split google, bing, and yahoo apart. The standard reports do not offer that shape, though, so you rebuild an exploration every time. Connecting it to revenue or RPS (revenue per session) by search engine is not offered as standard either. On top of that, visits whose source is missing get mixed into Direct, so they drop out without being counted as search at all (why traffic lands in Direct).
3. Check Your Own Bing Share#
Market-wide share and one site's share are different things.
When we measured our own site, search sessions from Bing and Yahoo! combined came to about 6.5% of Google search over the most recent 30 days. That is a wide gap from the roughly 41% in the market statistics.
There are reasons for the difference. The mix of search engines shifts a lot with the industry, the devices readers use, and the nature of the keywords in play. A site whose readers research from a work PC will read a higher Bing share; an EC site whose buyers are mostly on smartphones will read lower. Market statistics cannot tell you which of the two a site is closer to.
So "Japan is at 33%, so we must have about 30% too" and "we don't even have 10%, so we can ignore it" are both judgments that rest on no measurement. What is needed is to split the site's own search sessions by search engine and get the ratio. That alone gives you the footing to decide whether Bing is worth the effort.
Look at it as a trend over several months, not a single month's snapshot. The market side moved nearly fourfold in nine months, so leaving last year's ratio in place will pull the judgment off course. Where search sits among the channels as a whole is covered in comparing EC acquisition channels by revenue.
4. Judge Bing Traffic by Whether It Sells#
Once the ratio is out, the next thing to look at is not the volume of traffic but the revenue per session.
RPS (revenue per session) is revenue divided by session count. It expresses the quality of the traffic, not its quantity.
Break RPS out by search engine and the judgment can flip. Say Bing accounts for only 10% of search sessions: if its RPS runs higher than Google search, its contribution to revenue is larger than that 10%. Conversely, even at 30%, if RPS is low it can wait. Look only at the share of traffic and that distinction never appears.
Cross-checking rank and traffic reports against revenue is covered in auditing an SEO vendor's report against revenue, and deciding the order of investment by RPS is covered in SEO or paid search first.
The problem is the effort of producing this per-search-engine RPS every month. Rebuild the GA4 exploration, line up the Google Search Console and Bing Webmaster Tools numbers, tie them back to revenue. Try it once and no single step turns out to be hard. What is heavy is repeating it every month in the same shape.
RevenueScope solution
RevenueScope displays revenue by search engine on one screen. Its channel classification separates Google search, Bing, Yahoo! Search, and Direct out of the box. On top of that, it shows sessions, revenue, and RPS for each in the same table. Traffic from Bing and Yahoo! Search — which Google Search Console never covers — enters that same table as visits received on the site side. There is no need to open two admin screens each month and reconcile them by hand.
What the AI Assistant Returns#
Connect RevenueScope to ChatGPT or Claude and the AI reads the EC site's data directly and answers. This search-engine revenue check needs neither a complex setup nor SQL. Ask it to break out revenue and RPS by search engine and it comes back in a shape like this.
For illustration, written out with a fictional Store C where the Bing share reads on the high side, it looks like this.
| Channel | Session share | Revenue share | RPS |
|---|---|---|---|
| Google search | 55% | 50% | ¥180 |
| Bing | 22% | 28% | ¥250 |
| Yahoo! Search | 5% | 6% | ¥210 |
| Direct | 7% | 7% | ¥180 |
Figures for a fictional Store C written for illustration, pulling out only the search engines and Direct. The demo runs on the sample store's data (a fictional site with sample data, updated daily), so both the order of the channels and the ratios will look different.
The column to watch is RPS. Bing is at ¥250, above Google search's ¥180. It accounts for about a quarter of search sessions, but close to a third of search-driven revenue. A channel that would have been put off if only traffic volume were in view turns out, in revenue terms, to be the one to work on first. That column does not exist on the Google Search Console screen at all.
FAQ#
Frequently asked questions#
Q. Can I change a setting in Google Search Console and see Bing's numbers?
A. No. Google Search Console's scope is limited to performance in Google search[6]. Impressions and clicks on the Bing side are checked in a separate tool, Bing Webmaster Tools[7]. Both are search-side numbers, though; neither tells you how much revenue followed.
Q. Does Bing need separate SEO work?
A. This article stays on measurement, so it does not go into what that work would be. Bing's own guidance is published as the Bing Webmaster Guidelines, so check there first before starting[7]. That said, whether to spend time on it at all is a decision that comes after seeing how much Bing traffic and revenue the site actually has.
Q. Should our site have 30% coming from Bing too?
A. There is no way to know. Market statistics are an average for Japan as a whole. On our own site, Bing and Yahoo! combined came to about 6.5% of Google search. It shifts a lot with industry and device mix, so there is nothing for it but to look at the measurement for the site itself.
Q. How should traffic from Yahoo! Search be treated?
A. Count it as a channel separate from Google search. Visits via Yahoo! Search do not appear in Google Search Console either, so folding them in without distinction means overstating what Google search delivered. Its share in Japan was 6.2% in June 2026 across all devices. Together with Bing's 33.1%, about 39% of search comes through engines that never show in Google Search Console[1].
Summary#
Japan's search share changed shape over these nine months. Bing went from 8.7% in September 2025 to 33.1% in June 2026. On desktop it is nearly level with Google, and the period when the growth started overlaps with the end of support for Windows 10. Because Google Search Console covers only Google search, as long as SEO results are judged on clicks there, that growth stays outside what gets evaluated. Add Bing Webmaster Tools and what you learn still stops at search-side impressions and clicks.
At the same time, applying the market's 41% straight to one site is the same kind of mistake. What we measured on our own site was far from the market statistics. The first move is not Bing tactics but splitting the site's own search sessions by search engine and getting the ratio and the RPS. Deciding where to put your hands comes after that.
See which ads actually drive revenue, at a glance
Free up to 5,000 sessions/month, AI analyst included. No credit card required. Up and running in 5 minutes.
References#
- [1] Statcounter Global Stats "Search Engine Market Share Japan" (2026)
- [2] Statcounter Global Stats "Search Engine Market Share Japan (Desktop)" (2026)
- [3] Statcounter Global Stats "Search Engine Market Share Japan (Mobile)" (2026)
- [4] Statcounter Global Stats "FAQ" (2026)
- [5] Microsoft "Windows 10 end of support" (2026)
- [6] Google Search Console Help "Search performance report" (2026)
- [7] Bing Webmaster Tools "Webmaster Guidelines" (2026)