"Attach your data to ChatGPT and it'll draw the chart for you." When people say they make charts with AI today, this "attaching" is what they mean. A figure does appear in an instant. But that figure is out of date the moment you make it, and next month you repeat the same work all over again. This piece works through what "handing the data over" versus "letting AI read the data" actually decides when you leave charting to AI, and what changes once you let it read the always-current trend — using real data from a sample EC store.
Contents
TL;DR#
-
Charting with AI has come to mean "attaching a file"
Attach a CSV or a screenshot to AI and a figure comes back in an instant. The convenience is real, but what you get is a still image, frozen at the numbers from the moment you handed it over.
-
A chart made this way is out of date the moment you make it
The numbers you hand over freeze right there. Next month you attach again, and you can't pull the trend behind them — how things moved afterward.
-
Don't hand the data over — let AI read it. AI draws; what you hand over is the latest numbers
Drawing the chart is the work of the AI client (ChatGPT or Claude). Connect it read-only and AI reads the always-current trend directly, drawing it and returning what went up and why.
-
Charting is only the doorway to a decision
You don't stop at making the figure. Only once AI reads the always-current trend can you carry the conversation through to "where did it rise / why." Work turns into a decision.
1. Charting With AI Has Come to Mean "Attaching a File"#
Bottom line: making a chart with AI today mostly means "attaching a file." Hand AI the table or screenshot on your desk and a plausible figure comes back in an instant. The convenience is real. But this "attaching" hides one assumption that bites later: what you're handing over is only the numbers from the moment you handed it over.
What's happening is simple. You take a table exported from a GA4 exploration report [1], or a screenshot of an admin screen, and attach it to AI. AI tidies it into a bar chart or a line. As an entry point to analysis, that's not a bad thing at all. The problem is that the table you handed over is complete in that one sheet. What AI sees is the snapshot from the moment you handed it over. How the numbers moved up to last week, and how they've changed between then and today, aren't inside that table.
So a figure made by "attaching" is close to a one-time photograph. The way to compare ad performance is laid out in the limits of ad analysis in ChatGPT, and the very first step of connecting your own numbers to AI is collected in EC AI adoption starts with connecting your data.
2. A Chart Made This Way Is Out of Date the Moment You Make It#
Bottom line: the weakness of a chart made this way isn't the effort. It's that it goes out of date the moment you make it. The numbers you hand over freeze there, and next month you attach the same thing again. And because you handed over only that one round of numbers, you can't pull the trend behind them — how things moved afterward.
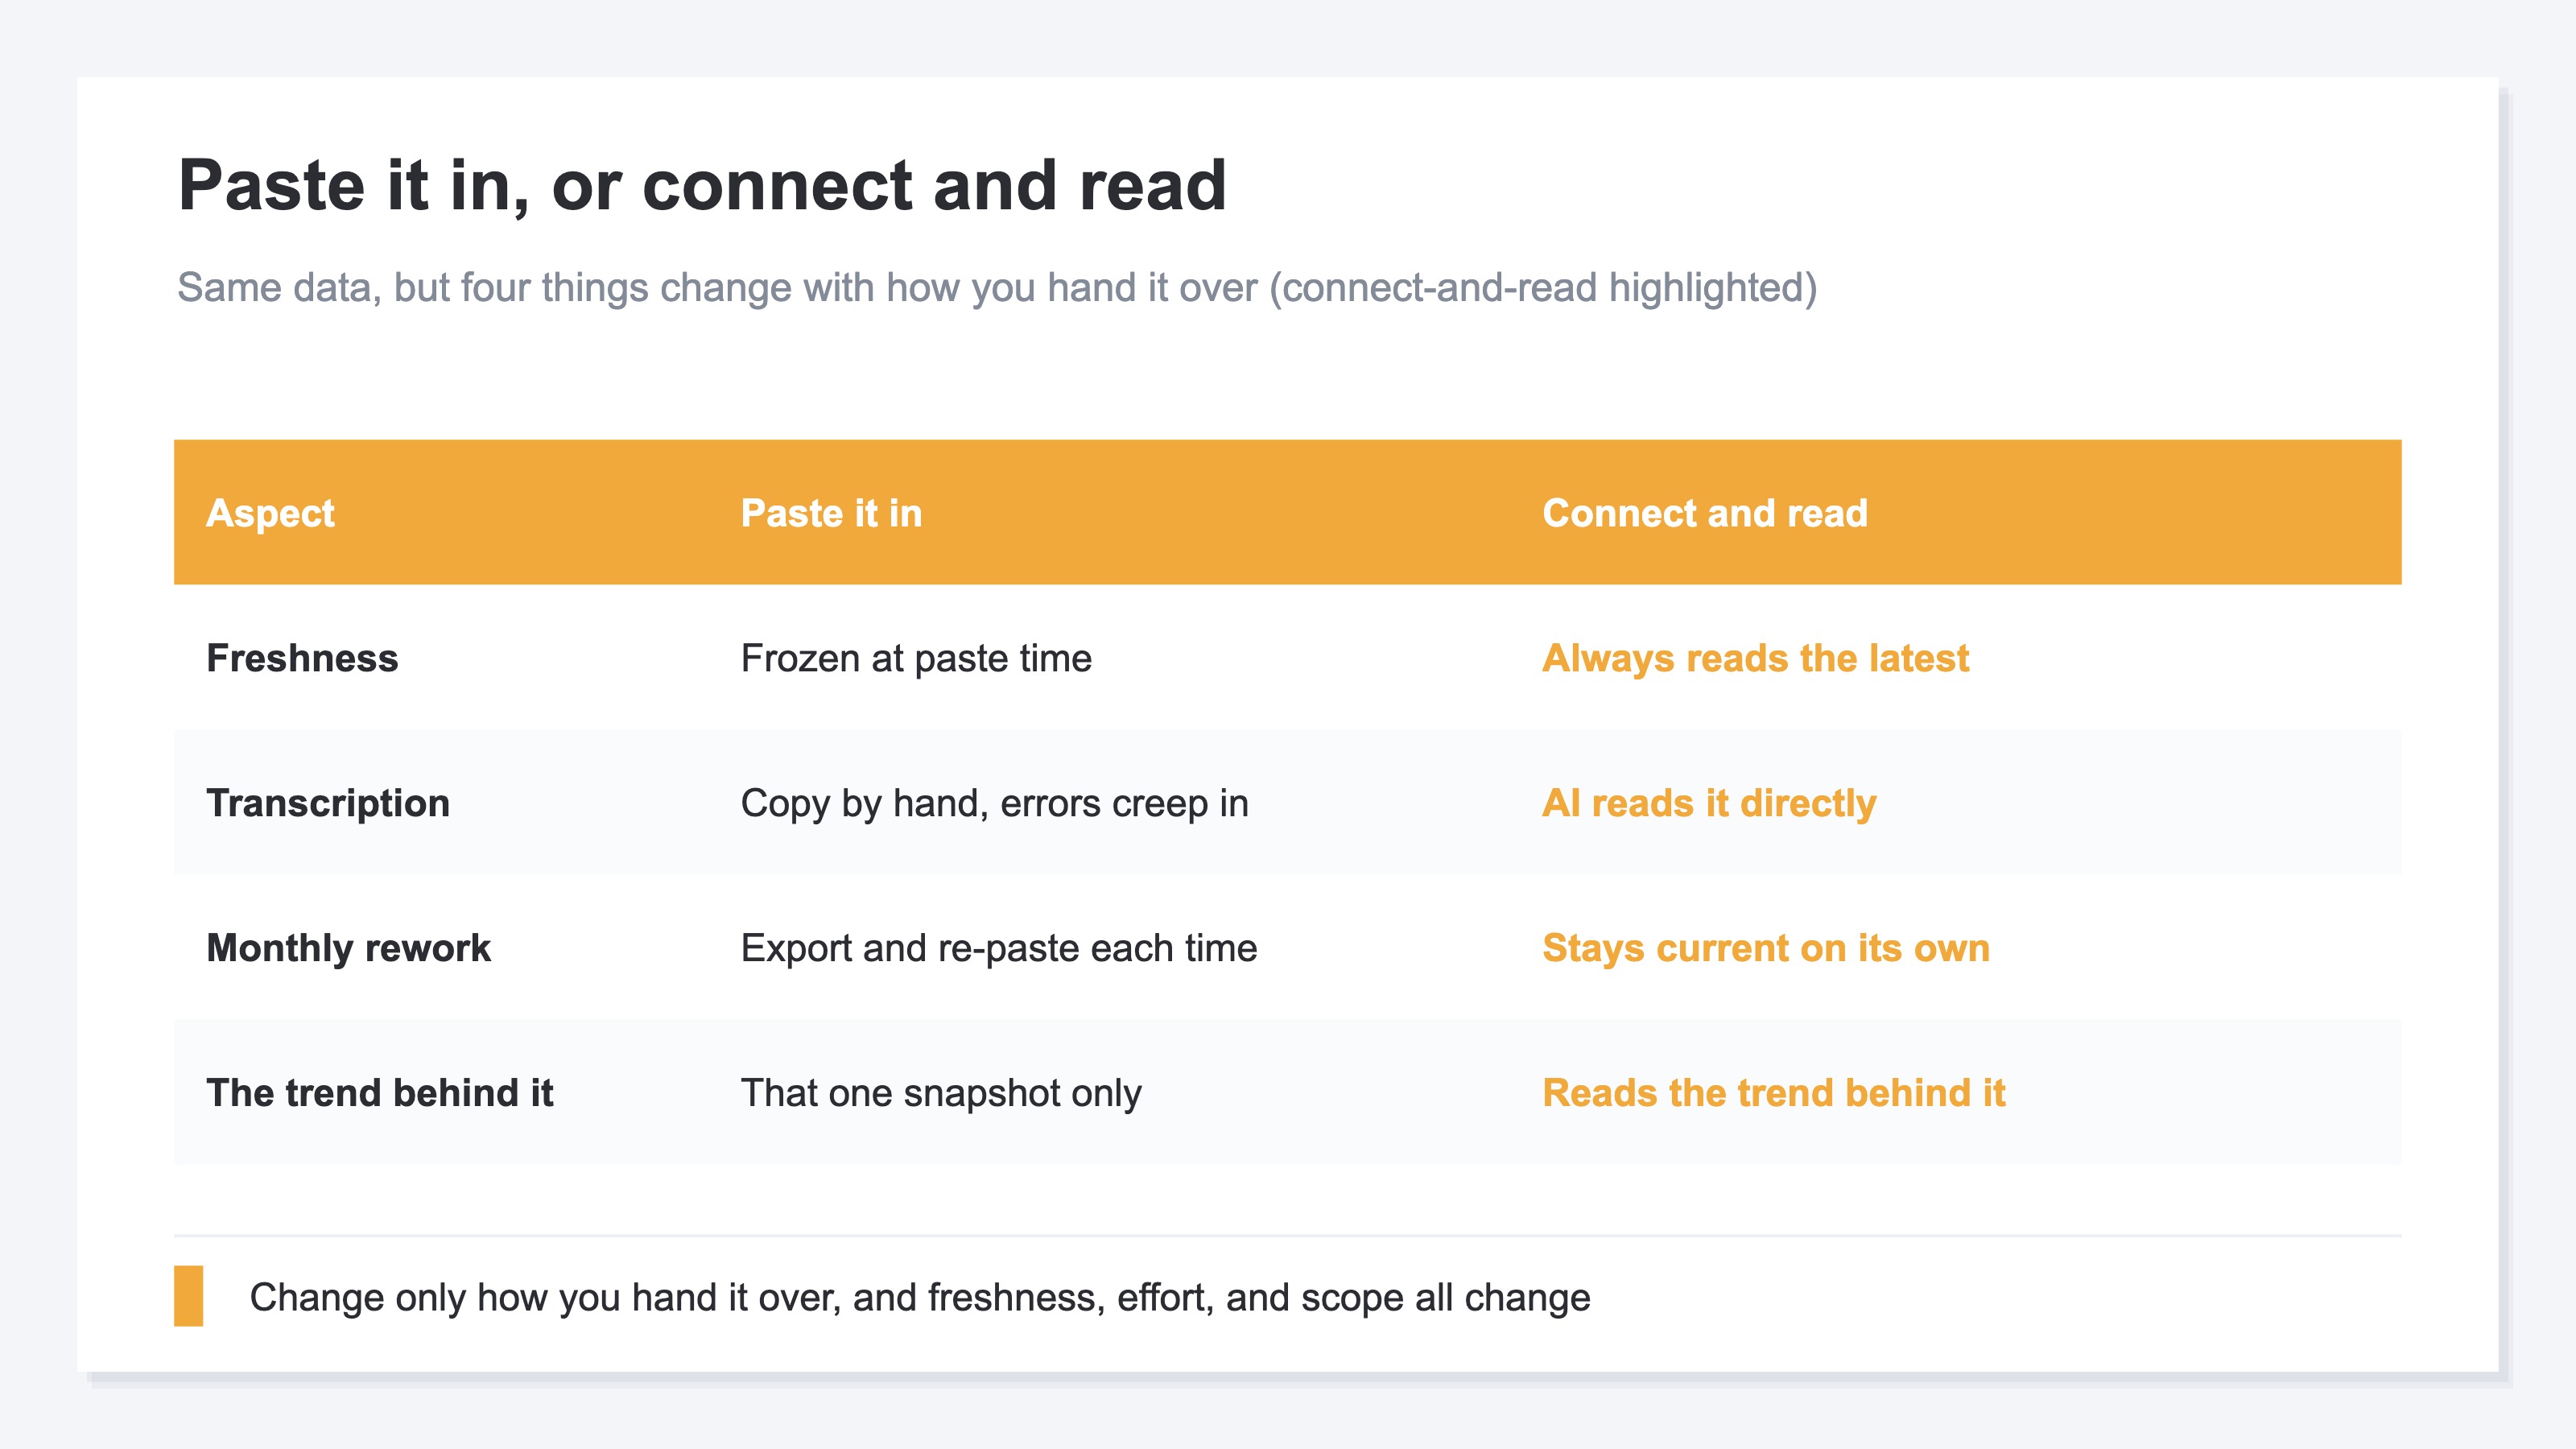
Concretely, it bites in three forms. First, freshness. An attached table stops at the moment you handed it over, so by tomorrow it's an old figure showing yesterday's numbers. Second, repetition. To bring it up to date you export again, and attach again. Do this every month and the gathering alone eats your time. Third, and most easily overlooked, is scope. Attach one table and all AI can read is the numbers on that table. Time series like "how were things through last month" or "where did it change over these two weeks" — AI has no way to know them unless you included them in the attached table.
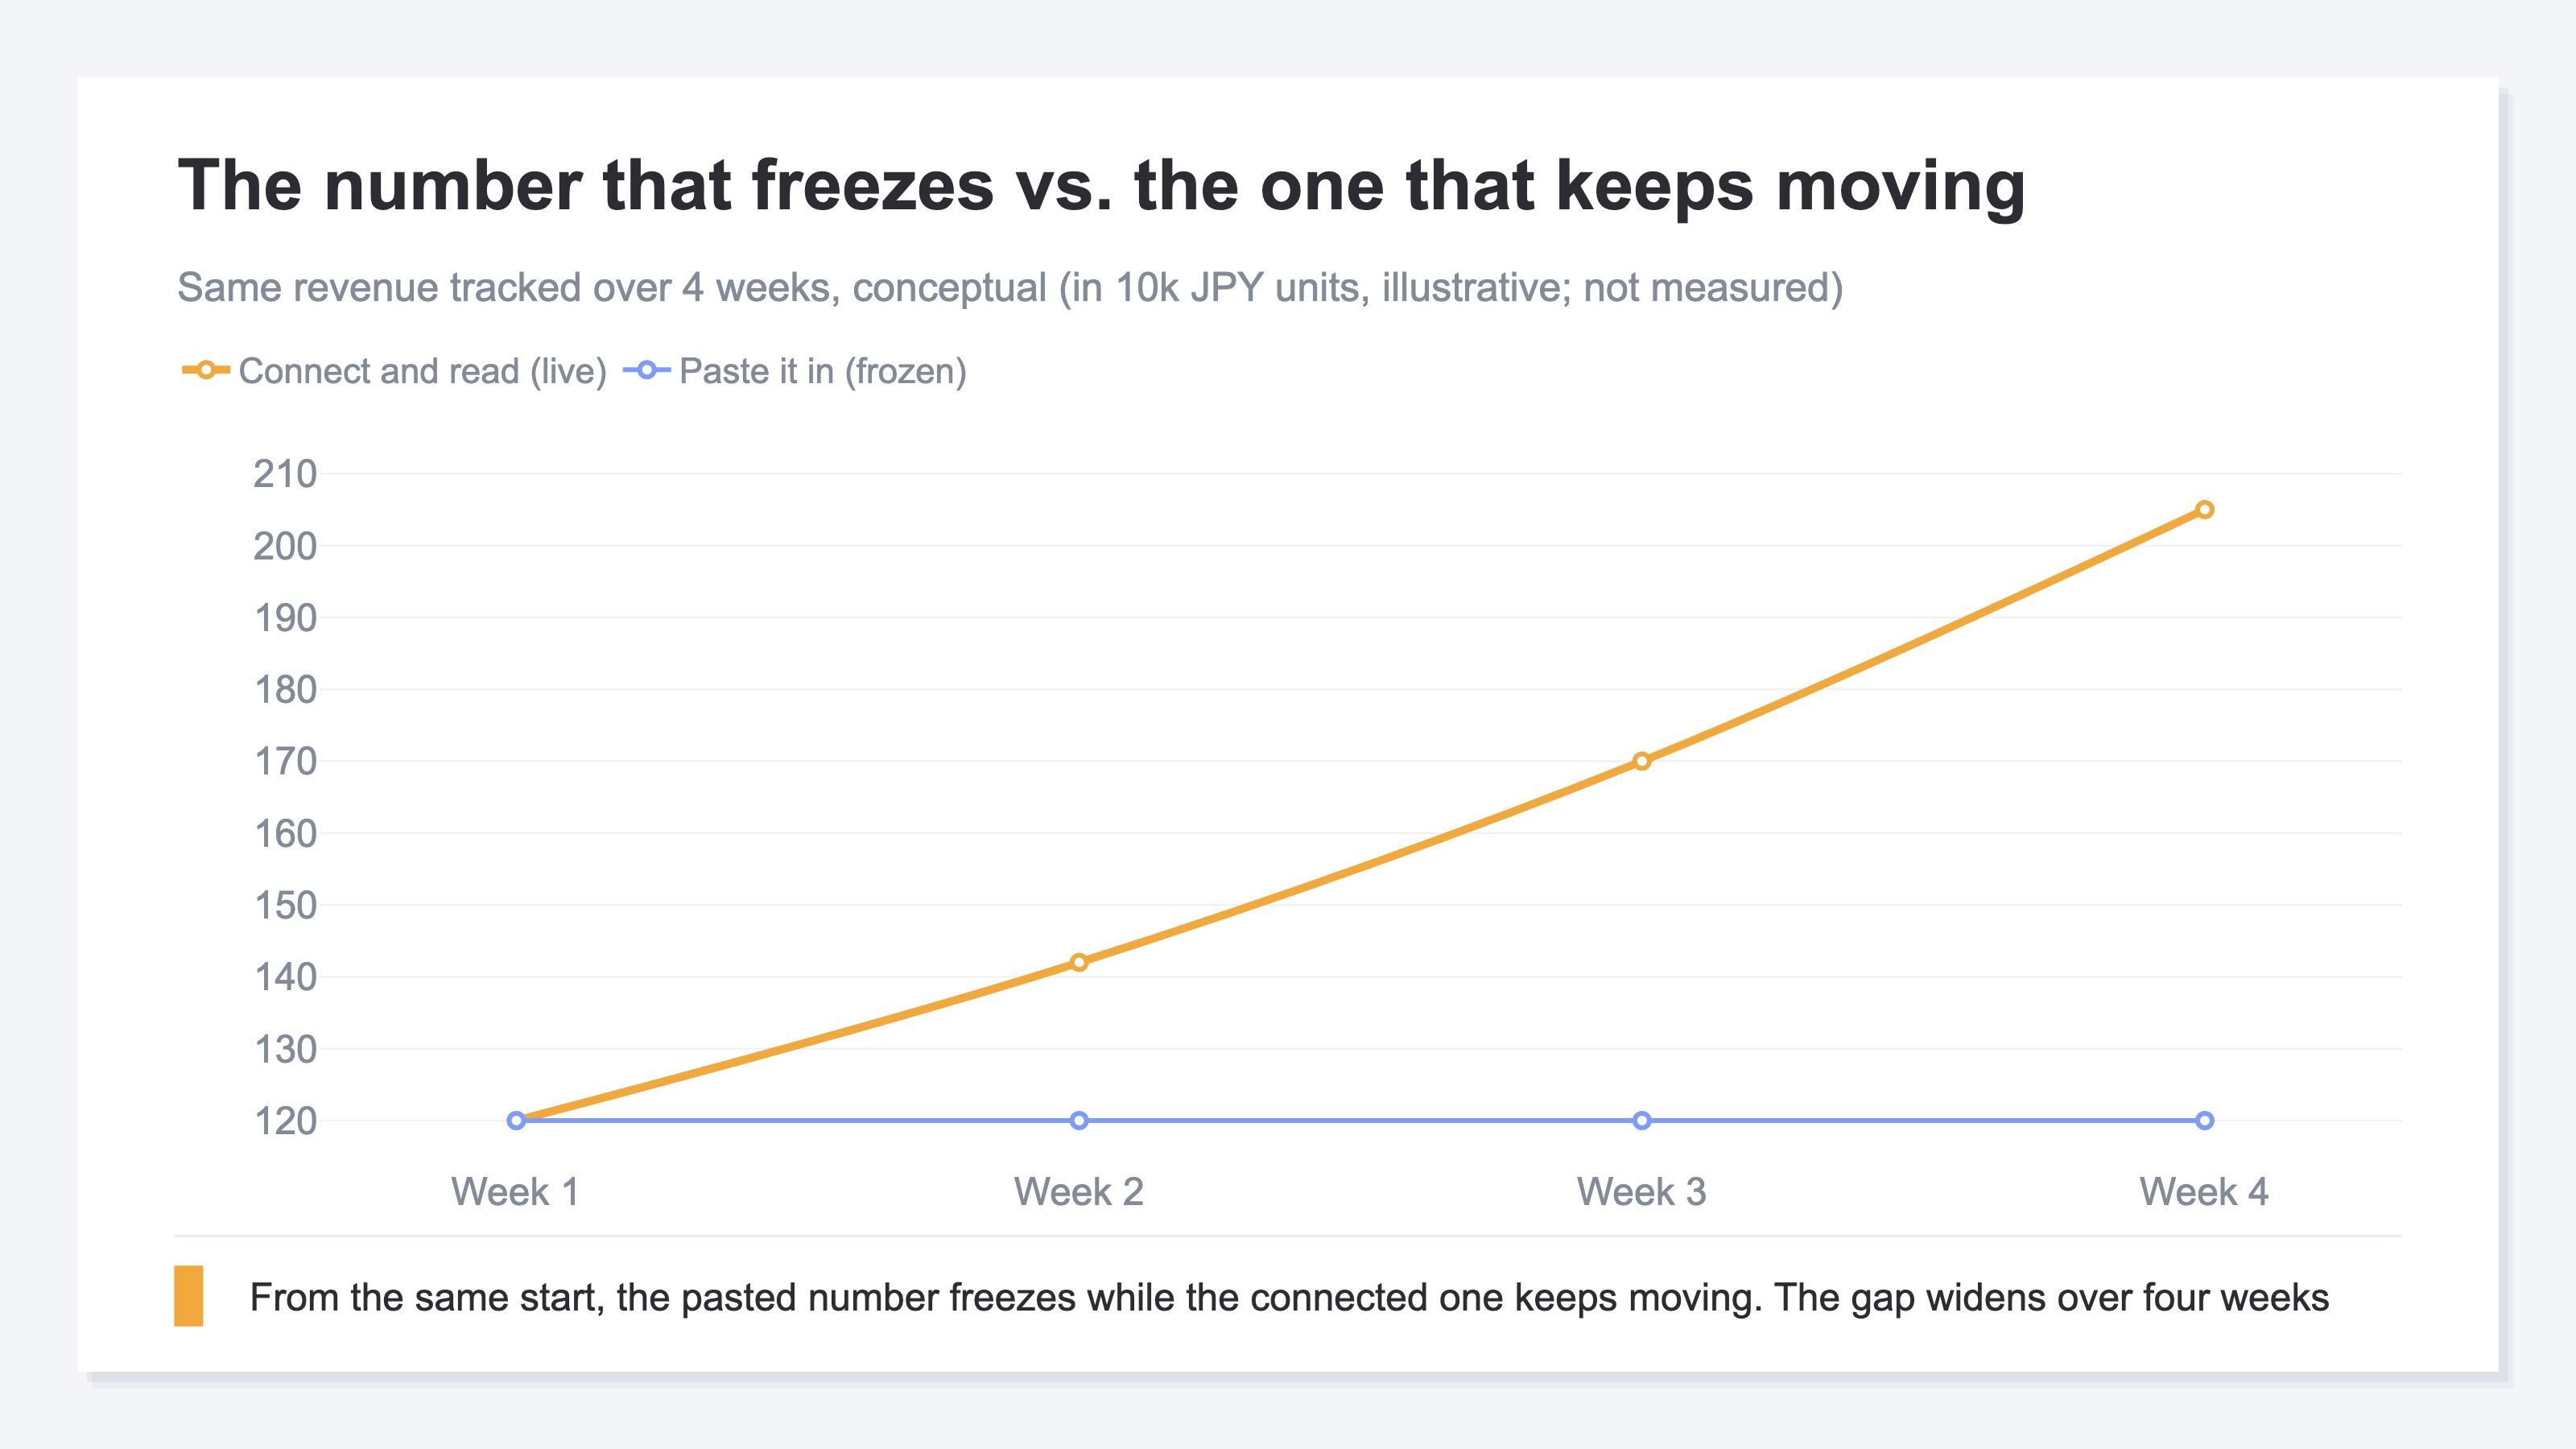
In other words, a chart made by attaching is good at "showing that one round of numbers cleanly" but ill-suited to "always seeing the moving numbers at their latest." The weight of rebuilding a monthly report from scratch every month comes up in automating your monthly report with AI too, and the root is the same: every time you hand numbers over, the world stops right there.
3. Don't Hand Data Over — Let AI Read It#
Bottom line: here we flip the idea. Stop "handing the data over" and instead "let AI read it." Rather than attaching a table, connect things so AI can go read the data itself. Then, instead of one sheet frozen at the moment you handed it over, AI reads the always-current trend as it is, turns it into a figure, and returns "where did it rise" and "why."
Let me make one thing clear. Drawing the chart is, above all, the work of the AI client (ChatGPT or Claude). Change how you hand it over and you change the material AI has to draw with. Attach a table, and all AI can read is that one sheet. Let it read, and AI can read the sequence of the latest numbers (the trend) directly, so it can draw "how this metric moved from last week into this week" each time as a fresh figure. Instead of a person exporting and re-attaching every month, AI goes and reads. So the figure is always current, and the trend behind it is visible too.
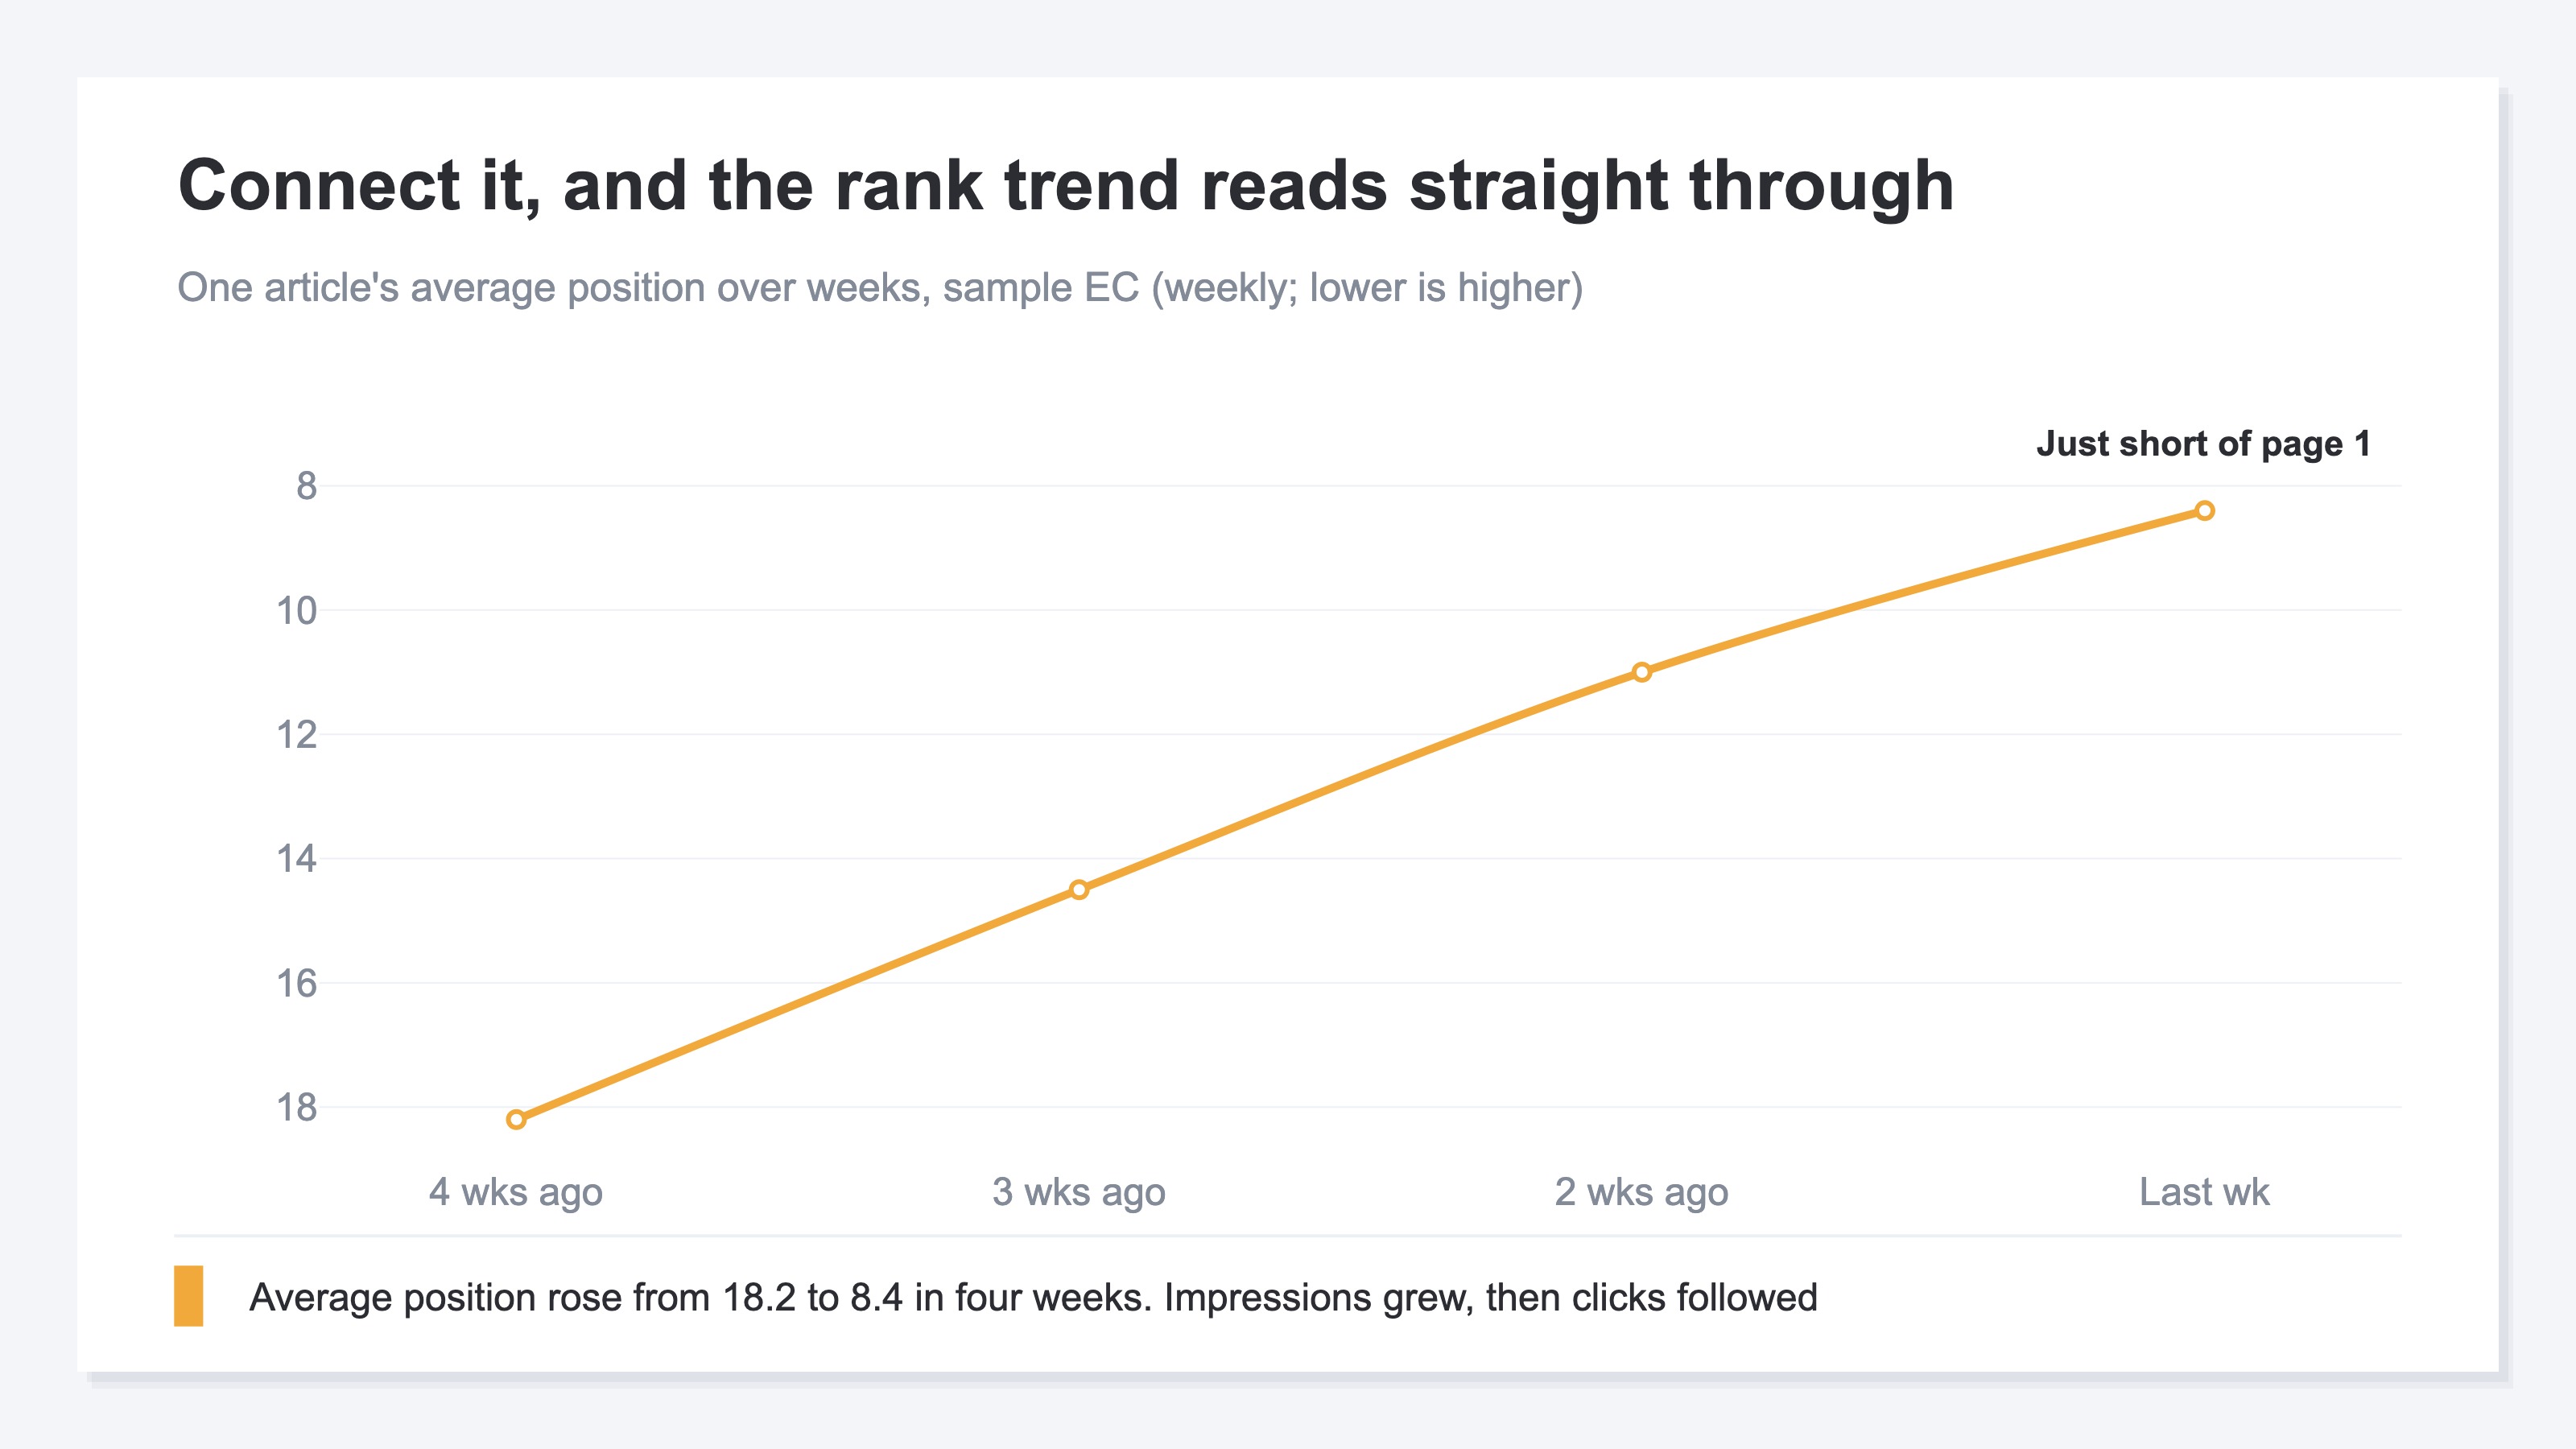
Say you want to know whether an article's search rank is climbing. Screenshotting the rank week by week from the Google Search Console performance report [2] and attaching it is a chore. In the read form, AI reads that one page's rank, click, and impression trend as it is, draws the line of rank climbing, and returns the background too — "impressions grew, and clicks followed from there." Search figures are Google Search's, with a two-to-three-day lag, but unlike a still image handed over once they don't stop there; each read goes and fetches the latest sequence. Letting AI read the always-current trend takes a read-only connection through which AI can safely read the numbers.
RevenueScope helps
Bottom line: connect RevenueScope to ChatGPT or Claude and AI reads your own EC's numbers directly and answers. No hard setup or SQL. It's read-only, so there's no worry of rewriting data. Instead of attaching a table, you let AI read the always-current trend as it is. AI draws the figure; what RevenueScope hands over is "always-current, living numbers."
The clearest case is one page's search-rank trend. RevenueScope lets AI read that one page's sequence of average position, clicks, and impressions (get_page_trend). AI reads it, draws the line of rank climbing, and returns where impressions grew and how that carried through to clicks. No one needs to screenshot and re-attach every week.
Let me show the actual numbers AI reads, with sample-store data.
Sample EC store, one article's search-rank trend (weekly)
| Week | Average position | Clicks | Impressions |
|---|---|---|---|
| 4 weeks ago | 18.2 | 3 | 210 |
| 3 weeks ago | 14.5 | 7 | 245 |
| 2 weeks ago | 11.0 | 12 | 268 |
| Last week | 8.4 | 21 | 290 |
Figures from a fictional store with sample data (RevenueScope demo). Average position is impression-weighted; smaller is higher.
Let AI read this sequence and it draws the trend — "average position climbed from 18.2 to 8.4 over four weeks, up to just short of page one" — as a line, and returns the reading too: "impressions grew, and clicks followed with a lag." The same holds when you want the whole revenue picture: let it read the daily trend of revenue, sessions, and Revenue Per Session (RPS — revenue divided by sessions, a term not yet standard in the industry) over a period (get_summary), and AI turns that trend into a figure. Charting stops being "make it and you're done" and becomes the doorway to thinking about "where did it move, and why."
Drawing the figure is the AI client's job (ChatGPT or Claude); RevenueScope sits just upstream, a layer that lets AI read the latest numbers read-only. Instead of a person exporting and handing it over every week, RevenueScope feeds AI the always-current trend. So you can graduate from a figure that goes stale each time you attach, all the way to letting AI read the always-current trend as it is — and you can start today.
FAQ#
Q. You can make charts in ChatGPT too. What's the difference?
A. The same AI draws the figure. What differs is how you hand it over. Attach a table and all AI can read is that one sheet, out of date the moment you make it. Connect it read-only and AI can read the always-current trend directly, so it can draw the latest figure anytime and return what went up and why. The full picture of getting ready is collected in EC AI adoption starts with connecting your data.
Q. Can I get a current chart by attaching, too?
A. Export and re-attach every time and you can come close. But it goes out of date again the moment you attach, and the same work recurs every month. And since you hand over only that one round of numbers, the trend behind them (how things moved through last week) can't be pulled unless you included it in the attached table. In the read form, both the re-attaching and the narrow scope go away.
Q. Does RevenueScope make the chart for me?
A. RevenueScope is a layer that lets AI read the latest numbers read-only. Drawing the chart is the work of the AI client (ChatGPT or Claude): AI turns the latest trend RevenueScope hands over into a figure and returns the interpretation too. In short, RevenueScope keeps feeding the living numbers so AI can always draw from the latest.
Summary#
Charting with AI today means "attaching a file." But a chart made this way is out of date the moment you make it; next month you attach again, and you can't pull the trend behind it. Flip the idea — don't "hand the data over," let AI read it — and AI reads the always-current trend directly, turns it into a figure, and returns "where did it rise, and why." AI draws the figure; what you hand over is the latest numbers. Charting is only the doorway to a decision, and only once AI reads the always-current trend does work turn into a decision. The revenue blind spot where you're visible in search but not clicked is in why the GSC generative-AI report can't see revenue, and which GA4 report to start from is in start with these three GA4 reports. Once you can see it, how to pick the next move is in don't let the monthly report be the end — pick the next move by revenue.
See which ads actually drive revenue, at a glance
Free up to 5,000 sessions/month, AI connection included. No credit card required. Up and running in 5 minutes.