When an A/B test shows a difference, you adopt the variant with the higher conversion rate. The procedure itself is standard, but revenue sometimes fails to grow after you adopt it. If conversion rate was the only metric in the decision, a drop in average order value never reached the result. Here are the three ways that happens.
Contents
Key takeaways#
- Conversion rate multiplied by average order value gives revenue per session (RPS)
- A variant can win on conversion rate and still lose on RPS if order value fell
- Both conversion rate and order value swing day to day, so a difference is not automatically an effect
- A test that includes a discount pulls later purchases forward into the test window
- Fix the adoption rule before starting: the metric, the window, and the minimum order count
1. The variant that won on conversion rate lost on order value#
Conversion rate and order value move independently, so deciding on one of them leaves the other's decline out of the result.
The revenue produced by a single visit is revenue per session (RPS). RPS equals conversion rate multiplied by average order value. At a 1.6% conversion rate and an order value of 20,000 yen, RPS is 320 yen. Total revenue is that RPS multiplied by sessions.
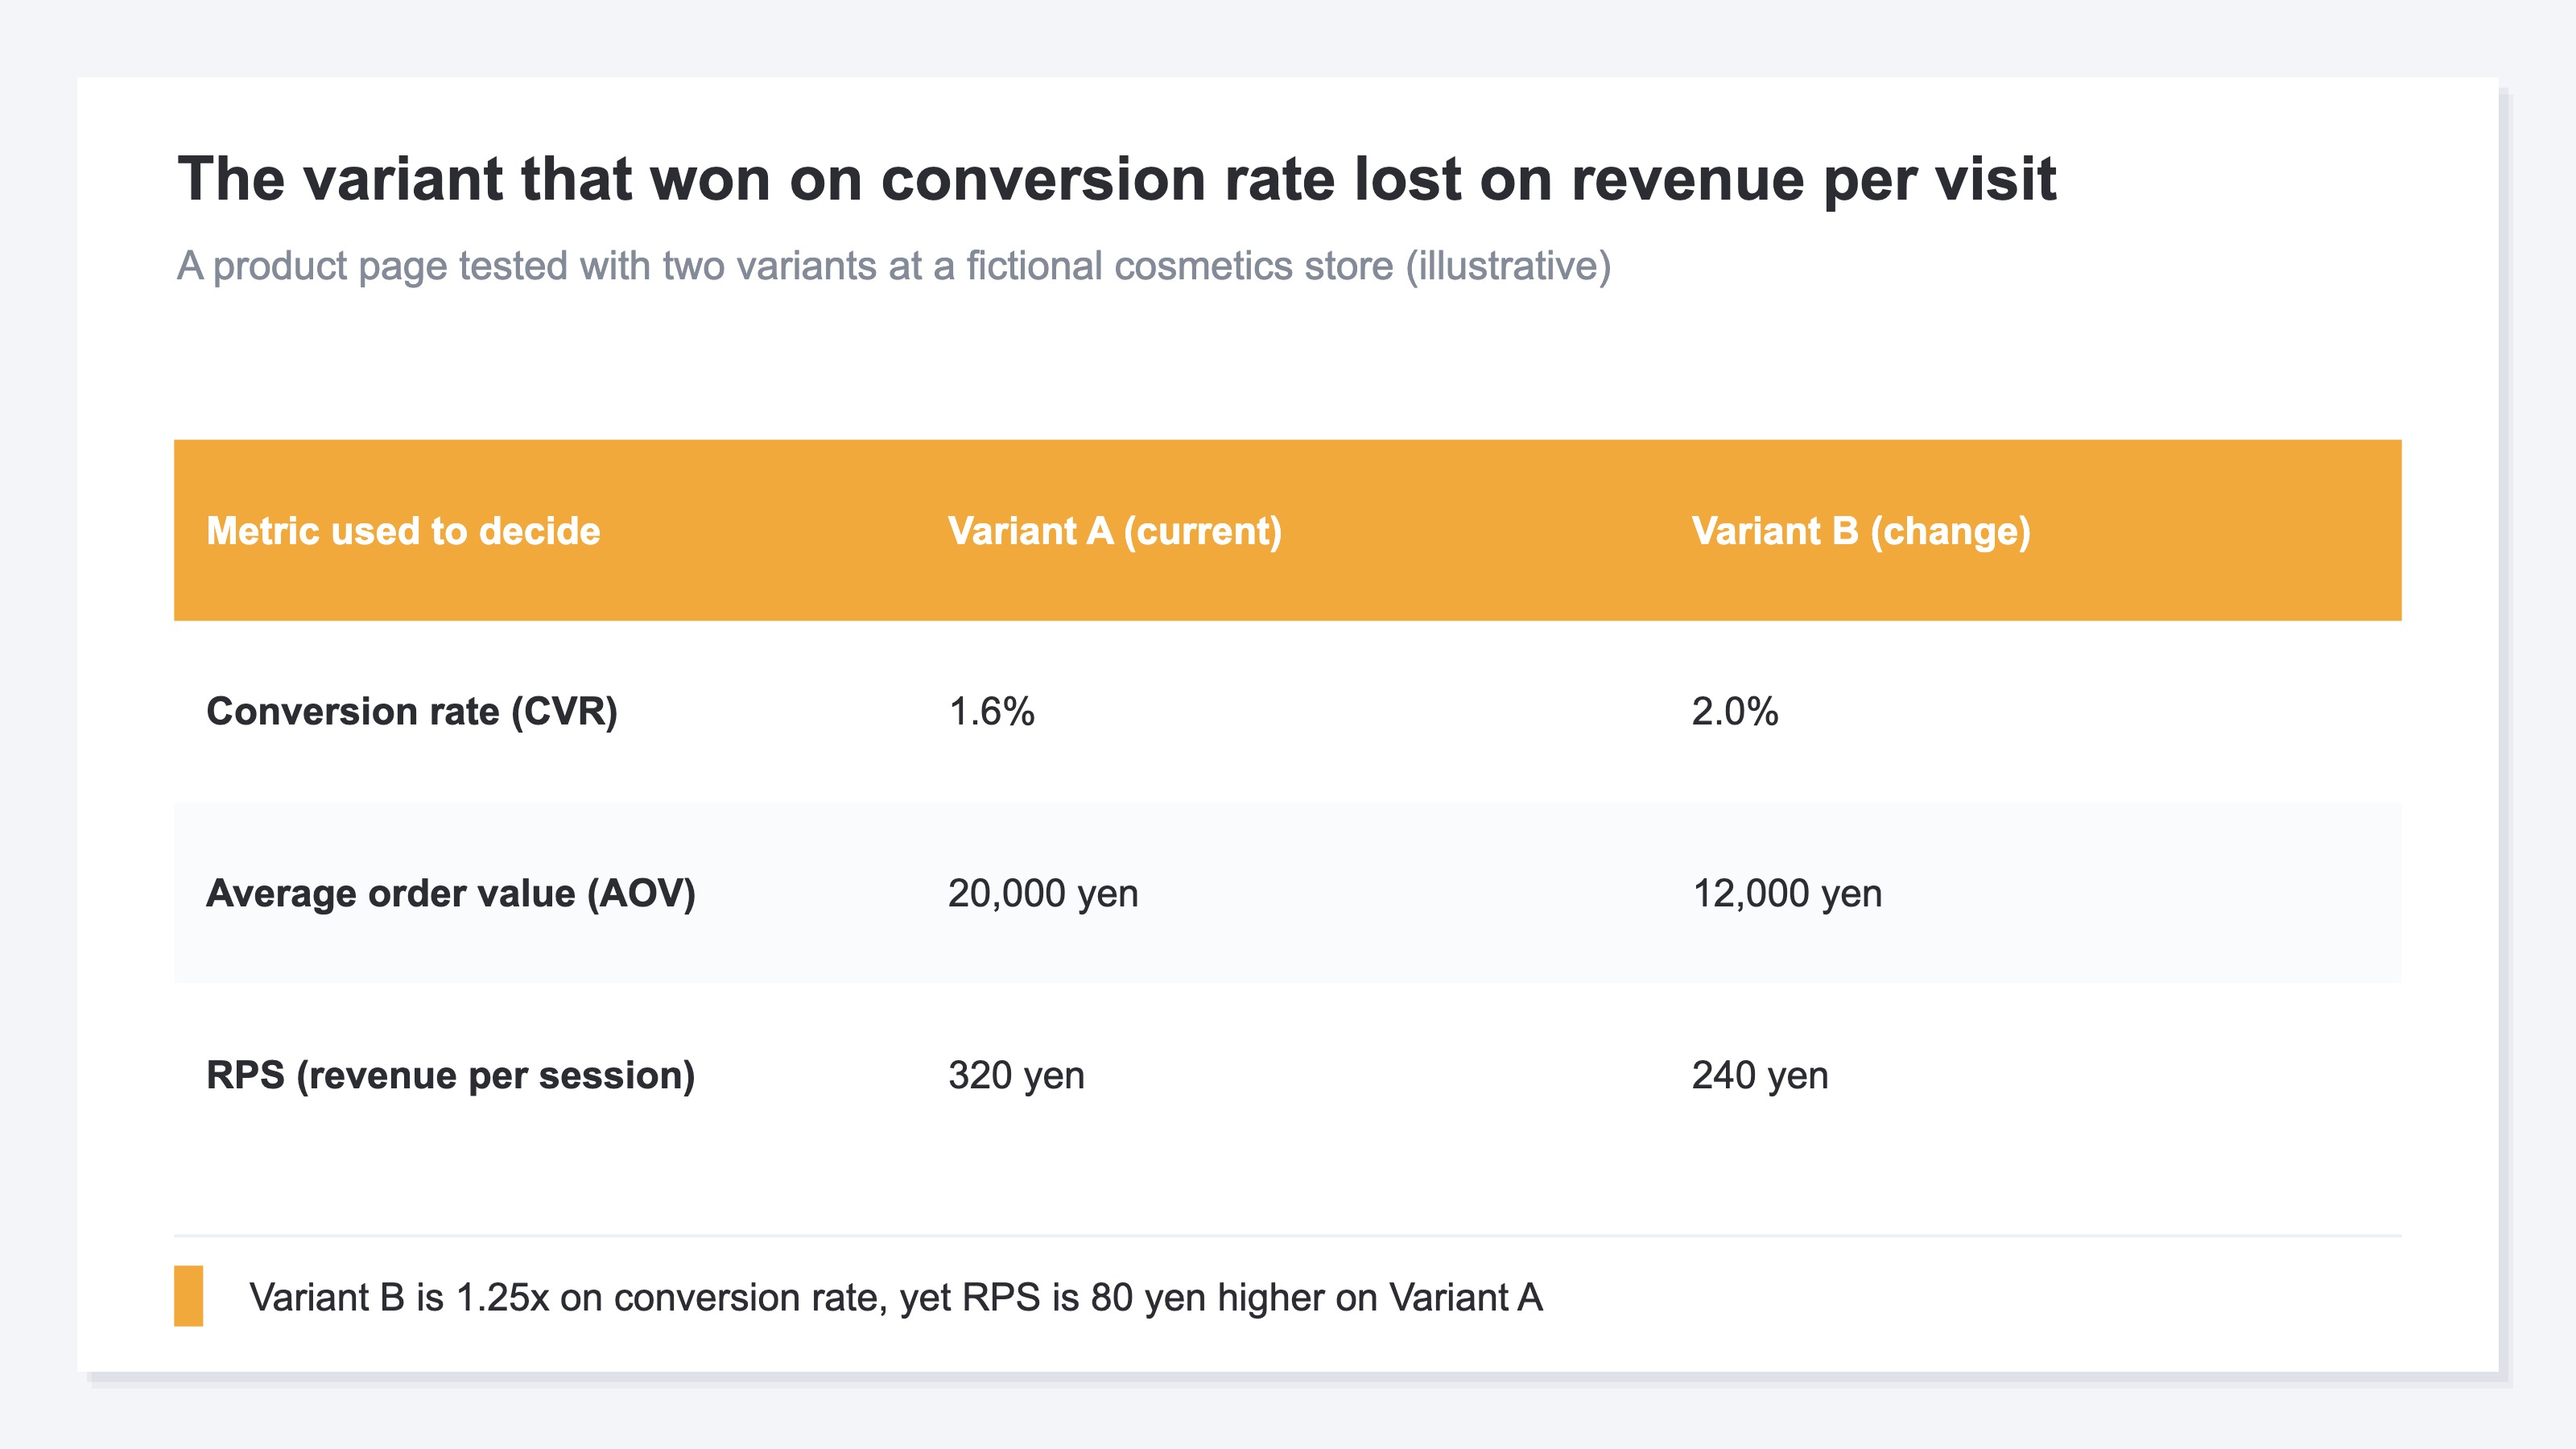
Here is what happens when conversion rate alone decides it. Say a fictional cosmetics store tested two versions of a product page.
| Metric used to decide | Variant A (current) | Variant B (change) |
|---|---|---|
| Conversion rate (CVR) | 1.6% | 2.0% |
| Average order value (AOV) | 20,000 yen | 12,000 yen |
| RPS | 320 yen | 240 yen |
Variant B is 1.25 times higher on conversion rate, and on conversion rate alone it wins. Order value, however, is 8,000 yen lower on Variant B. Multiplied out, RPS is 320 yen for Variant A and 240 yen for Variant B: the variant that won on conversion rate is 80 yen behind on the revenue a single visit produces. Across the same number of visits, that gap is 80 yen multiplied by those visits.
The reasons order value falls sit inside the variant itself: cheaper items moved to the top, a bundle path removed so single items stand out, a discount placed in front. Each pushes conversion rate up and lowers the value of a single order at the same time. A higher conversion rate is a valid sign that the variant worked. Whether it reached revenue takes a metric other than conversion rate.
The definition of revenue used in the decision also needs to be fixed in advance. GA4 defines "Purchase revenue" as purchases plus in-app purchases plus subscriptions, minus refunds[1]. In a test where the return rate differs by variant, the conclusion can invert between the figure before refunds and the figure after them.
2. That difference may not be the variant's effect#
Splitting one variant into two still produces different numbers, so whether a difference is an effect stays undecided until you know the width of normal variance.
Conversion rate and order value both swing by the day. Different products sell on weekends than on weekdays, and a single high-value order moves that day's order value. The way to measure that width is a test that changes nothing: split identical content into two groups and measure the difference that appears anyway.
Sample size is what matters here. The numerator of conversion rate is the order count, and the denominator of order value is also the order count. However many visits arrive, if the two groups together produce only a few dozen orders, one order moves the rate substantially. A "30% improvement" between 20 orders and 26 orders cannot be separated from the six orders that happened to land that week.
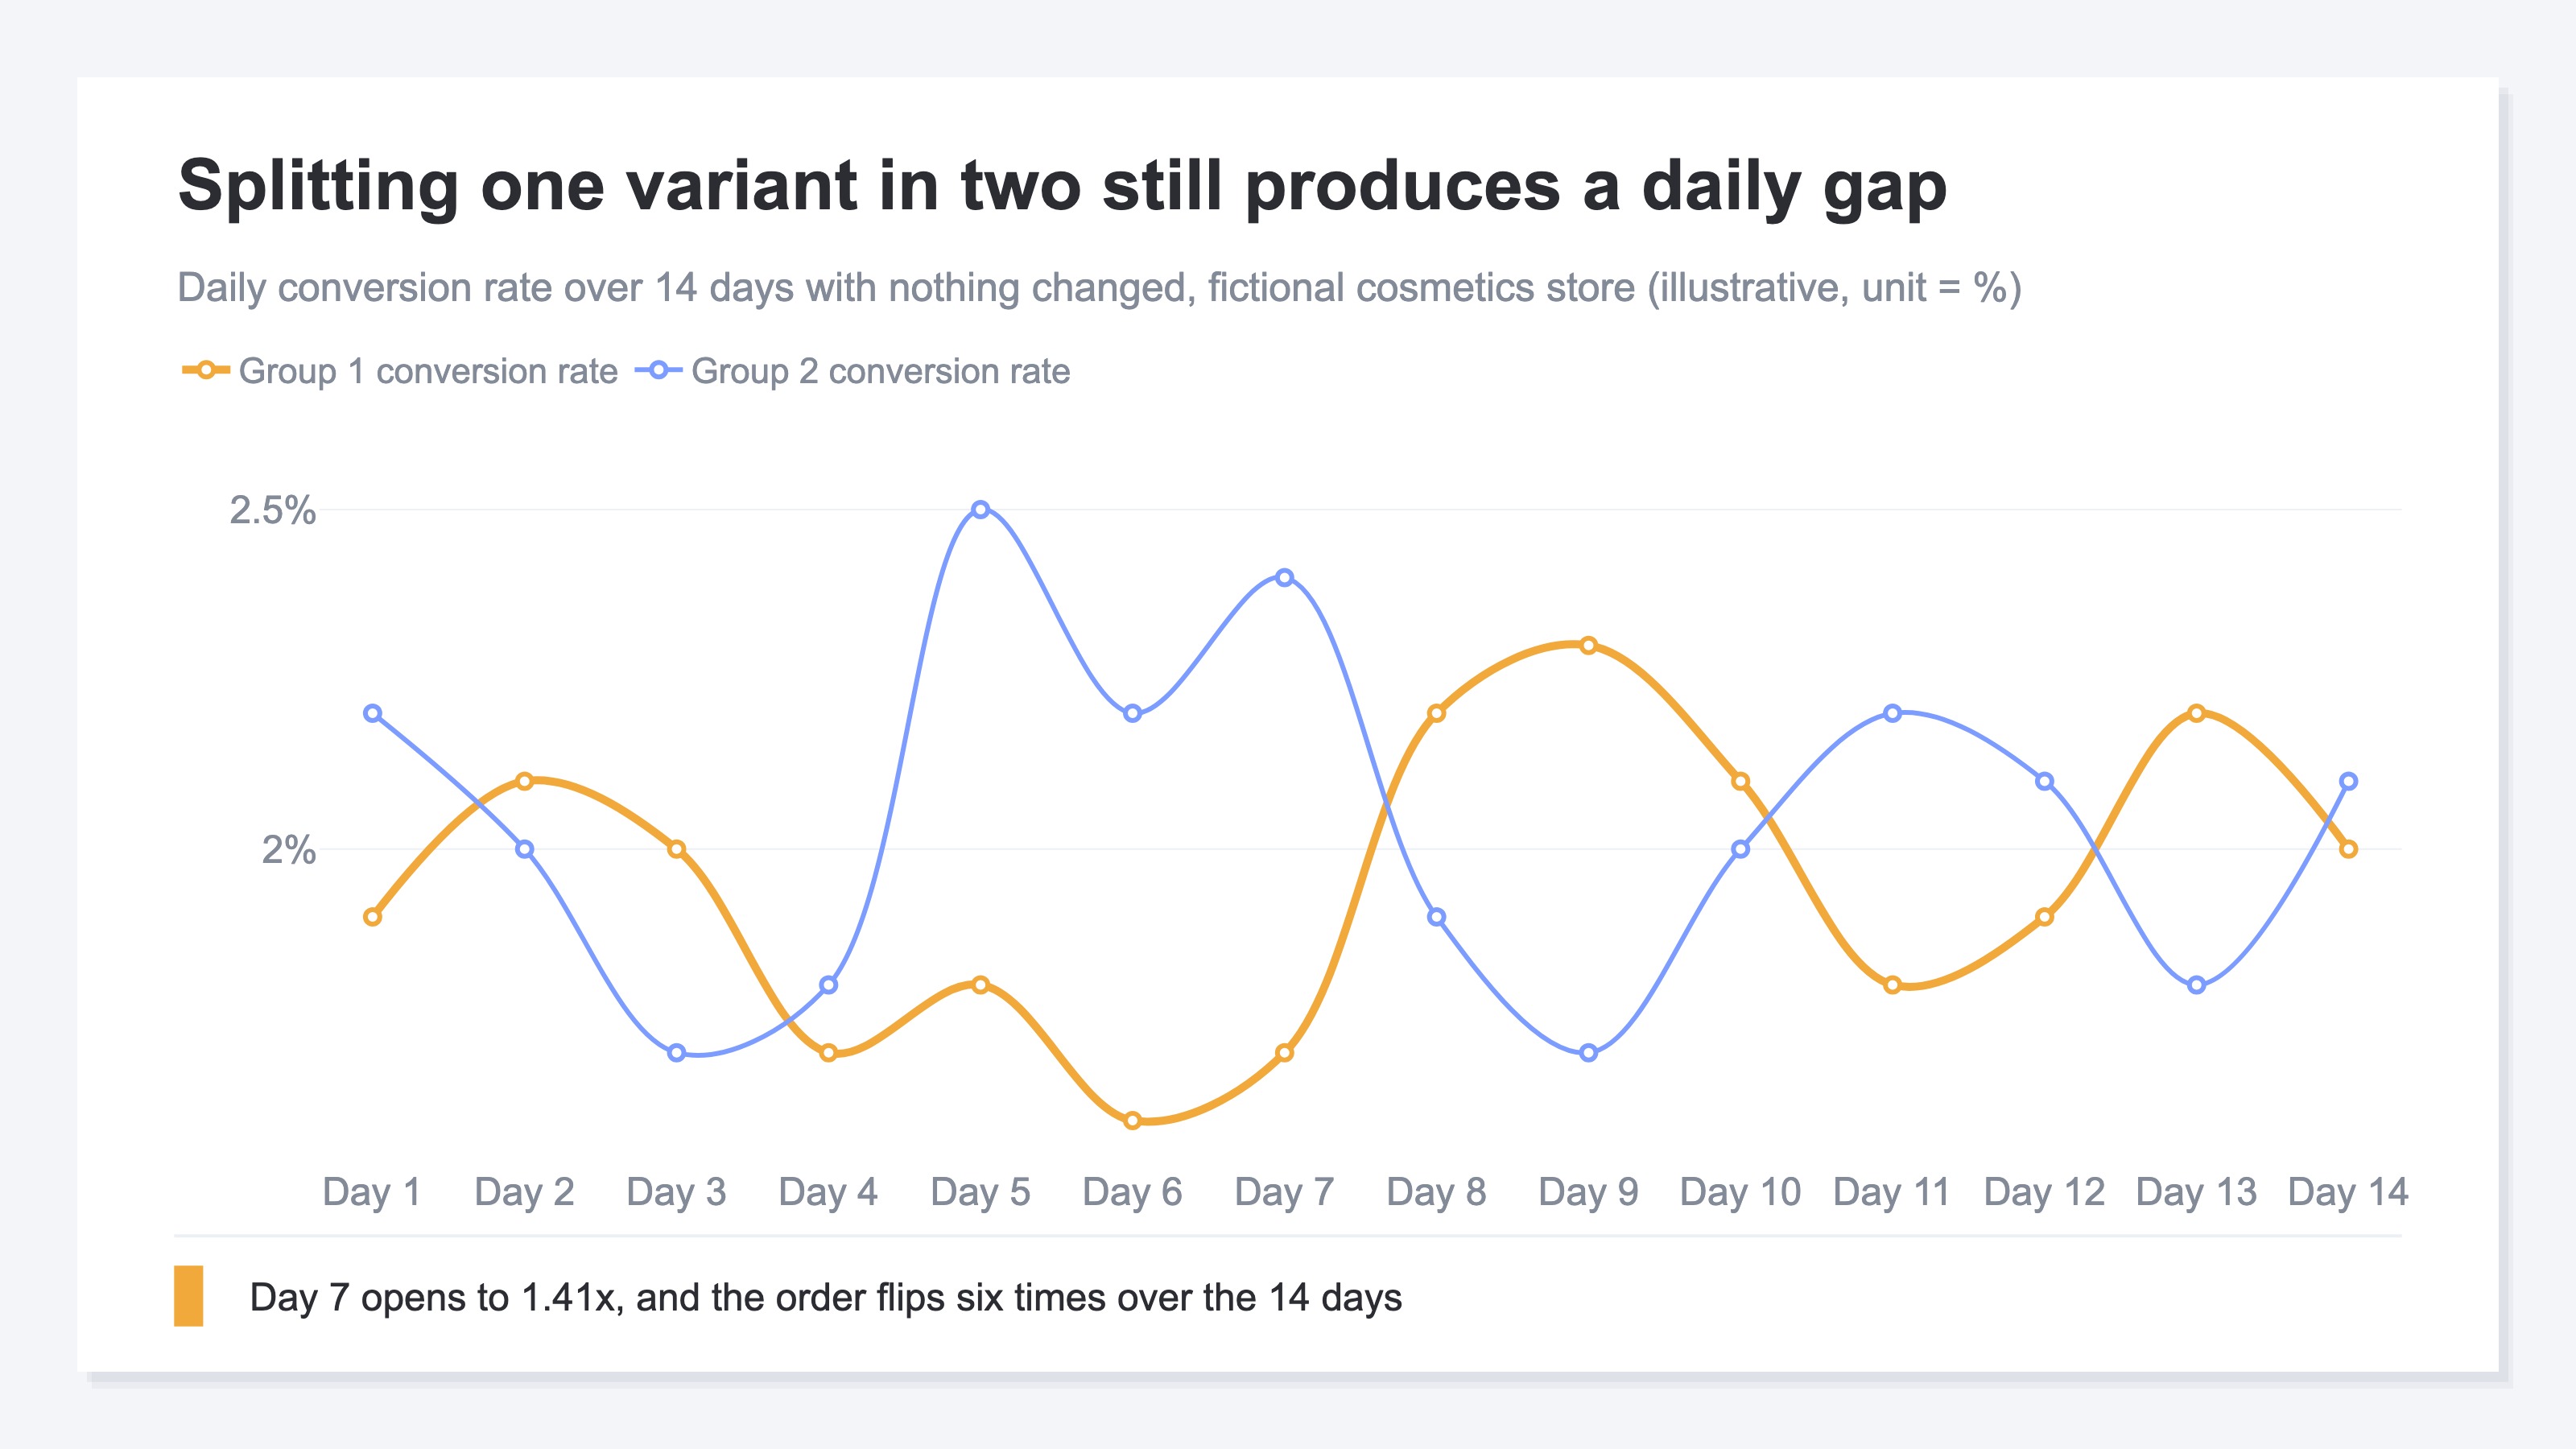
Once you know your own store's variance, tests read differently. In a store that opens to 1.41x with nothing changed, a 1.3x difference from a variant sits inside that variance. In a store whose variance stays within 1.1x, the same 1.3x has a case for being an effect. What the decision needs first is your own width, not an industry benchmark.
3. The test window contains purchases that were coming later anyway#
A test that includes a discount or a campaign moves future purchases into the test window, so the revenue inside that window cannot decide adoption on its own.
Compare a variant with 10% off against one without, and the discounted side converts better. Part of those purchases, though, are orders that would have arrived a few weeks later without any discount. The test window carries that portion as revenue pulled forward. In the weeks after the test stops, the same customers are not buying.
This shape never appears in a table cut to the test window. Stopping the count at the end of the period books the borrowed portion as revenue while the repayment falls outside the count.
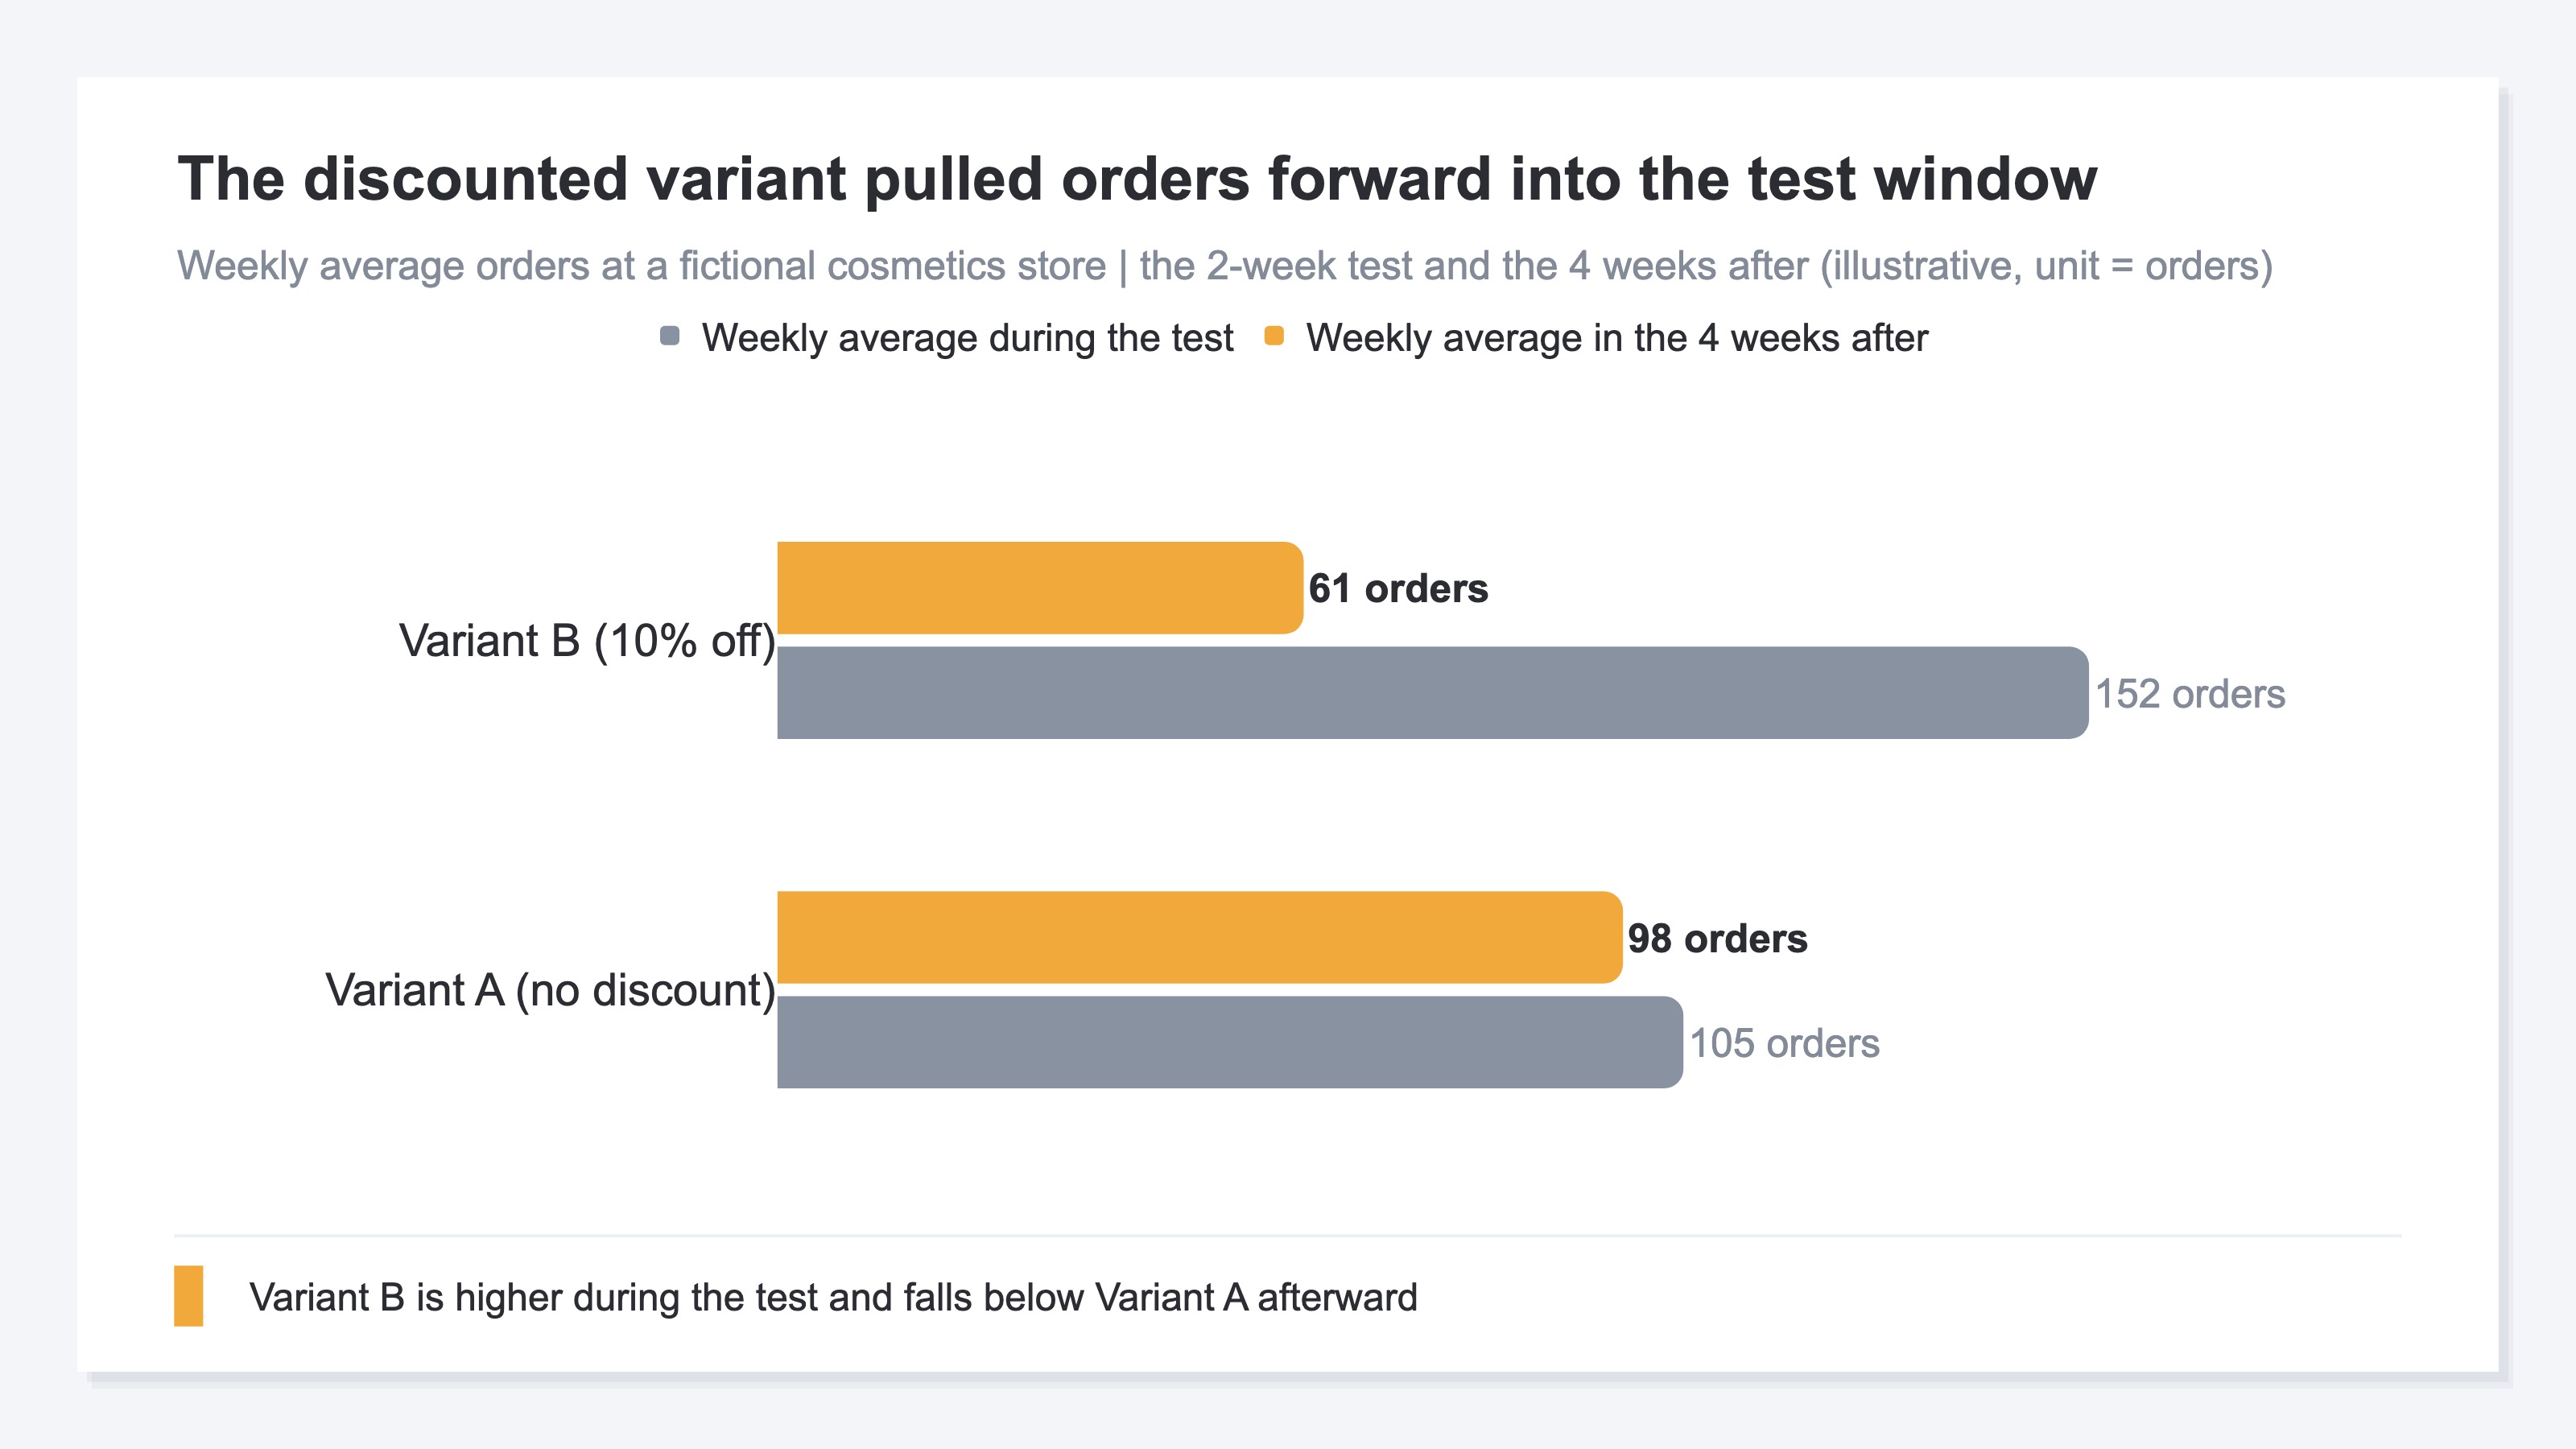
To see it, keep measuring revenue on the same basis after the test ends. Put the weekly average during the test next to the weekly average across the four weeks after, and check whether only the discounted side fell. If it did, part of the revenue booked inside the test window was purchases that were coming later anyway. The same shape appears in ad budget allocation, so setting the adoption rule for a Google Ads budget A/B test covers the neighboring case.
4. Decide the adoption rule before you start#
Leaving the decision materials open to choice after the fact means the convenient metric gets chosen, so fix the rule before the test starts.
Three things. First, the metric in the decision, set to RPS rather than conversion rate alone. Second, the windows you will count, both the test window and one that includes the period after it, decided up front. Third, the minimum order count below which you will not judge at all.
Then there is one setup step that lets you check against revenue afterward: give each variant its own utm_campaign. An A/B testing tool holds internally which visitor saw which variant, but that split never reaches your own revenue reporting. Separating the campaign name at the traffic level means you can still produce revenue per variant from your own data after the test ends. Without it, the moment the test window passes, there is no way to trace revenue back to each variant. How to read revenue efficiency by UTM campaign covers the naming side.
RevenueScope approach
What a testing tool answers is "which variant had the higher conversion rate." What the person deciding adoption needs is "which variant sold more," and those are not the same question. Answering the second one requires revenue to be counted at the level of the variant.
RevenueScope counts purchases that landed on your own site, and opening a channel row shows sessions, revenue, RPS, average order value (AOV) and conversion rate (CVR) by utm_campaign. If the variants were split by utm_campaign, those rows become your variant rows. The split that lived only inside the testing tool now also lives on the revenue side.
GA4 breaks down by campaign too, but what leads there is session and conversion counts. What RevenueScope puts at campaign level from the start is RPS and order value — the two this article uses to decide.
Performance of the campaigns used for the test at a fictional cosmetics store (illustrative)
| Breakdown | Sessions | RPS | AOV | CVR |
|---|---|---|---|---|
| Email (channel) | 6,000 | 280 yen | 15,556 yen | 1.8% |
| ┗ product_page_A | 3,000 | 320 yen | 20,000 yen | 1.6% |
| ┗ product_page_B | 3,000 | 240 yen | 12,000 yen | 2.0% |
The three rows above are one worked example placed here to illustrate the point. What the demo screen holds is sample data from the showcase store (updated daily), so opening it will not produce these same figures.
product_page_A produces 320 yen per visit, product_page_B 240 yen. product_page_B is the one winning on conversion rate, yet it lands 80 yen short on the revenue a visit produces. Added together as Email, the two come to 280 yen and an order value of 15,556 yen. No variant sold at 280 yen, and no customer paid 15,556 yen. What settles the test sits before the addition.
Conversion rate at campaign level is calculated on a session basis. Its denominator differs from the conversion rate a testing tool reports against assigned visitors, so the two figures will not match. What you compare is not the values themselves but the order between the variants.
FAQ#
Frequently asked questions#
Q. Is it wrong to decide on conversion rate alone?
A. For a variant that only moves conversion rate, it works. For variants that also touch order value — pricing presentation, bundle paths, discounts — the direction of revenue is not settled until you reach RPS.
Q. Do we need to run an A/A test every time?
A. Not every time. Your store's variance shifts with season and product mix, so measuring it again when those change is enough to serve the tests that follow.
Q. Can a store with few orders run A/B tests at all?
A. Precision drops, so the practical move is to set a minimum order count in advance. While the count is short, trying variants with larger changes reveals differences better than running more tests.
Q. How do we confirm whether purchases were pulled forward?
A. Put the weekly average during the test next to the weekly average across the four weeks after. If only the discounted side fell, the in-window figures likely carried a pulled-forward portion.
Summary#
There are three reasons an A/B test raises conversion rate without raising revenue. The first is a variant that lifted conversion rate while lowering order value. Widening the decision to RPS brings that shape into the table.
The second is a difference that sits inside normal variance rather than being an effect. Splitting one variant into two measures how much your own store swings. The third is a discount test that pulled later purchases into the window. Line up the weekly average after it ends and only the discounted side may have fallen.
All three need materials to investigate once the test is over. Splitting variants by utm_campaign, and fixing the metric, the windows and the minimum order count before you start, leaves you able to check the decision from the revenue side afterward. A split that lives only inside the testing tool stops being traceable the moment the test stops.
See which ads actually drive revenue, at a glance
Free up to 5,000 sessions/month, AI analyst included. No credit card required. Up and running in 5 minutes.