Traffic from Google Discover suddenly climbed and visits ran several times the usual level. Should you chase this wave, or write it off as a one-time event? This article covers how to settle that question with the revenue earned during the days the spike was running, and how to read the shape of the decay.
Contents
TL;DR#
-
Unlike search, the reader on Discover has typed no keyword
Content is delivered on the basis of interests, so it is not a route you can aim at and call traffic in from your side
-
Whether the surge continues can be judged from the shape of the daily decline
Returning to the usual level within a few days is the typical shape, and Google itself calls this traffic less predictable than search
-
The value of chasing is decided by whether revenue arrived from that entry page during the days the spike was running
If sessions tripled but revenue did not move, this is not something to aim at reproducing
1. How Traffic From Google Discover Suddenly Appears#
Google Discover is a surface that shows content on the basis of interests, at moments when the user is not searching. What makes it decisively different from search results is that there is no query on the reader's side. An article or a product page appears not as the result of someone typing "let me look for this product," but as the result of Google judging that "this person looks likely to be interested in this" and lining it up.
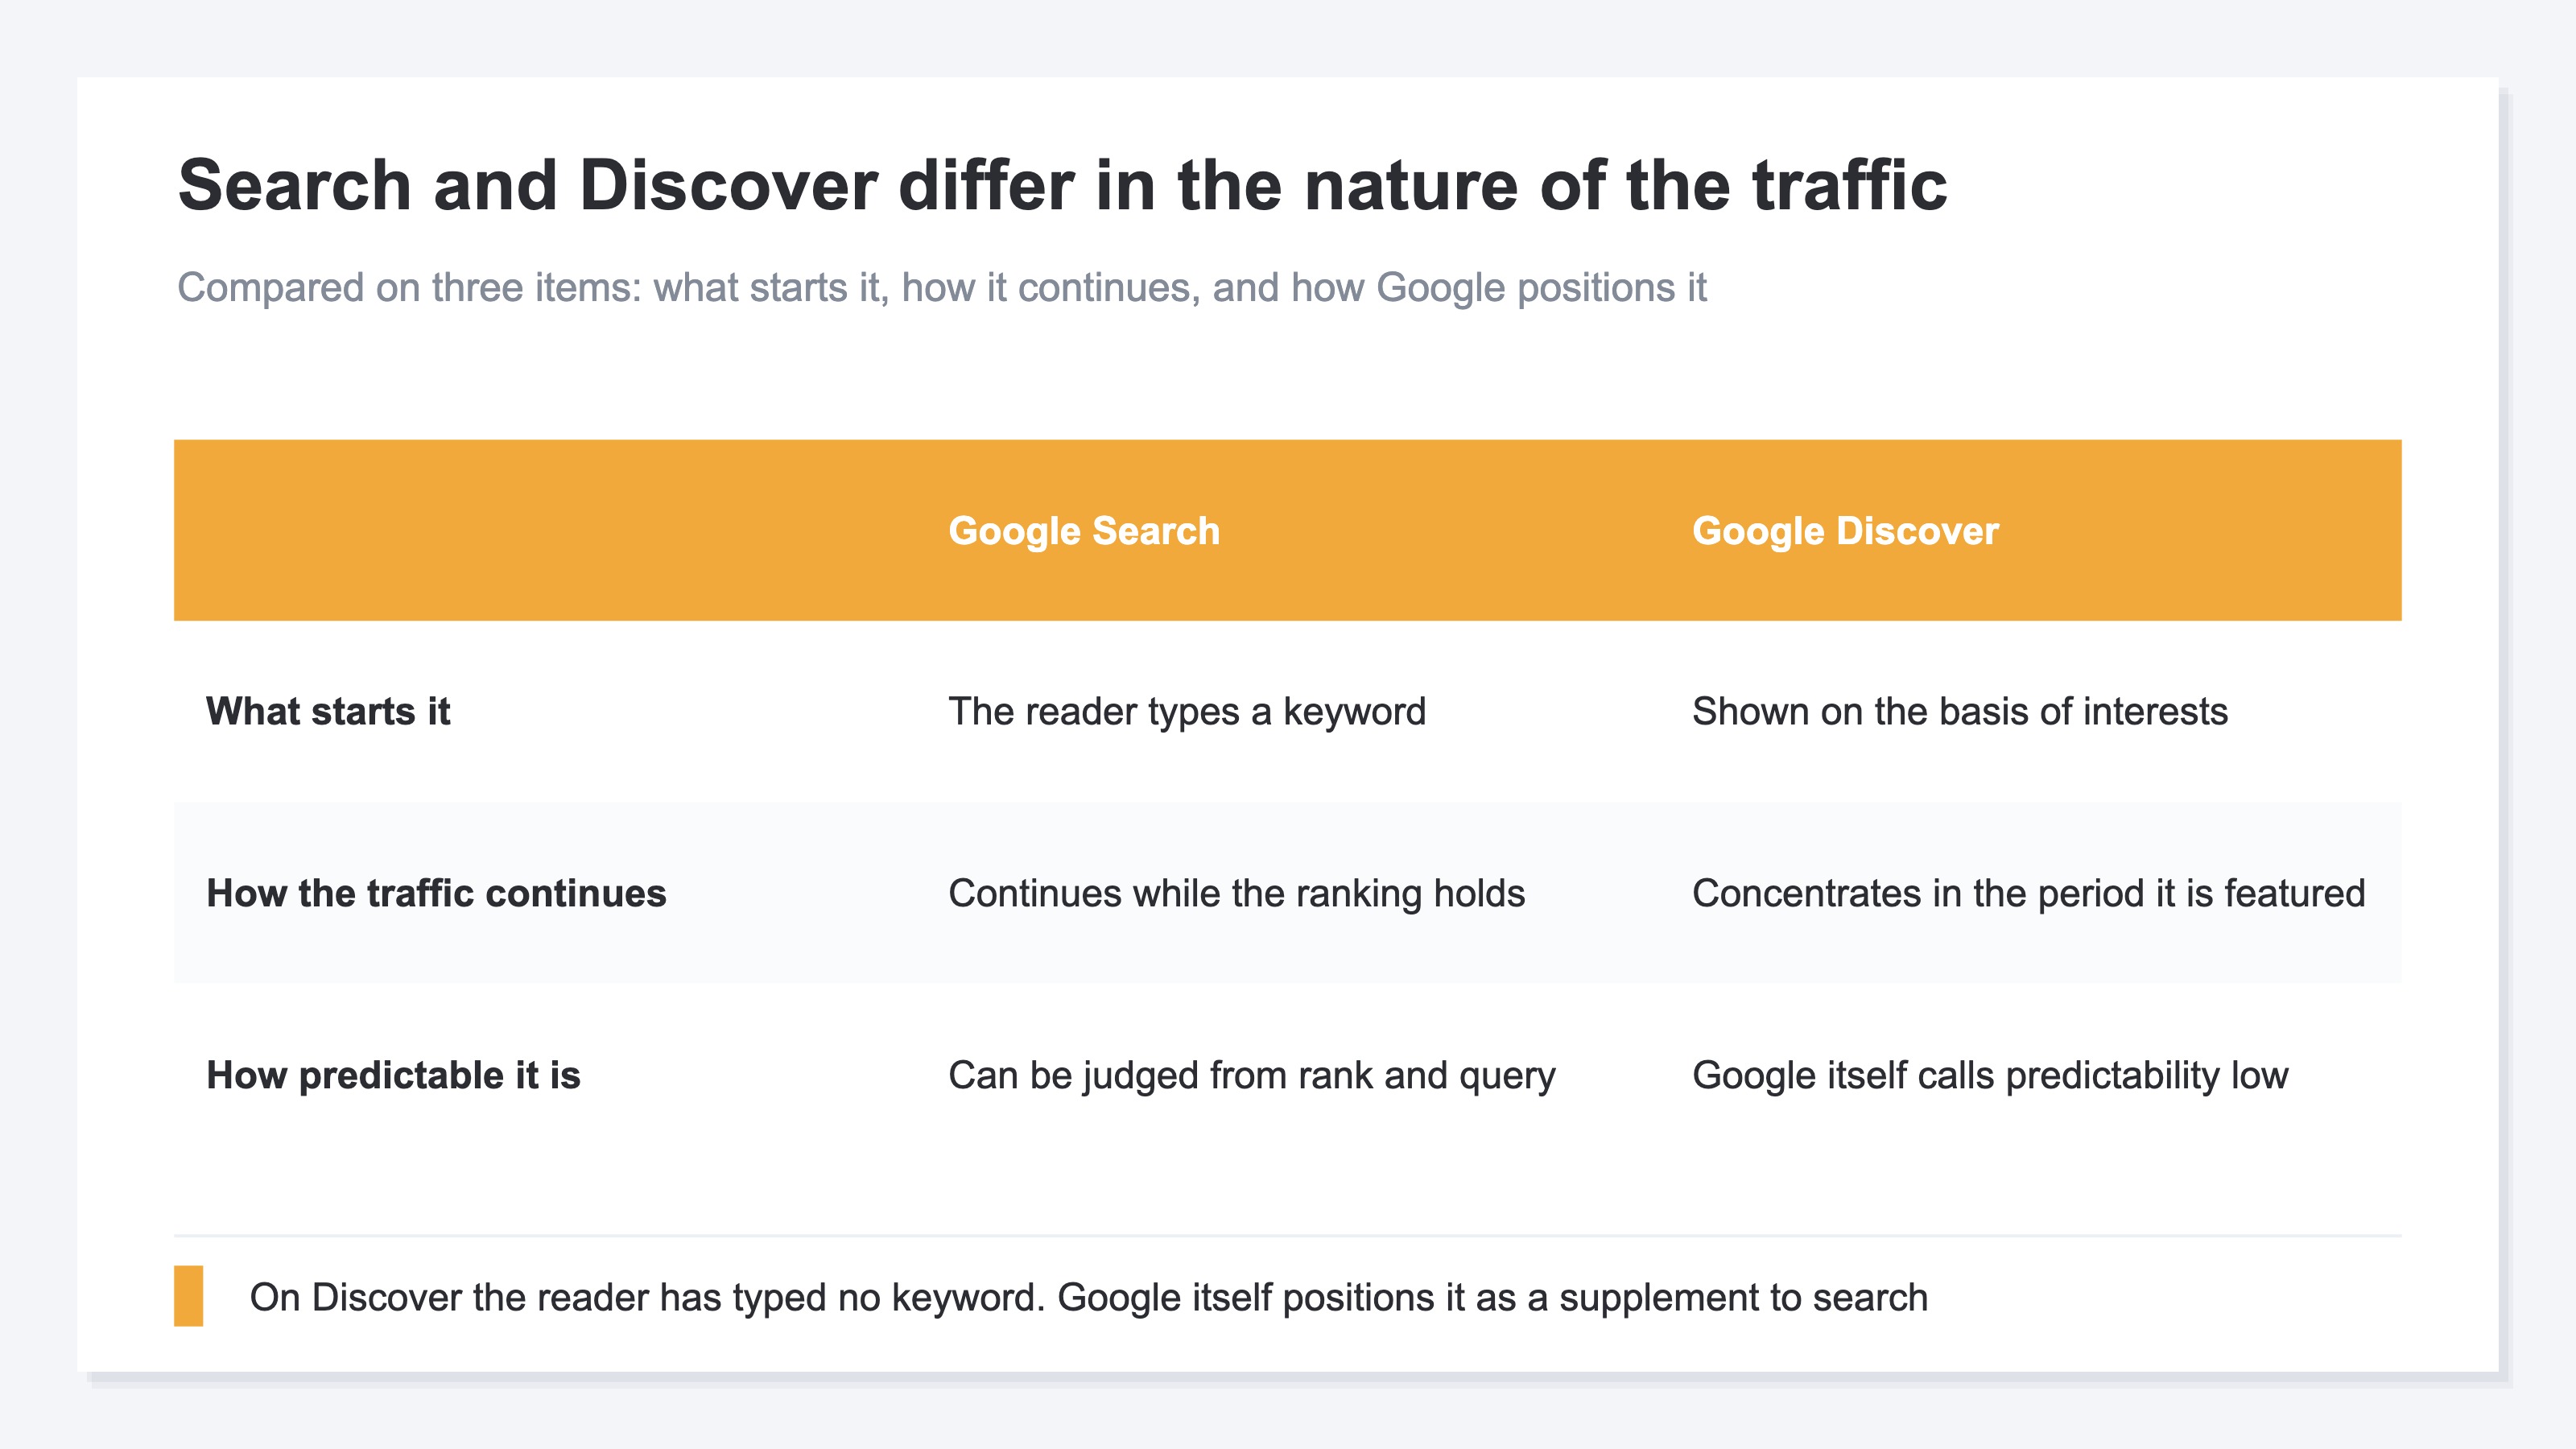
Google states this property itself. Traffic from Discover is less predictable and less reliable than traffic from keyword search, so it should be thought of as supplementary to keyword search traffic[1]. Designing a route that the official documentation places as supplementary into your main battleground does not hold up.
At this point most people think in two options. Build articles for Discover so the next one gets picked up too, or forget the whole thing as a one-time event. Both of these options are trying to decide from the volume of exposure alone. They tell you how many people came, but neither side answers whether those visits meant anything to your business. That is settled afterwards.
2. The Shape of the Decay Tells You Whether It Lasts#
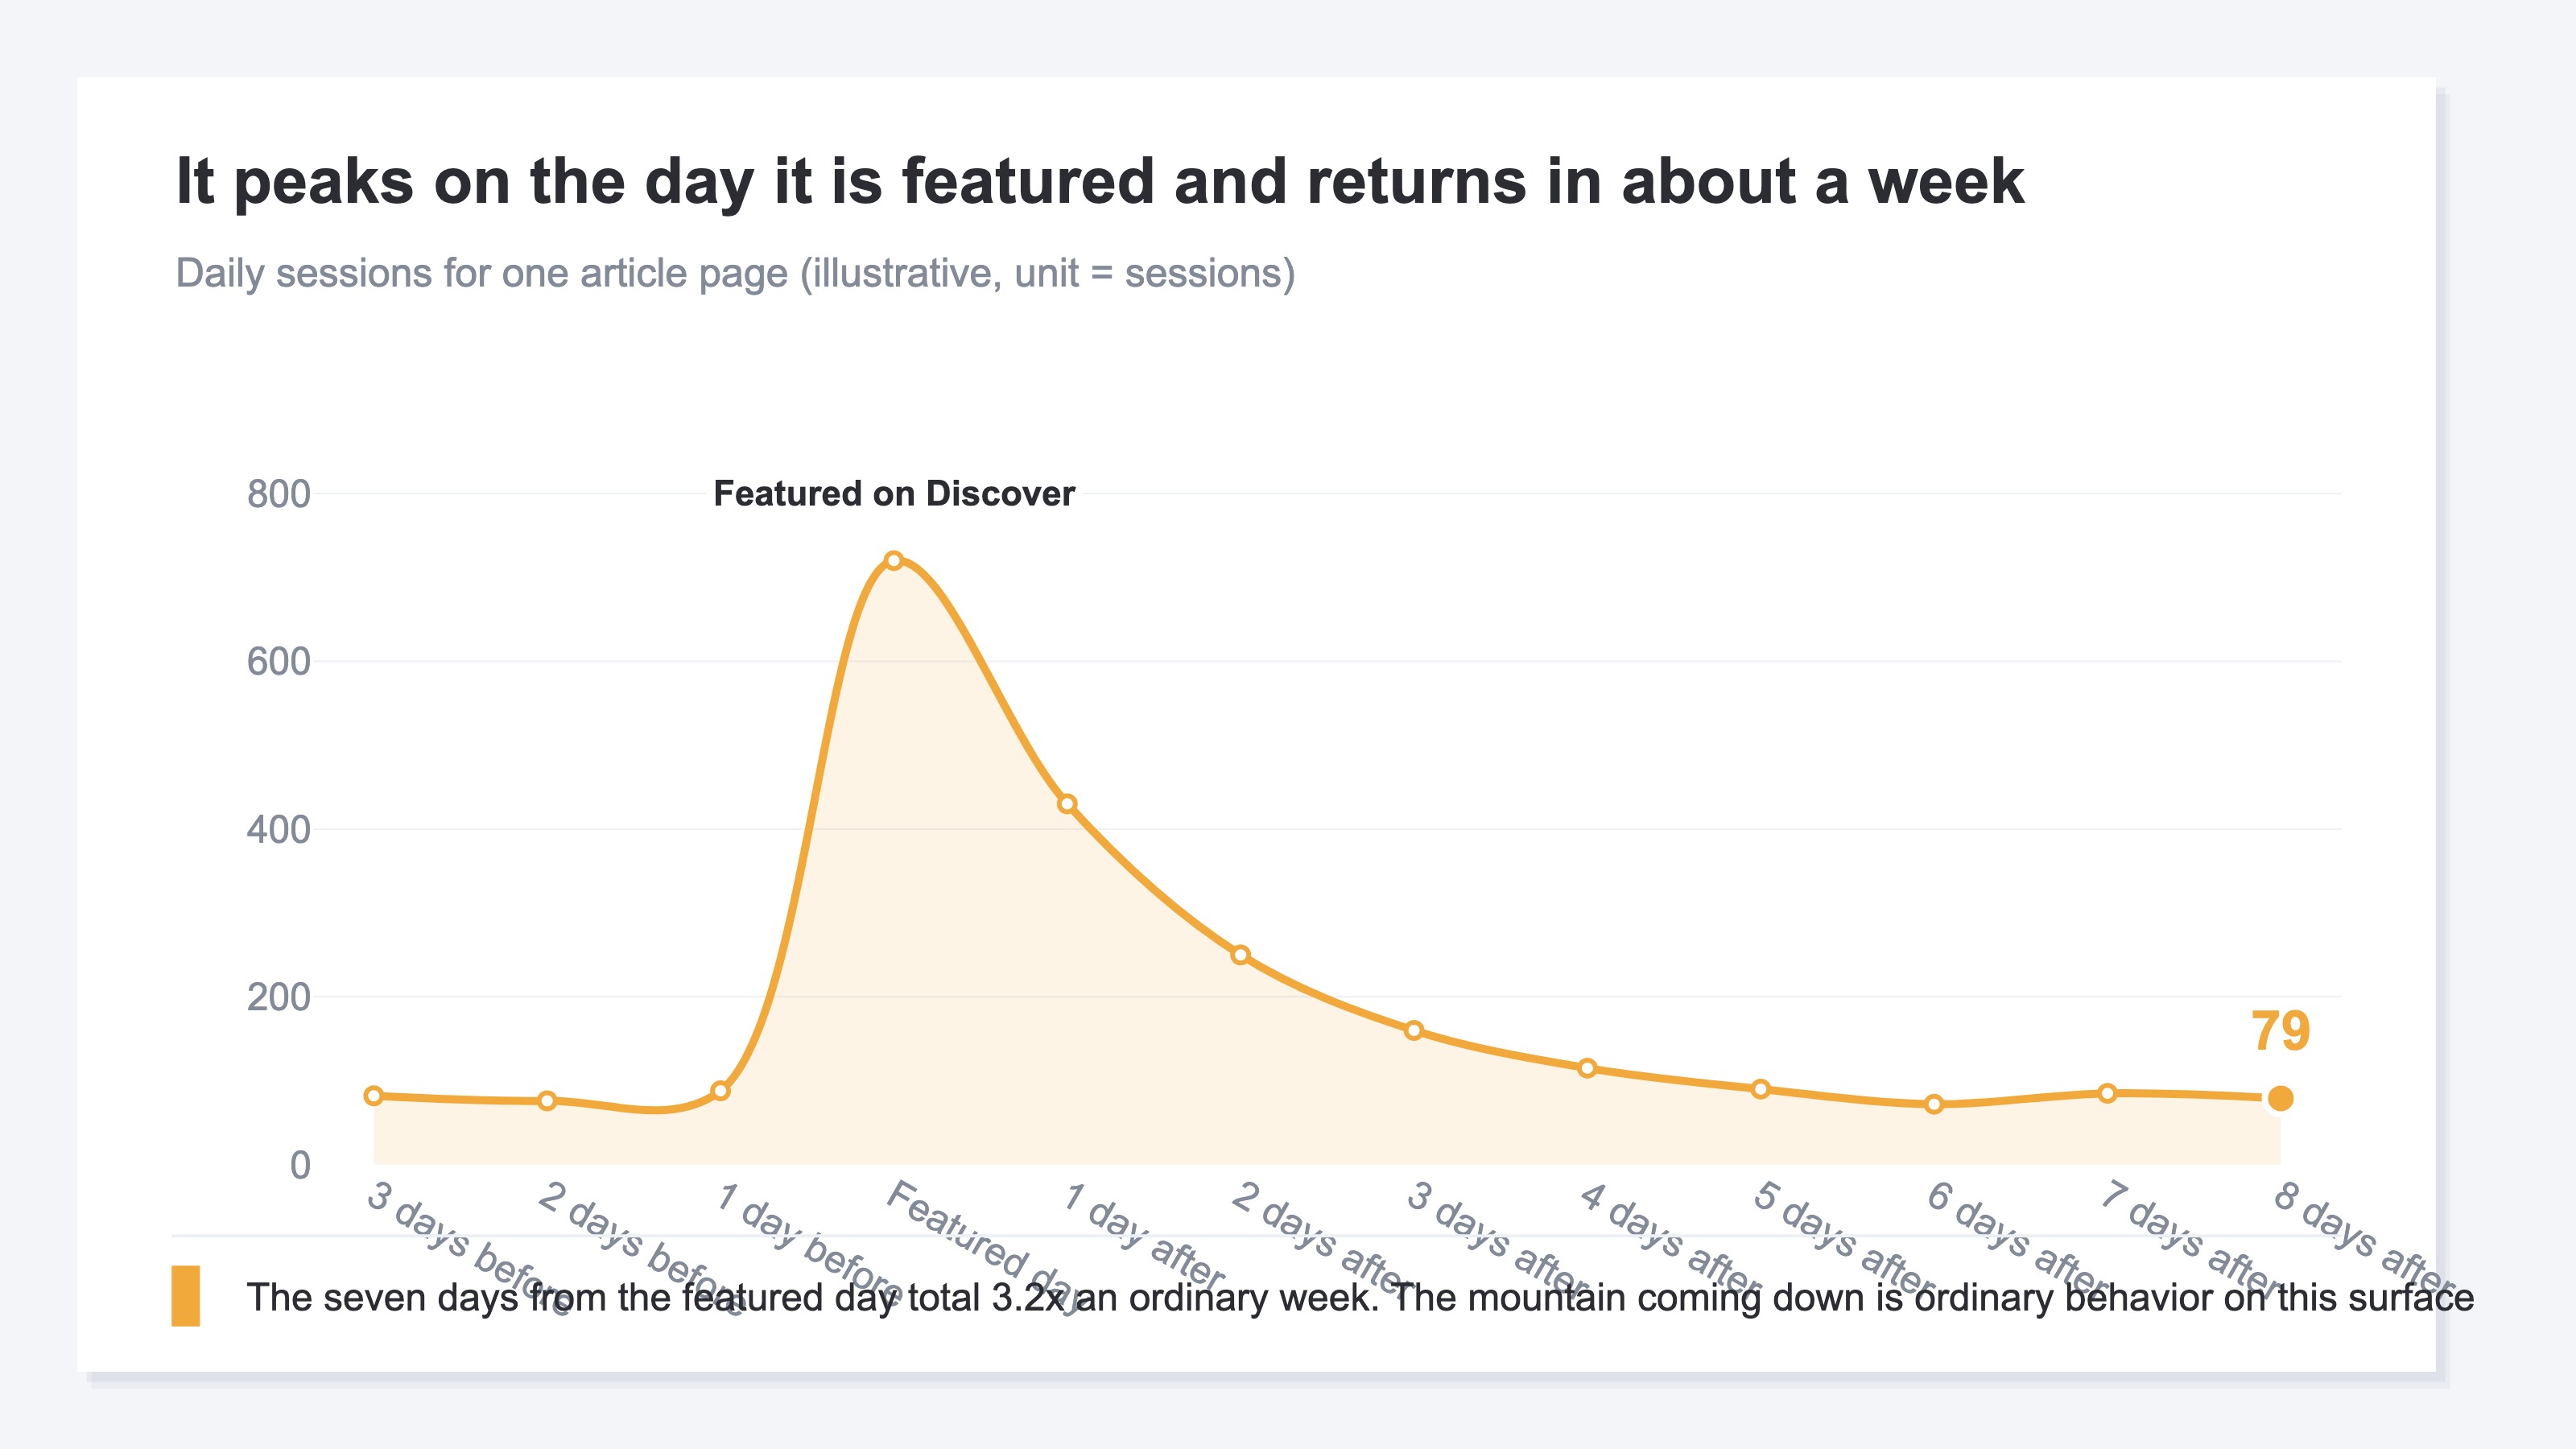
Compare daily sessions for a page that surged and the shape has a signature. It rises all at once on the day the page is featured, then works its way back to the original level over several days. The right side of the mountain slopes down gently.
Whether the source is Discover can be confirmed in the Performance report (Discover) in Google Search Console. That report, however, appears only for properties that reach a minimum required number of impressions on Discover[2]. Discover results are recorded separately from search, so if the search-side figures for the same period have not moved, the increase can be judged as coming from Discover. Platform properties, which show exposure for posts on X and YouTube, sit in a separate frame from this one, and how to read them is laid out in Search Console adds platform properties.
One more thing: before you take a sudden climb in visits at face value, it is worth checking once whether automated access is mixed in. The steps for separating that out are in Suspect bots when GA4 sessions spike. For what to look at on the day of the surge itself, the screen to check the night you go viral is a useful reference.
The decay itself is not a failure. Discover is a surface that behaves this way to begin with. What separates the judgment is not that the mountain finished coming down, but whether revenue arrived while the mountain was there.
3. The Value of Chasing Is Set by the Revenue From the Spike#
Compare an ordinary week and the week of the surge on the same basis. Set the ordinary week at 100 and look at what the surge week reads for sessions and for revenue.
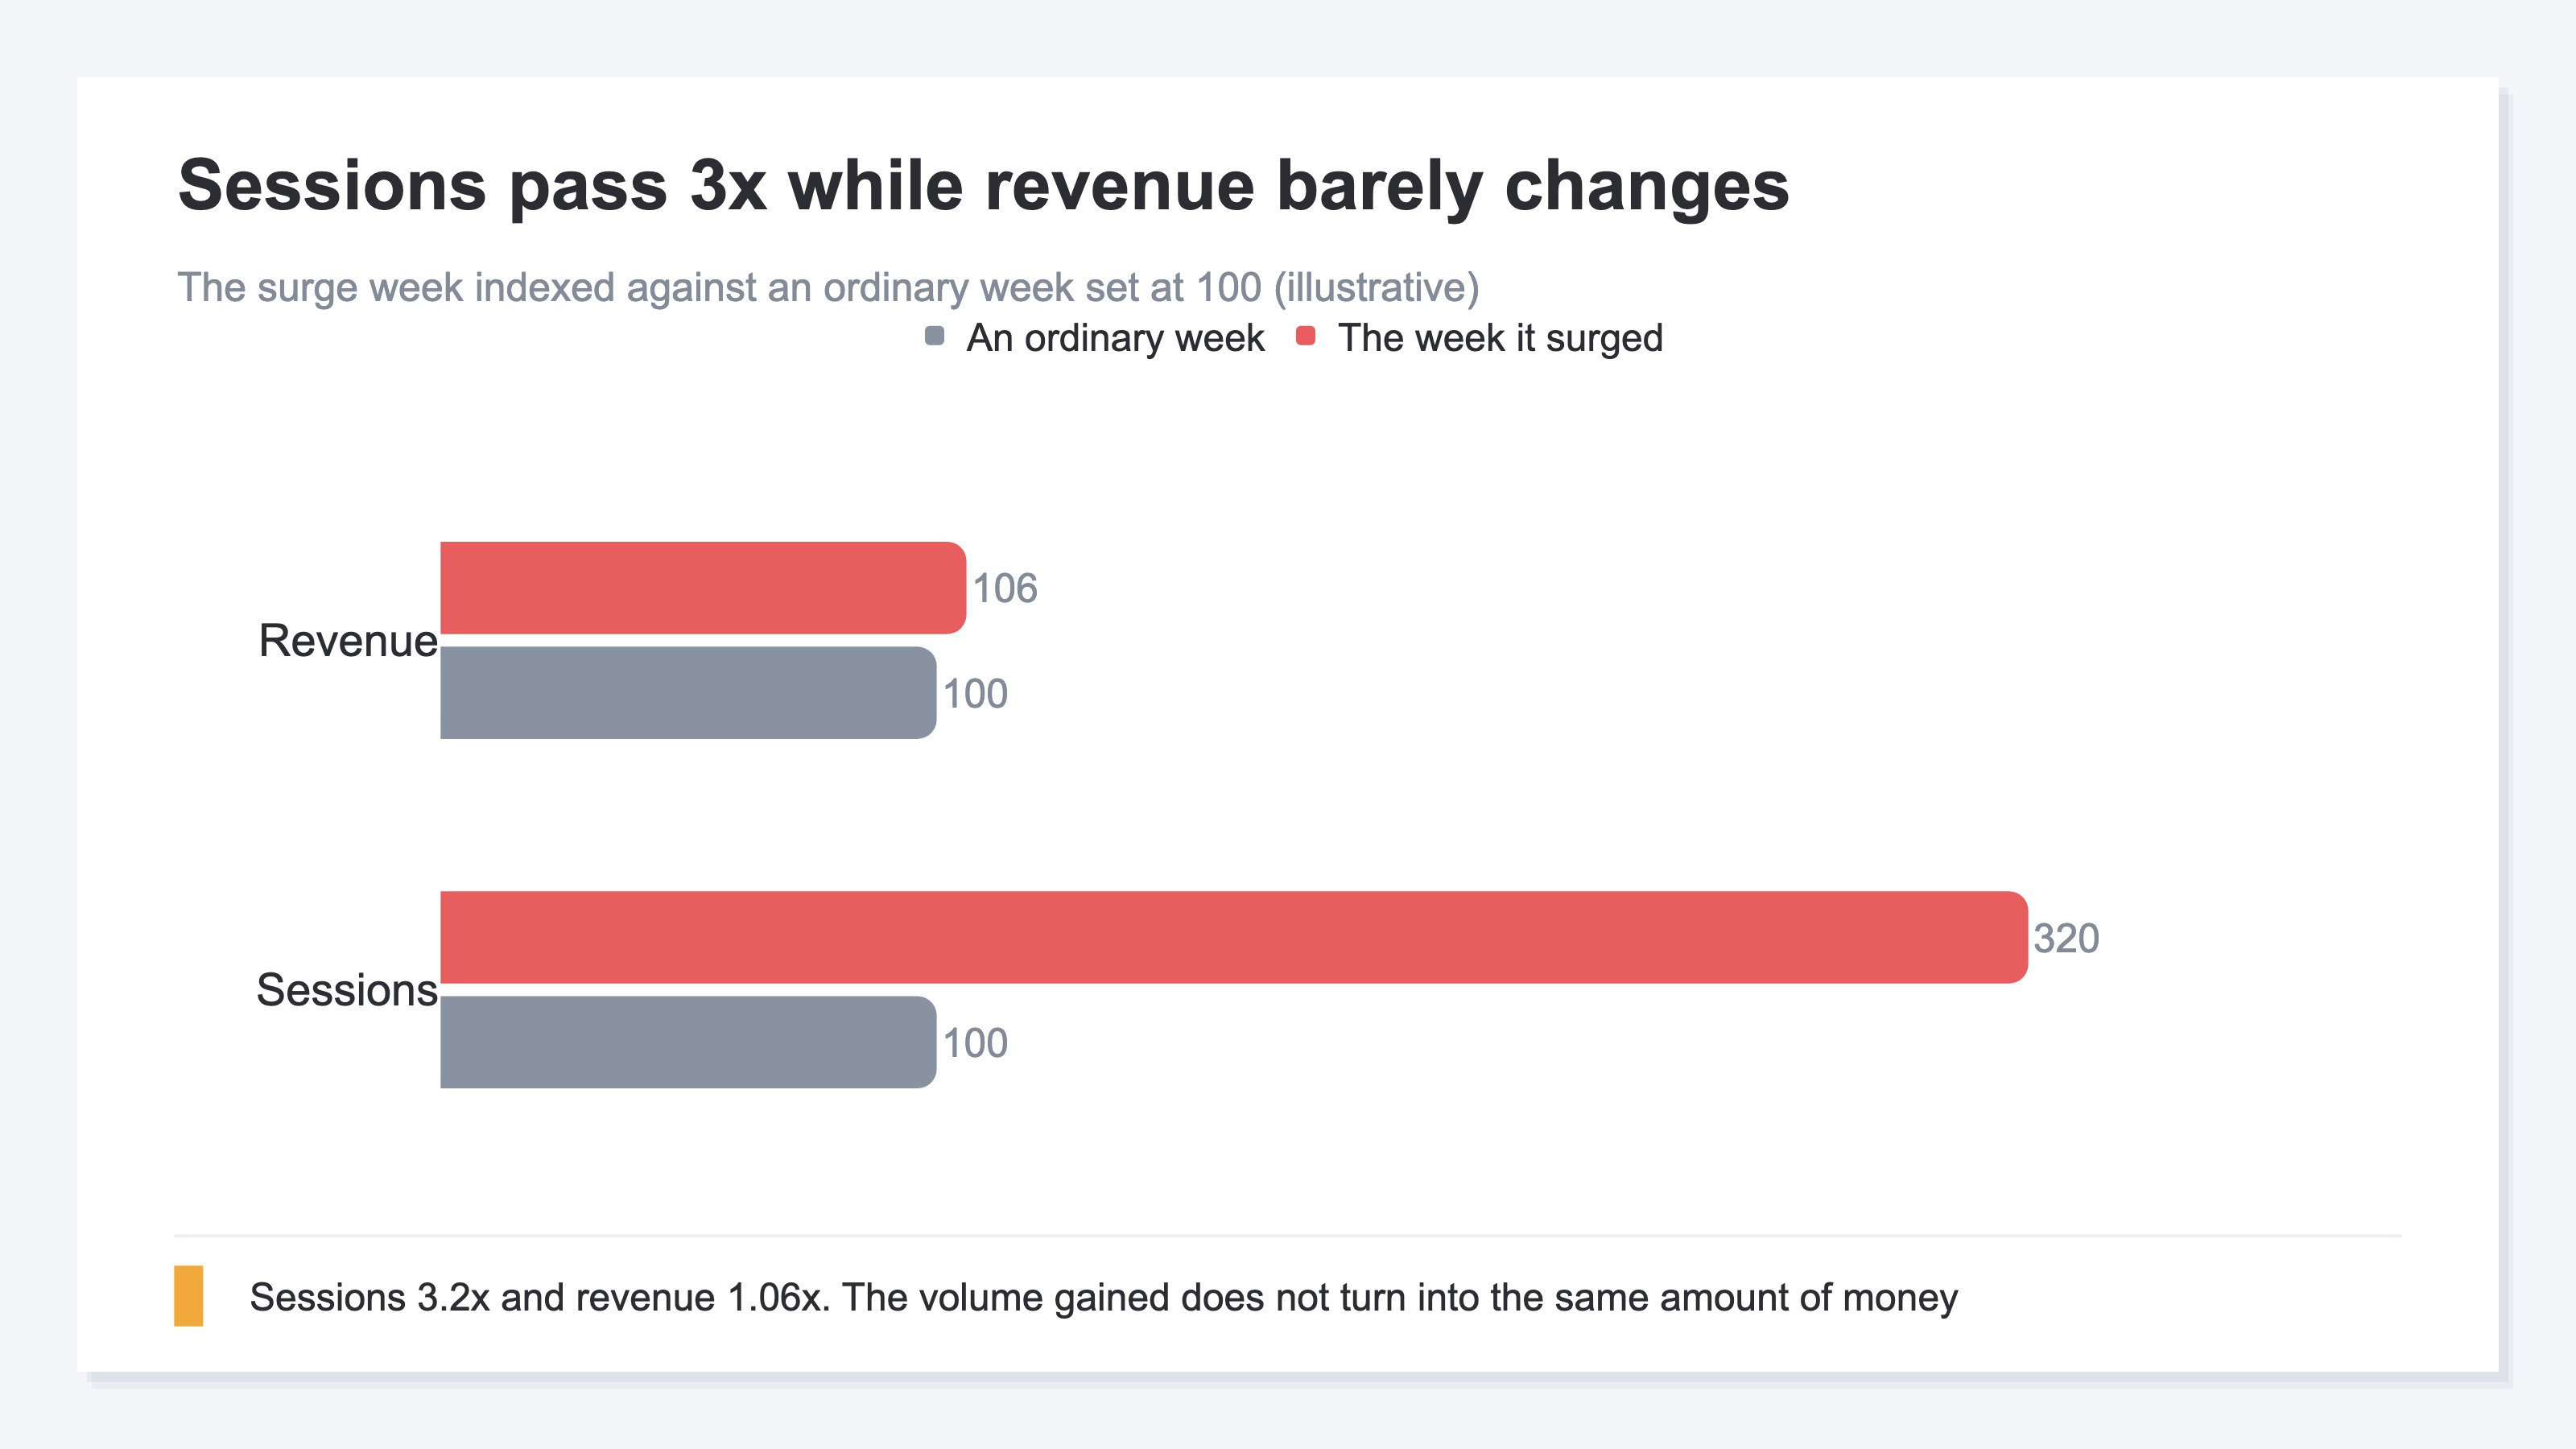
Sessions more than 3x while revenue barely changes is a common shape. Readers shown a page on the basis of interests did not arrive at it with a purchase in mind. In this case, writing one more article of the same type adds visits of the same nature. What is worth keeping as a lesson goes as far as the fact that "this subject gets picked up on Discover," and no further; it is not grounds for reshuffling the priority of your work.
If revenue climbed alongside, the story changes. That article turned out to be content that carried Discover readers as far as a purchase, so the subject and the structure are worth breaking down and putting to use next time. The general way to read a mismatch between traffic volume and revenue is in traffic up but revenue flat, and the axes for judging traffic quality itself are covered in read traffic quality in three layers.
By this point the question you have to answer has become a different one. Before "should we aim at Discover," you have to answer "how much did the surge leave with us." And answering the second one takes a different kind of data than the impressions and clicks used on the exposure side: the amount that visits entering through that page finally produced.
RevenueScope solution
RevenueScope lists the content pages that have exposure in Google search, and shows landing sessions and landing revenue for each page on the same row.
Landing revenue is the amount that visits entering through that page finally produced, added up onto the page they entered from. Visits judged to be bots are excluded from measurement. Look at the row for the page that surged and you can read straight off how much purchasing the visits it gathered led to. Ask the same question for a different period and you can compare the surge week and an ordinary week in the same form. Producing landing revenue for the surged page period by period is where RevenueScope stops; the record of the exposure itself sits on the Google Search Console side.
Asking RevenueScope about the content pages of fictional store A (illustrative)
| Page | Landing sessions | Landing revenue |
|---|---|---|
| Article rounding up summer sun protection | 4,820 | ¥0 |
| How to choose lotion for sensitive skin | 610 | ¥240,000 |
| Refill size comparison | 380 | ¥110,000 |
| Gift wrapping options | 210 | ¥40,000 |
Note: the table above is one example built for explanation. The demo screen is displayed with the sample store's sample data, refreshed daily, so the page names and the amounts there are separate from the ones shown here.
The top row, the one that stands out on sessions, is the only one reading ¥0 in the landing revenue column. An article that Discover picked up and that gathered 4,820 visits led to not one purchase. First in volume gathered, and still no reason here to build the next plan around this article. What to consider first is whether the subjects that do carry revenue can be moved toward a shape that gets featured on Discover.
FAQ#
Frequently asked questions#
Q. Is there a way to get onto Google Discover?
A. Google has not put forward any means of guaranteeing placement. The official documentation itself calls it traffic with low predictability[1], so treating it as a supplement to search is the realistic stance. Rather than building for it deliberately, it is more certain to be in a state where you can measure it when you do get picked up.
Q. Should we rewrite the page that surged?
A. It is worth considering for a page where landing revenue arrived. For a page with plenty of traffic and revenue still at zero, fixing it adds visits of the same nature.
Q. Which channel does Discover traffic fall into in GA4?
A. Google's published list of channel definitions shows no independent channel called Discover[3]. Rather than tracking it by channel name, it is more certain to look at it per page that served as the entry point.
Summary#
Think about a surge from Google Discover as the two options of chasing it or forgetting it, and either choice gets decided on the volume of exposure alone. The material for the judgment is whether revenue arrived from that entry page during the days the spike was running.
The shape of the decay does not by itself mean failure. Discover is a supplementary route that the official documentation calls hard to predict, and the mountain coming down is ordinary behavior. What to look at is the result of comparing sessions and revenue for the period the mountain was there against an ordinary week on the same index. If only sessions stretched and revenue did not move, writing one more article on the same subject will not change the result.
See which ads actually drive revenue, at a glance
Free up to 5,000 sessions/month, AI connection included. No credit card required. Up and running in 5 minutes.