
Have you ever looked at "average engagement time" in GA4 and been surprised at how short it is? An article that should take a minute to read shows up in the thirty-second range. You wrote it with care — is nobody actually reading it? It's an unsettling number.
Here's the conclusion first. Because of how GA4 measures it, time on site can come out shorter than it feels. Time spent in another tab isn't counted, and the time on the last page of a visit rarely makes it into the totals. So deciding "short = not being read" is premature. In this article we'll walk through the blind spots in the measurement and a step-by-step way to tell whether a short number is a quirk of the spec or a real exit. Then we'll show, with actual data, how to check the quality of time on site against revenue.
Table of contents
TL;DR#
-
GA4's engagement time is "time in the foreground"
It only counts the time a page was open at the very front of the browser. Time in other tabs, and the final stretch just before leaving, rarely show up in the number
-
Shorter-than-it-feels can be the spec, not your content
If every page is uniformly short, or only one channel is extremely short, suspect the measurement spec first
-
To sort it out, break it down by channel, device, and page, then cross-check with read-through rate
If a specific page has both short time on site and a low read-through rate, the odds are high it really isn't being read
-
Judge the quality of time on site by revenue
Longer time ≠ read. Line up time on site × read-through × revenue to decide which page to fix next
1. What GA4 engagement time actually measures#
Bottom line: GA4's "average engagement time" is the average time a page was displayed in the foreground — at the very front of the browser. It isn't a stopwatch running from the start of a visit to the end. The rule is that the counter advances only while the page is in front.
GA4 records user actions in units called events, and time on site is assembled from those events. A companion concept worth knowing is the "engaged session." A visit counts as engaged only if it meets one of these: it lasted 10 seconds or more, a conversion happened, or two or more pages were viewed.
In other words, GA4's time metric is an approximation of "how much this seems to have been read." Its calculation is entirely different from "average session duration" in the old Universal Analytics, so you can't compare it against your old numbers. We've laid out the basics of how these units are counted here (Sessions, pageviews, and unique users: the difference).
2. The measurement blind spots that shorten the number#
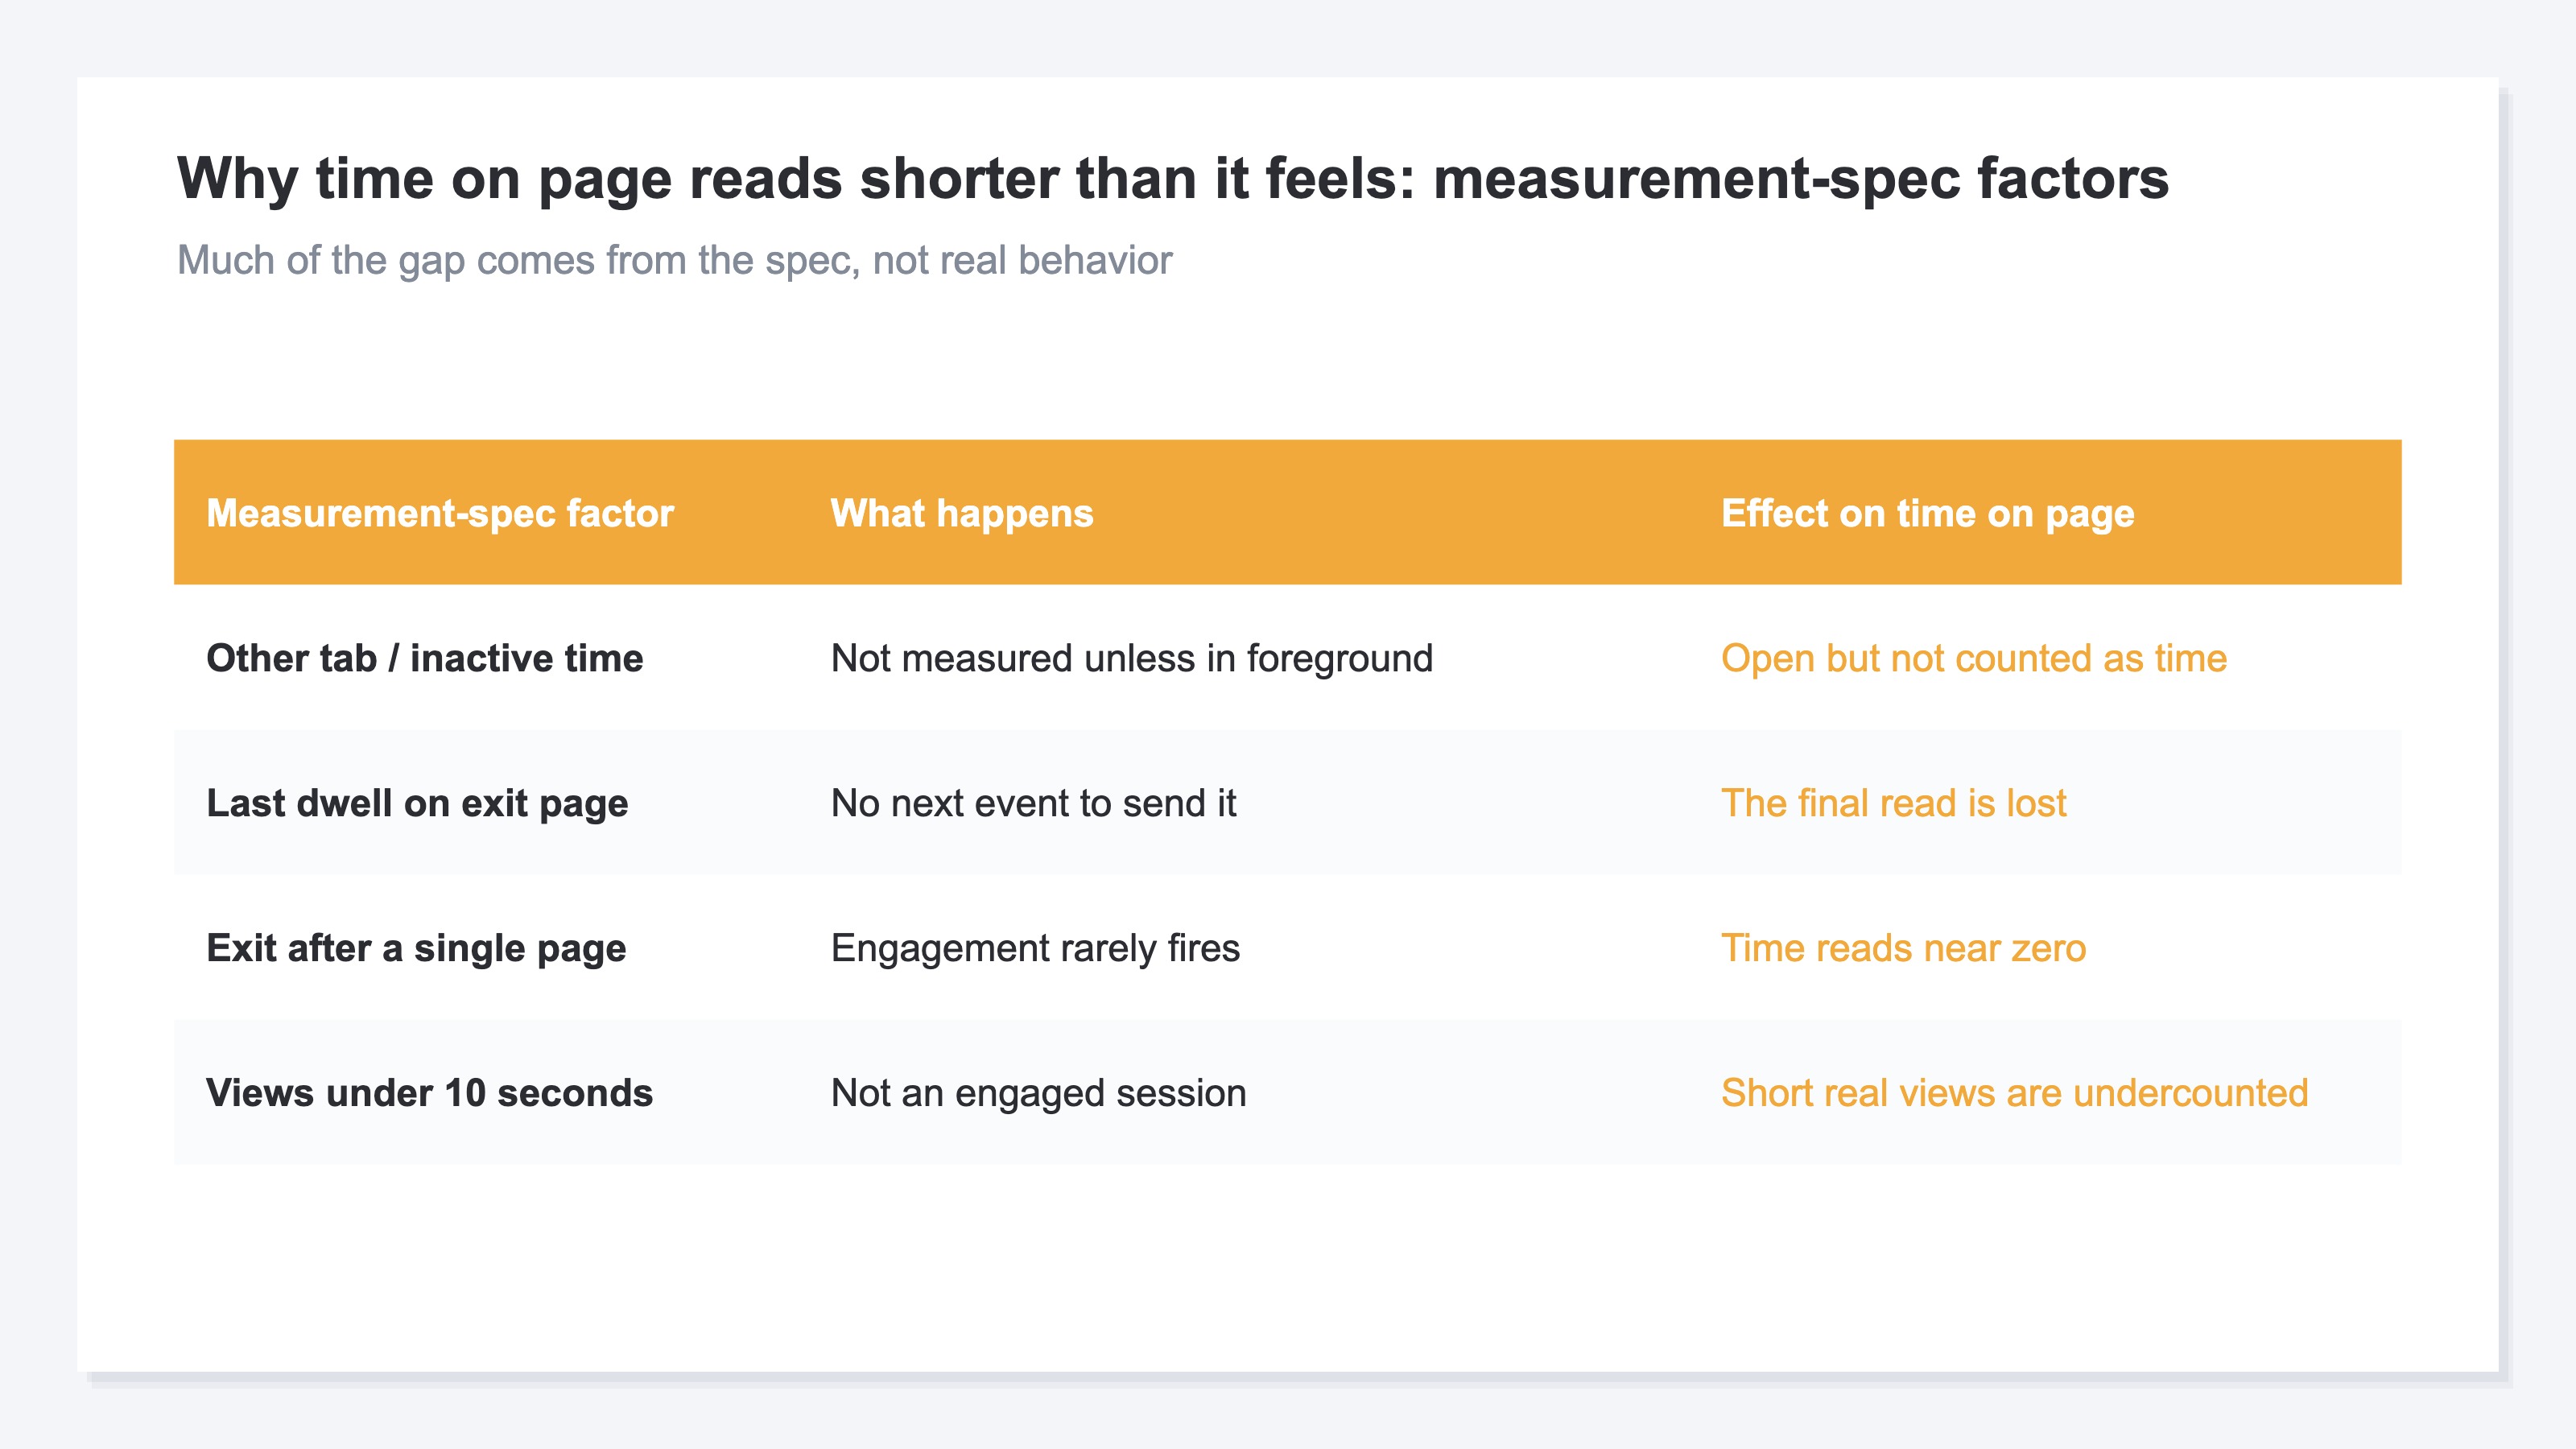
Bottom line: There are three main reasons the number comes out shorter than it feels: time in other tabs isn't counted, the time on the last page rarely gets sent, and single-page exits leave almost no time at all.
The first is other tabs. If a visitor opens your article and switches to another tab or app, the counter stops for that entire stretch. This is where the felt "time it was open" and the number start to drift apart.
The second is the last page of a visit. Time-on-page information is sent when the visitor moves to the next page or at breaks in activity. But at the moment the visitor closes the tab, that event sometimes never gets sent. Ironically, the visits that read carefully, feel satisfied, and close the tab are the ones whose final stretch never makes it into the number.
The third is visits that view just one page and leave. With no "next pageview" to mark a boundary, if the visit lasts under 10 seconds with no interaction, the time is recorded as roughly zero (Bounce rate vs. exit rate: the difference).
3. How to tell a measurement quirk from a real exit#
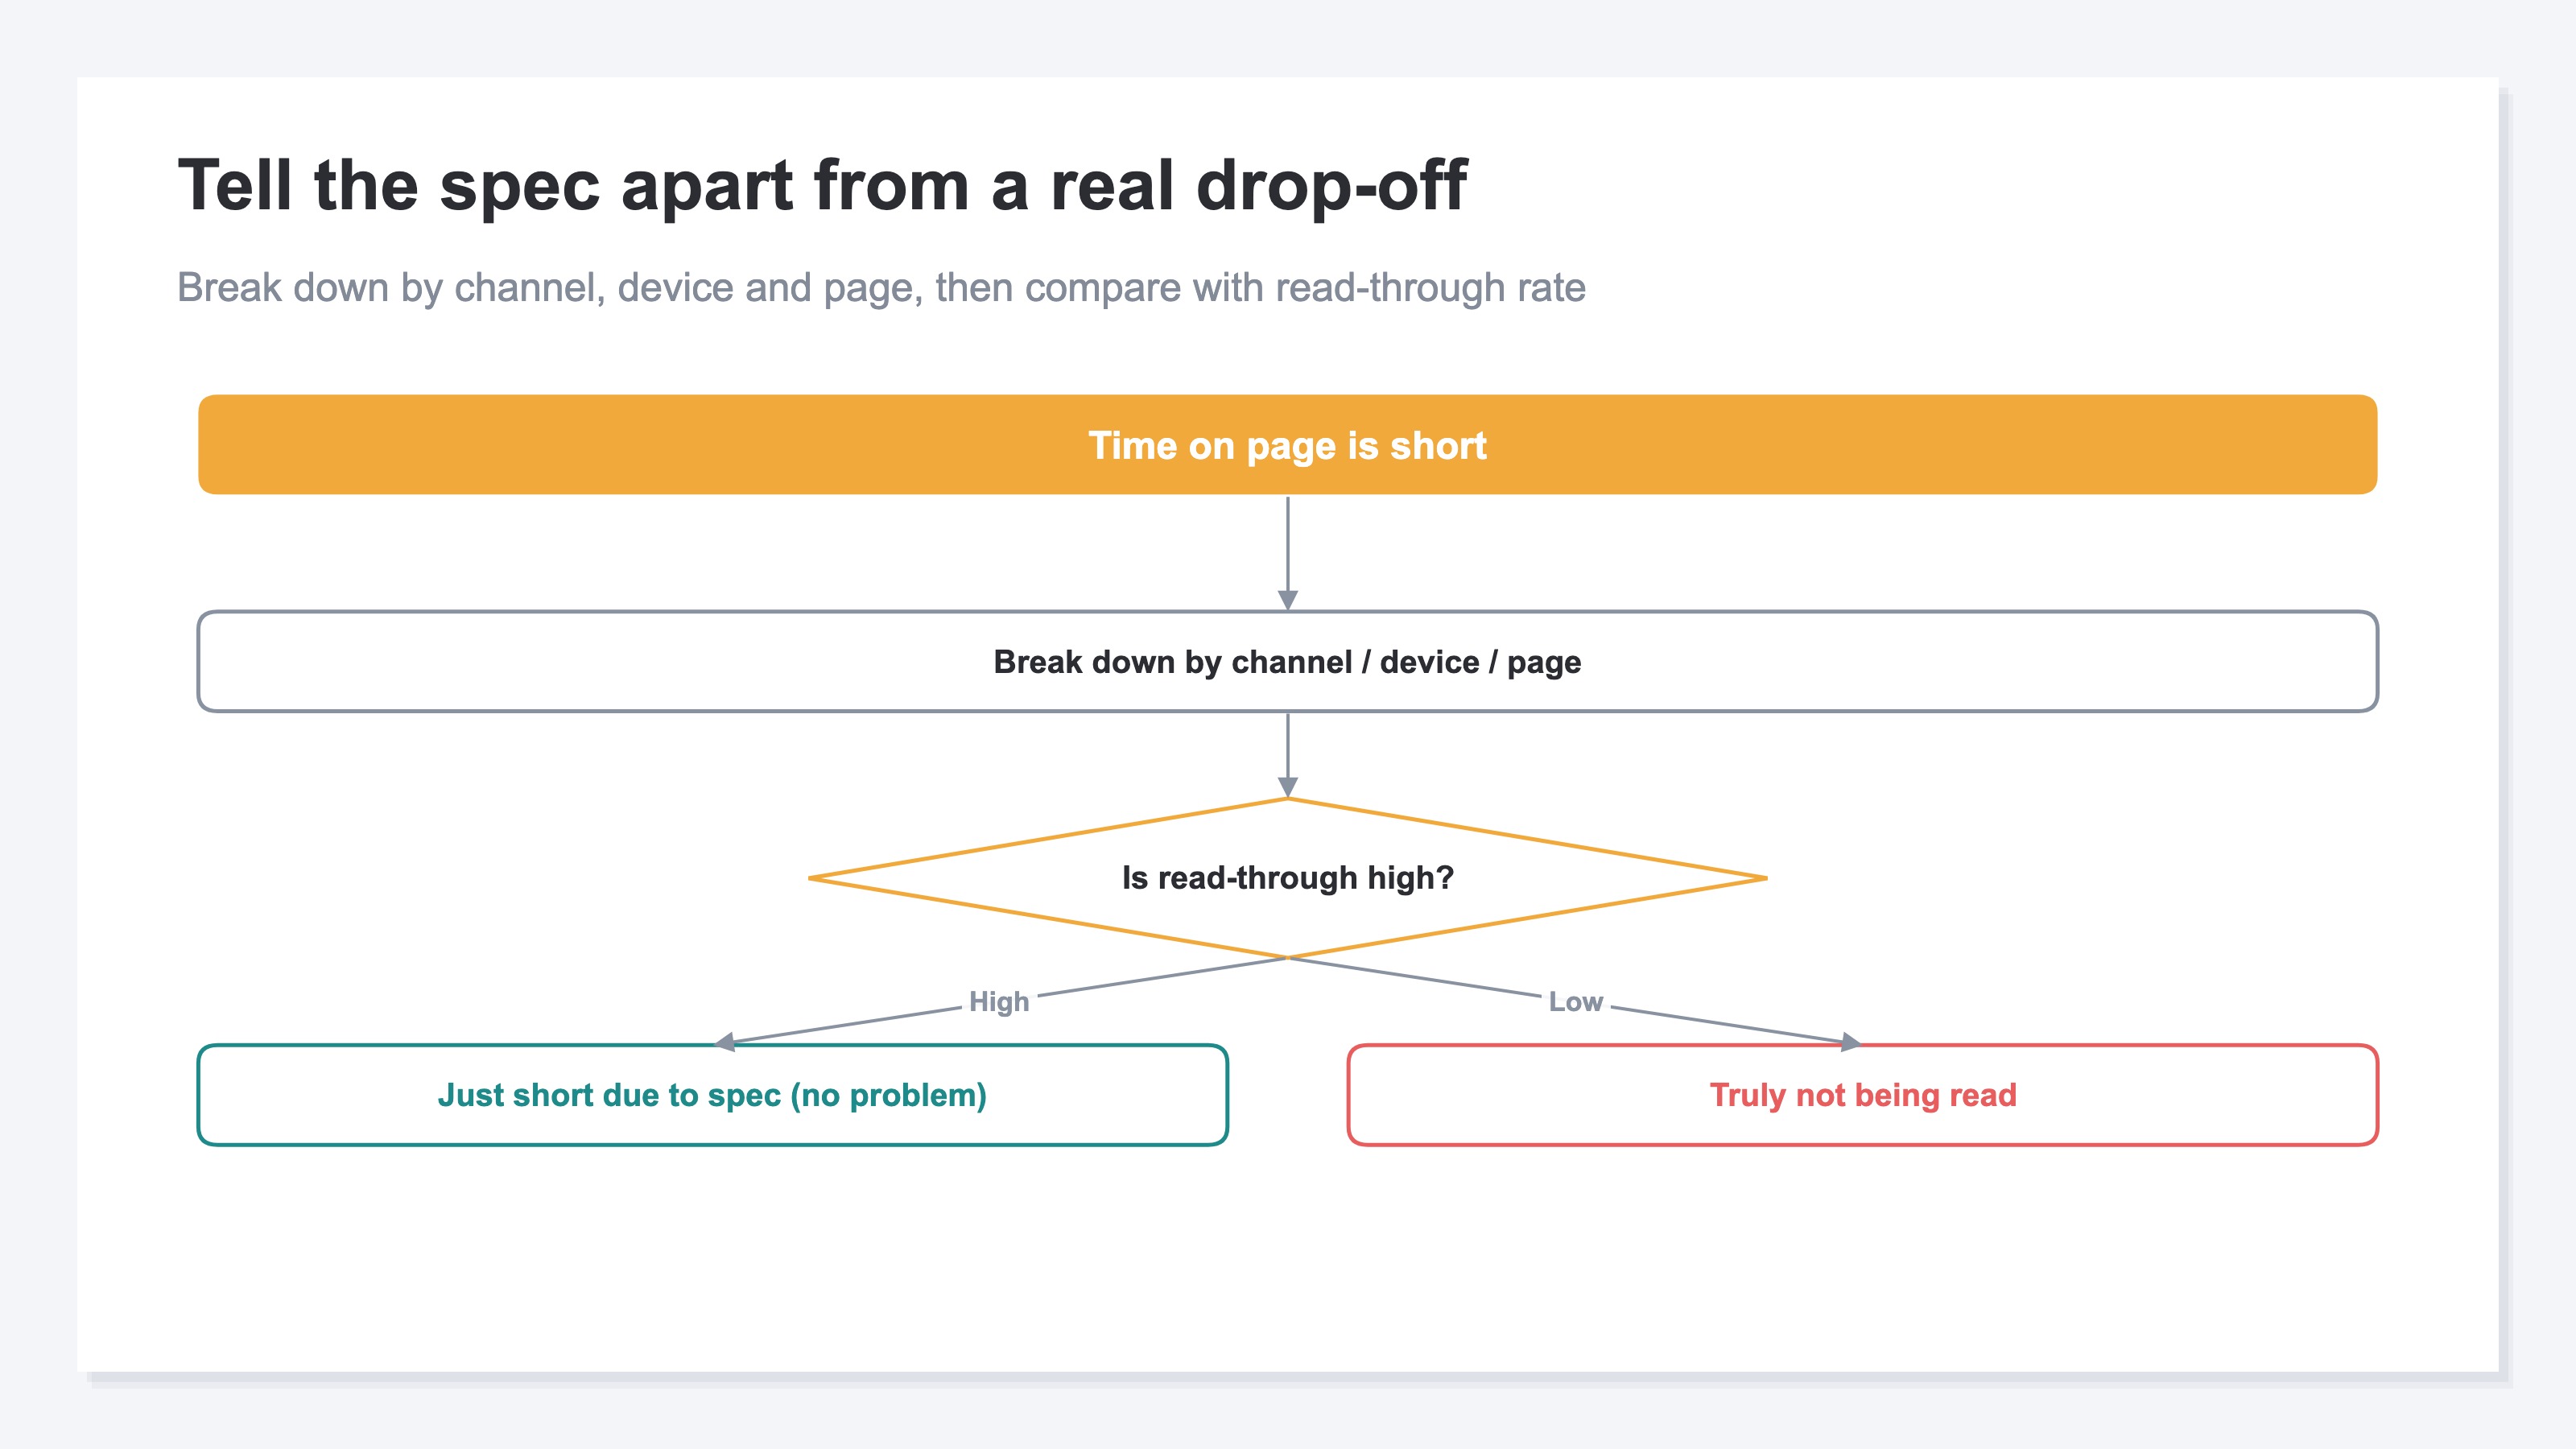
Bottom line: When you find a short engagement time, first sort out whether it's the spec or a real failure to be read. The procedure: break it down into three units — channel, device, and page — and cross-check with the read-through rate (the share of visitors who read a page to the end).
Start with channels. If only traffic via in-app browsers on social apps is extremely short, suspect a skew in the viewing environment. If every channel is uniformly short, a spec-driven cause is more likely. Next, by device: if only mobile is short, page speed joins the list of candidates. Finally, by page: if only a specific page is short, suspect a mismatch between the content and the keywords bringing people in.
The decisive check is the cross-reference with read-through rate. If time on site is short but the read-through rate is high, people are simply reading it quickly — no problem. Conversely, a page where both are low very likely isn't being read (Reading traffic quality through read-through rate).
The idea itself is simple. But cross-referencing this across pages and channels by hand, every time, is a grind. And even after you've done it, the question "so which page do I fix to move revenue?" never comes out of the GA4 screen.
4. Longer time doesn't always mean it was read#
Bottom line: Time on site isn't a metric where longer is always better. A tab left open and forgotten stretches the number, and time spent lost, unable to find the information they came for, also counts as a "long stay."
What matters is connecting the behavior of staying to revenue. Are visits from the long-stay channels actually buying? Should the short-stay channels be cut? The time number alone can't answer these questions. Traffic quality is easier to sort out when you look at it in three layers, in order: volume → behavior → revenue (Viewing traffic quality in three layers).
That's why the metric to view alongside time on site is RPS. RPS is revenue per session — revenue divided by the number of sessions. Only when you line up time on site × read-through × RPS can you finally judge by "did it move revenue" instead of "was it read."
RevenueScope Solution
Bottom line: RevenueScope places average time on site, RPS, and bot-excluded sessions by channel, together with read-through rate (reach rate) by page, on one screen. It doesn't re-measure how long people stayed — it connects the quality of that time to revenue. So you can judge on the spot whether a short-stay channel should be cut, and which page to fix next.
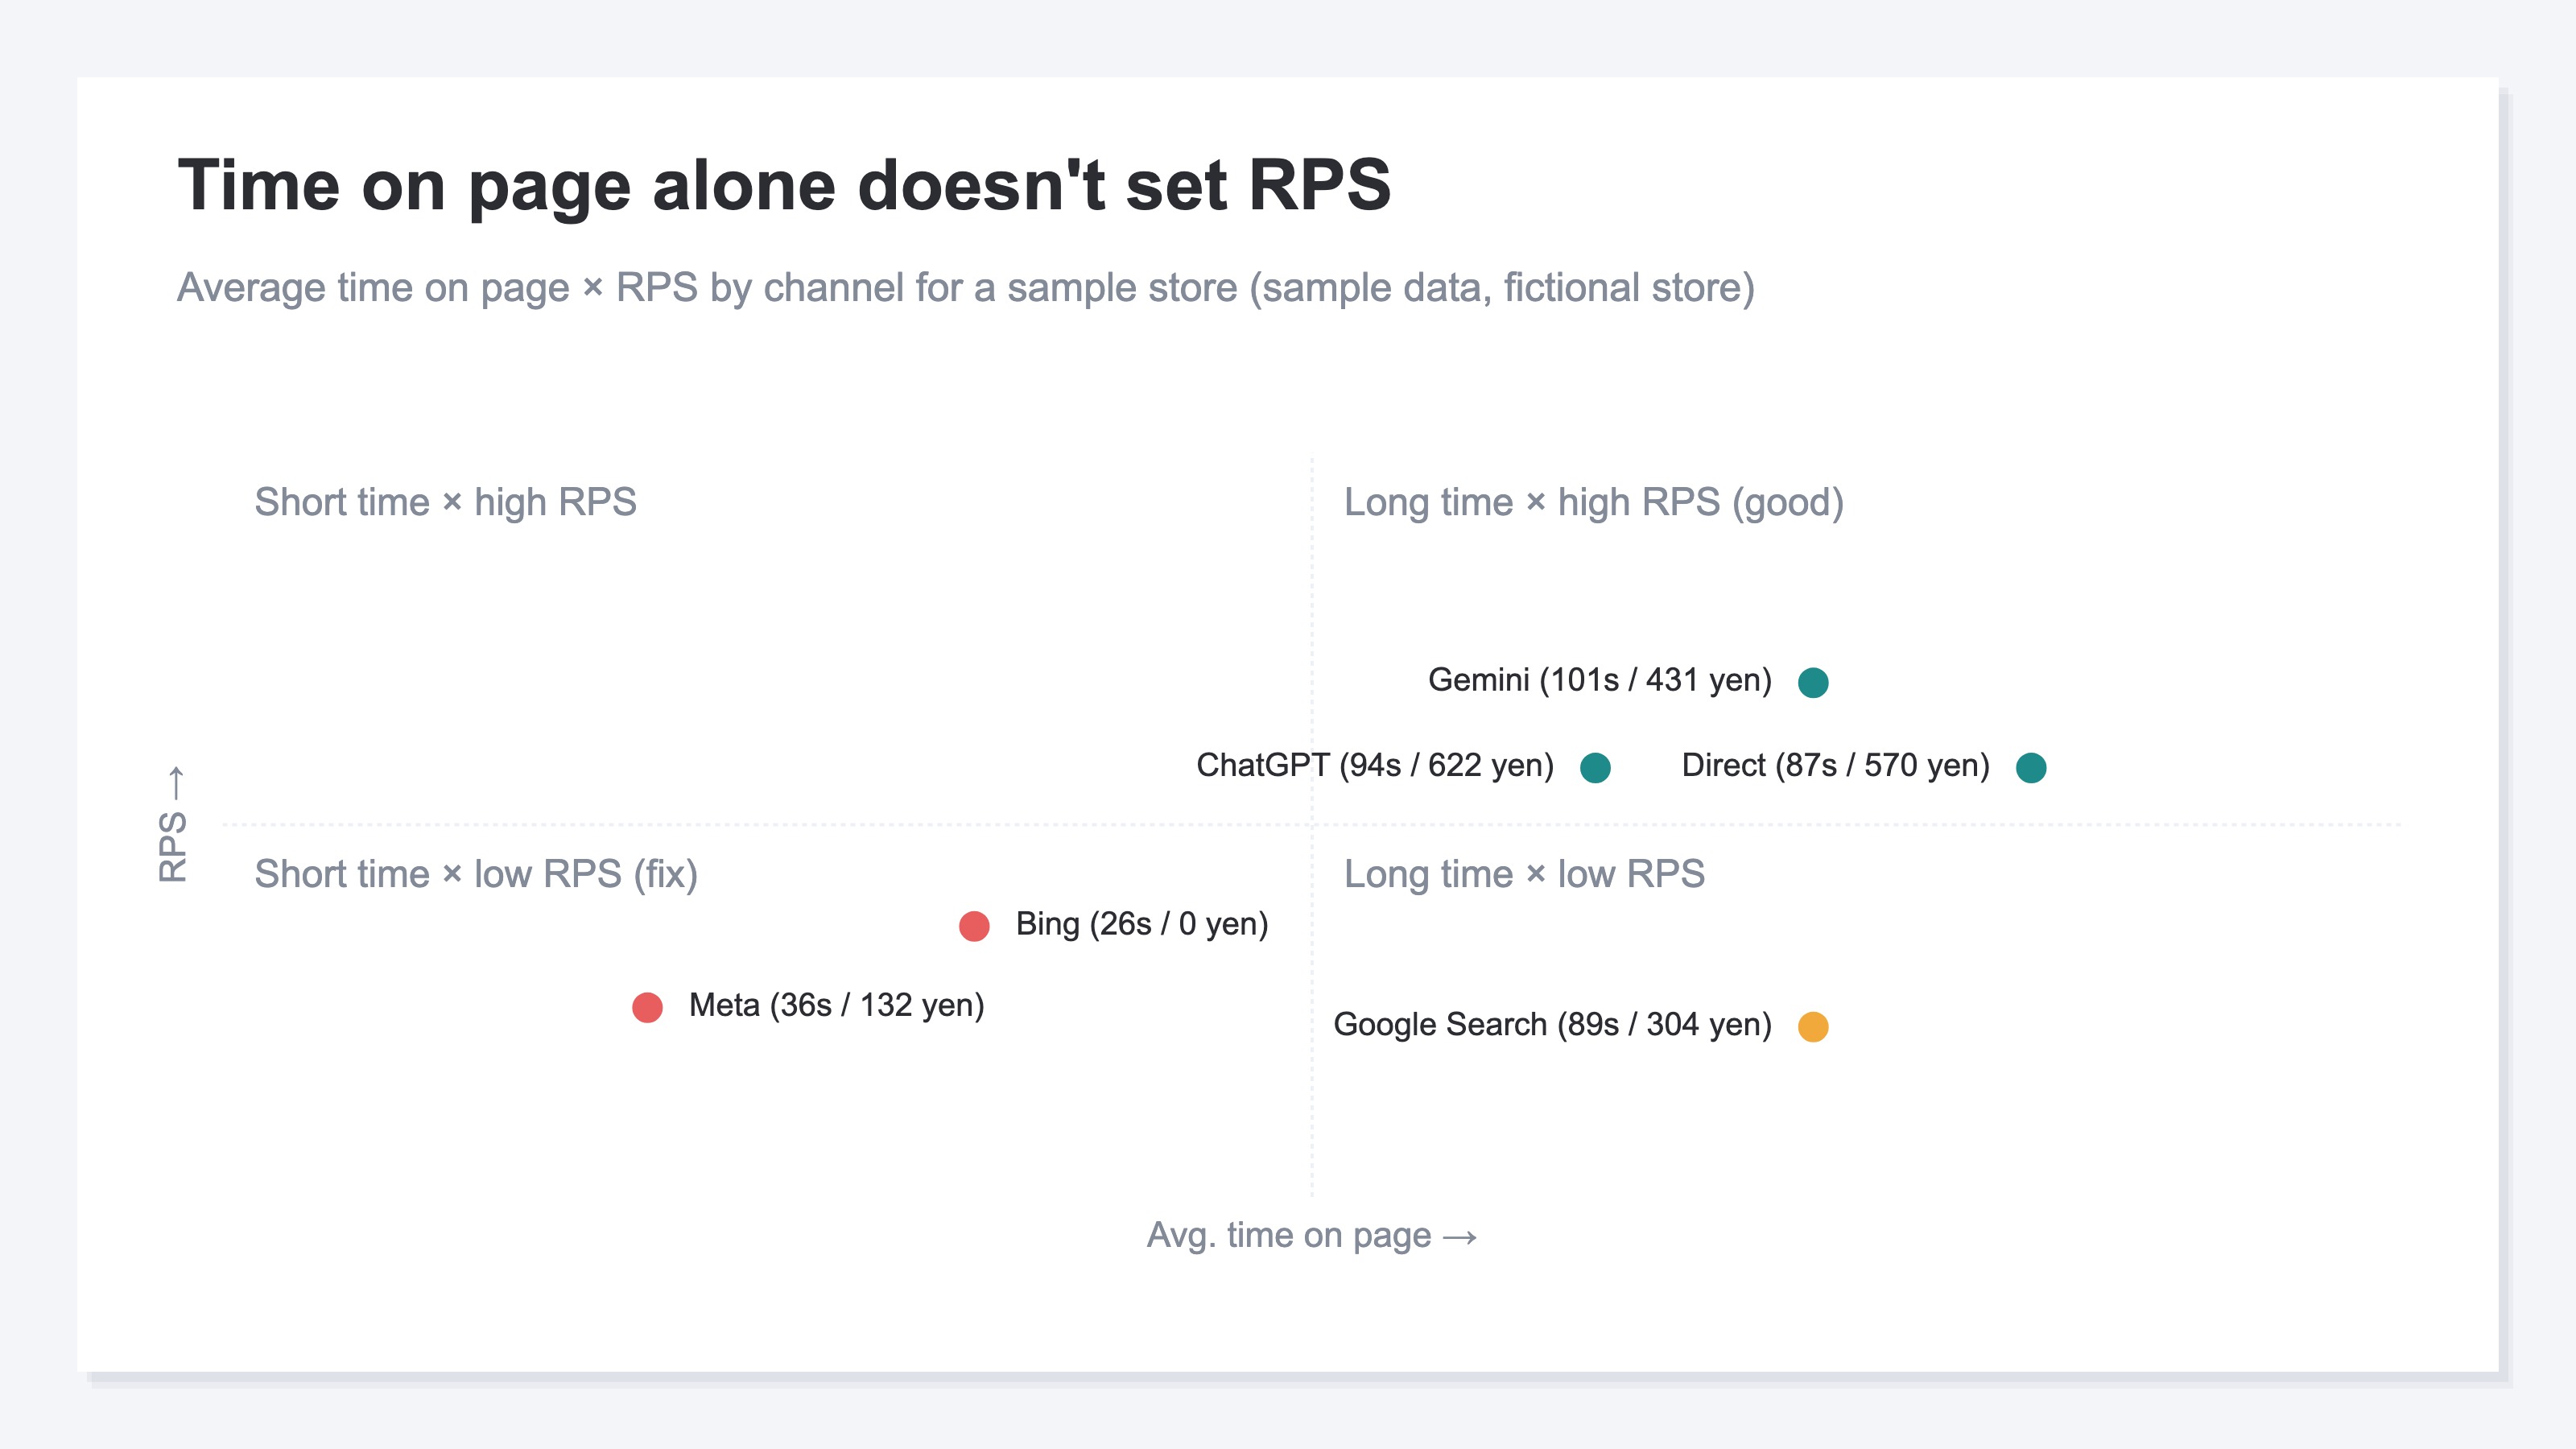
Let's look at actual demo data. Over 90 days at a sample ecommerce store, the site-wide average time on site was 70 seconds, the bounce rate 43.3%, and RPS ¥327.8. Break it down by channel, and the landscape changes.
Average time on site and RPS by channel (90 days)
| Channel | Avg. time on site | RPS |
|---|---|---|
| ChatGPT | 94s | ¥622 |
| Direct | 87s | ¥570 |
| Gemini | 101s | ¥431 |
| Google Search | 89s | ¥304 |
| Meta | 36s | ¥132 |
| Bing | 26s | ¥0 |
Fictional ecommerce store from sample data (RevenueScope demo)
The AI channels with long stays (Gemini, ChatGPT) mostly have high RPS too. Meta and Bing, with extremely short stays, have low RPS. And yet the length of a stay alone doesn't determine revenue contribution. Direct sits at 87 seconds with a high RPS of ¥570, while Google Search, at almost the same time on site, sits at ¥304. Nearly identical times, nearly a twofold difference in how they convert to revenue. That's why you cross-reference time on site × landing-page revenue × RPS by channel on one screen, and decide which page to fix and which channel to grow by "did it move revenue," not "was it read."
RevenueScope's average time on site comes from its own measurement and complements GA4. It excludes bot padding based on behavior — dwell, browsing, and purchases — and lines up time on site and RPS by channel on clean sessions. The point is to put that time on site next to revenue, so read-or-not gives way to a revenue-based call. That's where RevenueScope focuses.
FAQ#
Q. How many seconds of average engagement time count as a pass?
A. There's no passing line common to all sites. It varies widely by page type and traffic source. Rather than comparing against other sites, the realistic approach is to compare page against page and period against period within your own site, and judge alongside read-through rate and revenue.
Q. Is there a setting to bring GA4's time on site closer to reality?
A. There is a direction of supplementing it with additional measurement events. But it costs implementation and maintenance effort, and it doesn't erase all the blind spots in the spec. Before polishing the number, viewing your data in a form that can answer "did that time on site move revenue" gets your decisions further, faster.
Q. Should I cut budget or effort on channels with short time on site?
A. Deciding on time alone is dangerous. Some visitors buy despite short stays, and bot contamination can distort the number. Check the channel's RPS and read-through rate, confirm it isn't moving revenue, and only then cut it (Reading traffic quality through read-through rate).
Wrap-up: connect time on site to revenue#
If GA4's time on site looks short, don't panic. Time in other tabs isn't counted, the last page's stay rarely gets sent, and single-page exits leave almost no time. Shorter-than-it-feels can simply be the spec. Break it down by channel, device, and page, cross-check with read-through rate, and sort out whether it's the spec or a real exit. Then judge by the chain of time on site × read-through × revenue. A time metric on its own is no basis for an investment decision. Only once it's connected to revenue does the next page to fix become clear.
See which ads actually drive revenue, at a glance
Free up to 5,000 sessions/month, AI connection included. No credit card required. Up and running in 5 minutes.