"Only a few hundred yen more for free shipping." The moment that line appears, the cart stops just short of the order going through. Or the amount that unlocks free shipping sits above what an order on the store typically comes to, and the shopper who sees the shipping charge at the payment screen leaves. Does any of that sound familiar? A free shipping threshold is not something you set once and are done with. After you set it, you have to go and look at whether it is growing revenue or cutting into it.
Contents
TL;DR#
- Move the free shipping threshold and average order value (AOV) can rise while the conversion rate (CVR) falls, leaving revenue lower. AOV and revenue move in opposite directions
- A rule of thumb like "1.2 times AOV" gives you a number to start from, but whether it suits this store is something only measuring after the move can tell you. What decides the outcome is not how you set it but the check you run afterwards
- Read AOV, conversion rate and revenue at the same time. Take the day the threshold changed as the dividing line and compare against the same length of period before it. Read one alone and only half the picture shows up
- On top of that, the shipping you absorb eats into profit, so finish by reading the net amount. The revenue-side movement comes from the before-and-after comparison; the profit side you confirm in your own books
1. A Free Shipping Threshold Moves AOV and Revenue in Opposite Directions#
Move the free shipping threshold and AOV and the conversion rate go in opposite directions, so which way revenue lands cannot be read in advance.
Carts stall just short of the line#
The first thing that happens is buying stopping just under the line. Say free shipping starts at ¥5,000 and someone wants a single item in the ¥3,000s. They feel ¥5,000 is a long way off and hesitate even to put it in the cart. It also shows up as a cart sitting at ¥4,800 or ¥4,950 and never moving, left where it is. Instead of prompting an extra purchase, the threshold blocks the entrance to buying at all.
A threshold out of step with the store's AOV drives people away#
The second is people leaving because the threshold and the store's AOV are out of step. When the amount that unlocks free shipping is higher than what an order actually comes to, the shopper sees the difference at the payment screen and goes. Extra costs such as shipping and fees being too high is in fact the most common reason for leaving a cart right before purchase, cited by 40% of people[1]. A threshold does not work on its own; it works through where it sits relative to the store's AOV. Reading where that leaving happens from the revenue side is covered in how to see where revenue slips away.
The same move can work in reverse#
What makes this hard is that the same move — raising the threshold — works in reverse depending on the store. There are stores that raise the threshold to lift AOV and it works, and stores that stop the extra purchase and lose revenue. There is no universally correct number; it is settled only by the store's own data. Which is exactly why a threshold set by instinct or by formula has to be verified before and after the change.
2. What to Look At Before and After the Change#
Once you move the threshold, read AOV, conversion rate and revenue at the same time, as a comparison across the dividing line of the day you changed it.
Why you read all three at once#
Read one alone and only half the picture shows up. Read AOV alone and the order amount has gone up by however much the threshold went up, so it looks like a success. But if the conversion rate fell behind that, revenue may be down on balance. AOV having risen does not by itself mean revenue rose. Only with all three laid over each other does it become clear whether the change was a straight gain. The mechanism by which a move that lifts AOV can drop revenue is set out in why revenue falls when you raise AOV.
The before-and-after comparison is how you check#
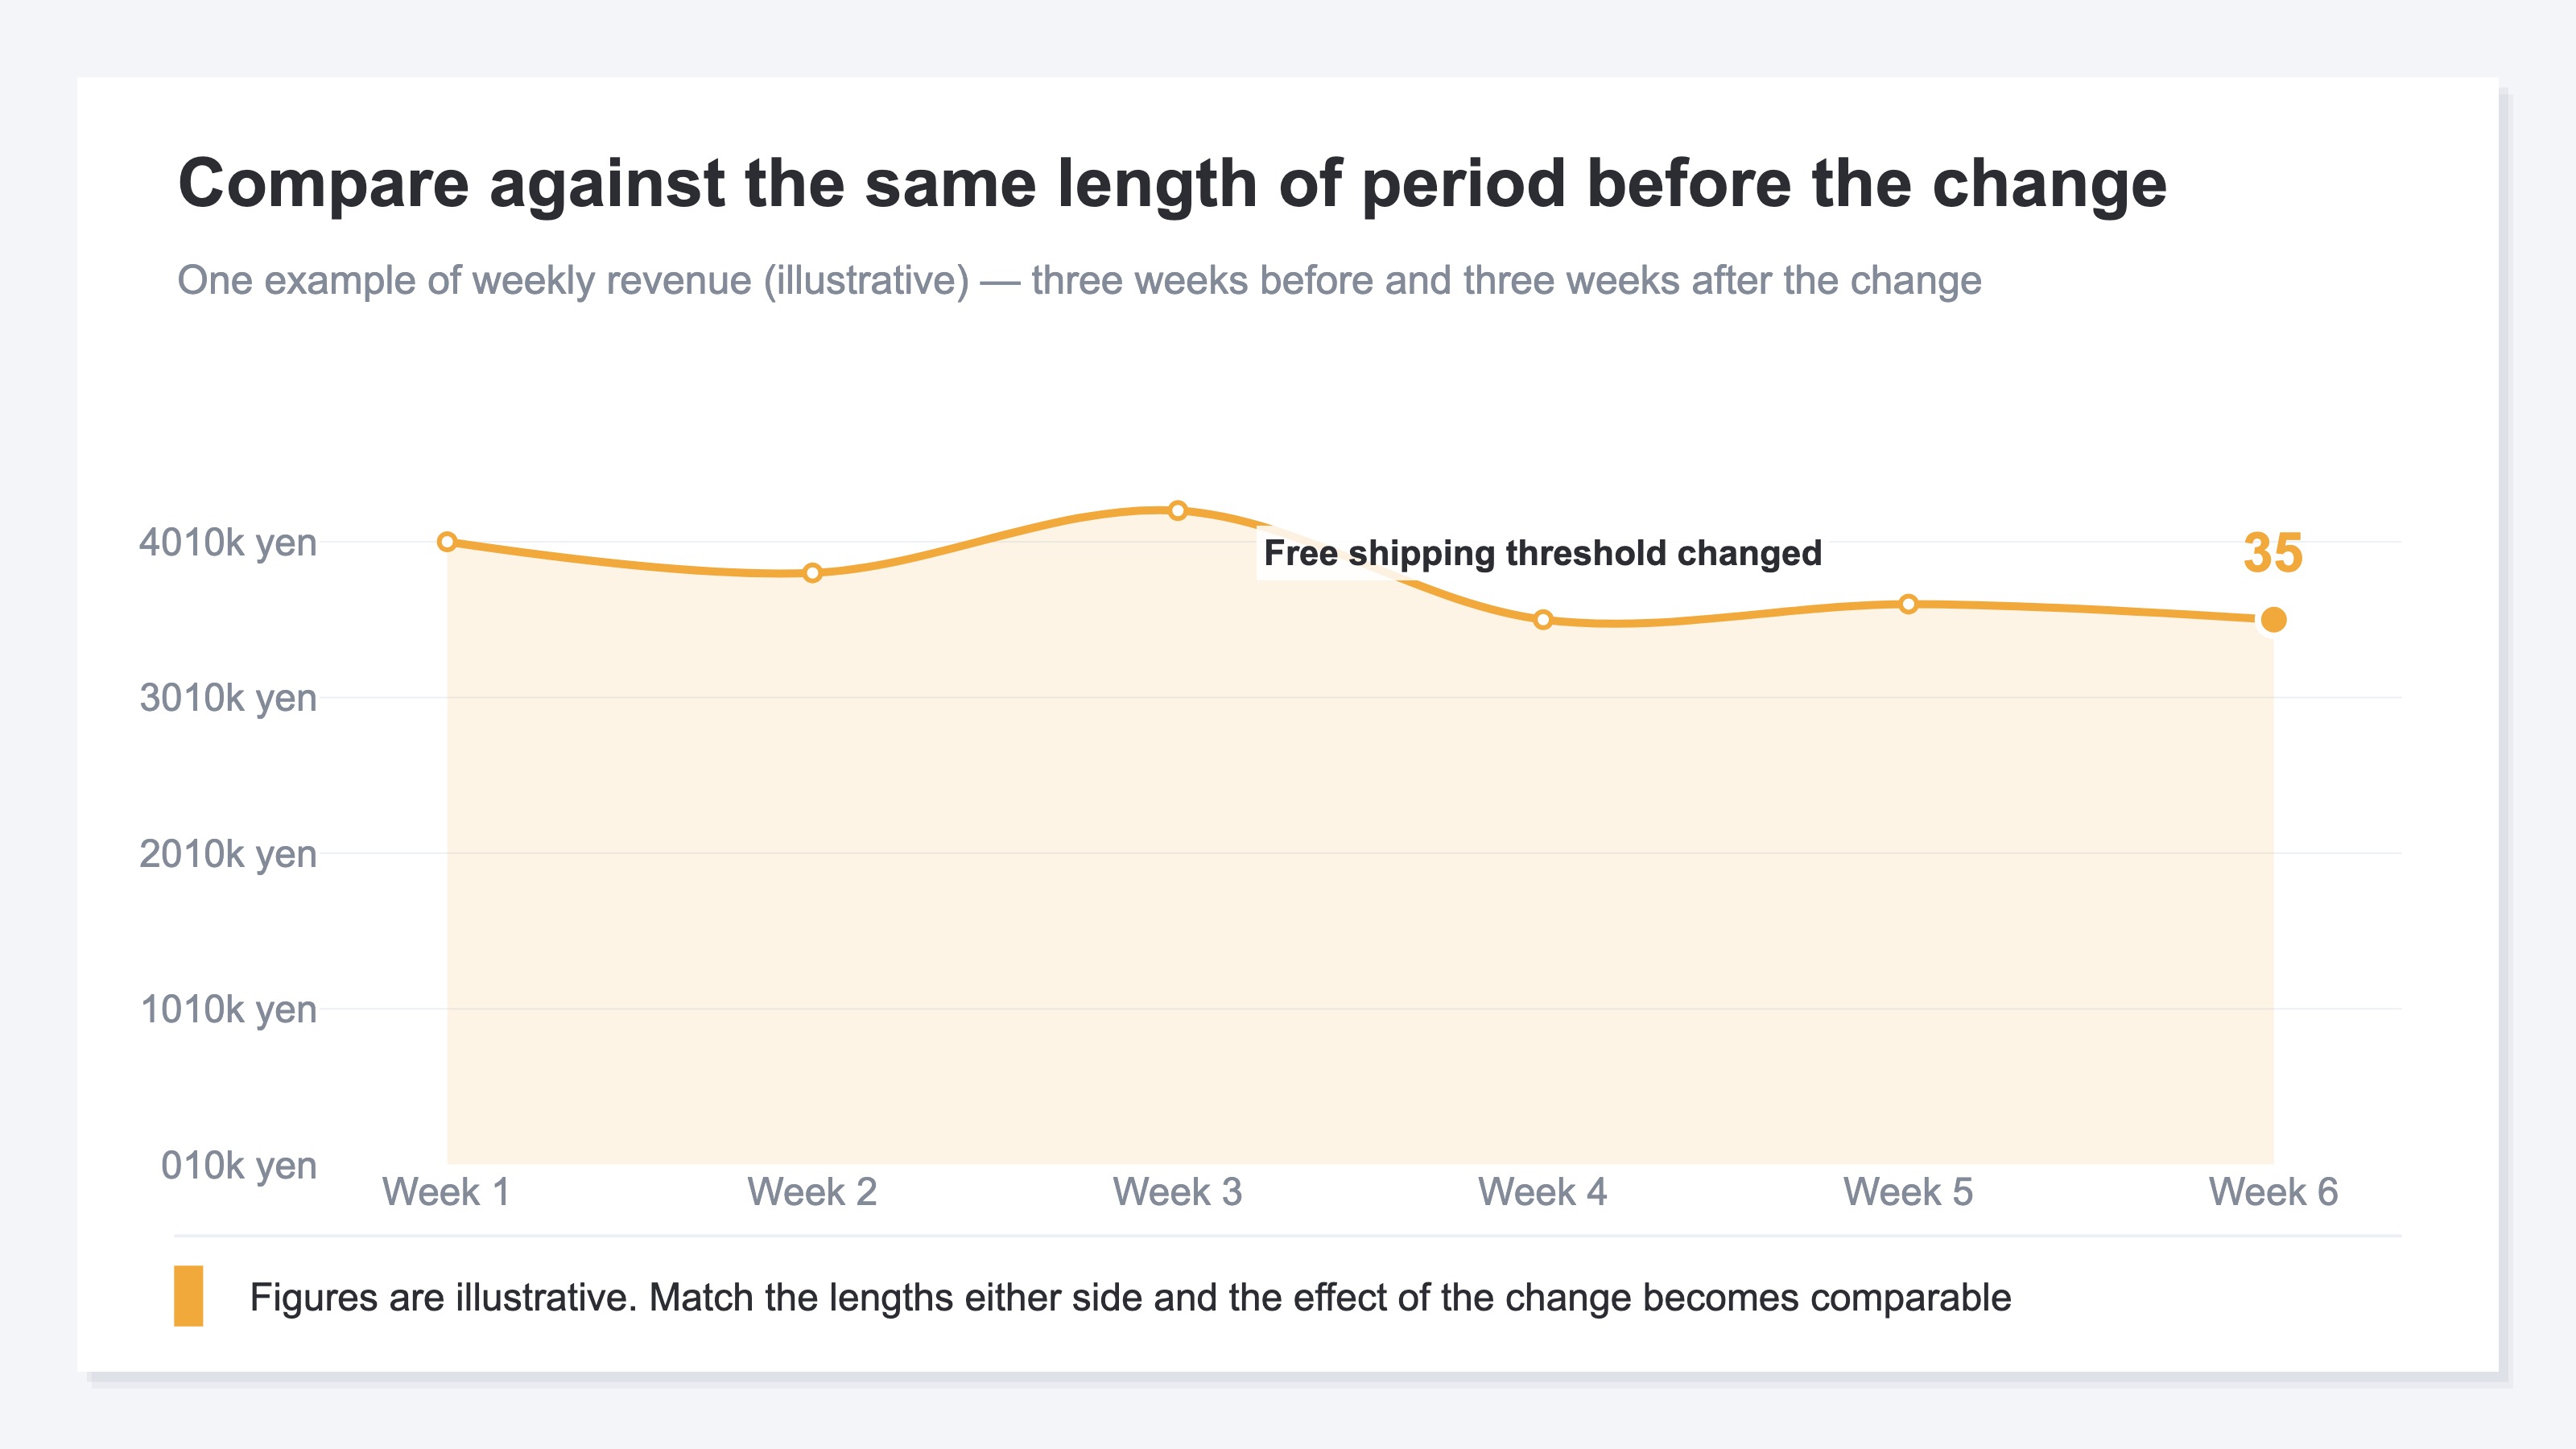
Verifying here does not mean running two settings side by side and comparing them. You take the day you changed the threshold as the dividing line and compare the same length of period before it with the period after it (a before-and-after comparison). It helps to think of the prior period as simply the same length of time immediately before. AOV and revenue you read as amounts and rates of change; the conversion rate you read as a difference in points (for example, "-0.5 points").
Doing it by hand is heavy every time#
The thinking is not difficult, but keeping it up is heavy work. AOV is on one screen, the conversion rate on another, revenue on a third, and they all have to be lined up on the day of the change and matched before against after. Repeating that assembly by hand every time the threshold moves takes real effort. The more the metrics sit on separate screens, the harder it is to see AOV and revenue moving in opposite directions.
3. Look at the Net Effect Including the Shipping You Absorb#
Even with revenue unchanged, more shipping absorbed by the store means less profit left in hand. Finish by reading the net amount, and settle whether the change to the threshold really paid.
One more thing that eats profit: the shipping you absorb#
One more element joins the movement of AOV, conversion rate and revenue: the shipping the store absorbs. Lower the threshold and the conversion rate is easier to hold, but the store ends up covering free shipping more often and the margin thins. AOV can rise while the fall in conversion rate takes revenue down, and the shipping absorbed then cuts profit further still. It is that movement — the three plus the shipping absorbed — that settles whether a threshold is good or bad.
Split the roles between the revenue side and the profit side#
The numbers read here divide into two roles. Changes in AOV, conversion rate and revenue can be checked with the before-and-after comparison. Shipping costs and gross margin, on the other hand, are numbers on the accounting and ledger side of the business, where the cost of goods lives. Split the roles — revenue-side movement from the measurement tool, profit side from your own books — and lay them over each other, and the net effect of the threshold change comes into view.
Run the numbers assuming volume drops#
Before you change anything, it is safer to have thought through the case where AOV or order count falls. Work out in advance roughly how far order count might drop if the threshold goes up, and what contribution margin does in that case, and the check you run after the move becomes a matter of confirming whether it landed as expected or not.
RevenueScope solution
RevenueScope compares AOV, conversion rate and revenue across matching periods either side of a free shipping threshold change and displays them together. It places the prior period — the same length of time immediately before the change — and the current period on one screen, showing AOV and revenue as amounts and as a change against the prior period, and the conversion rate as a difference in points.
The table below turns that before-and-after comparison into one example.
| Metric | Before (same length of period) | After | vs prior period |
|---|---|---|---|
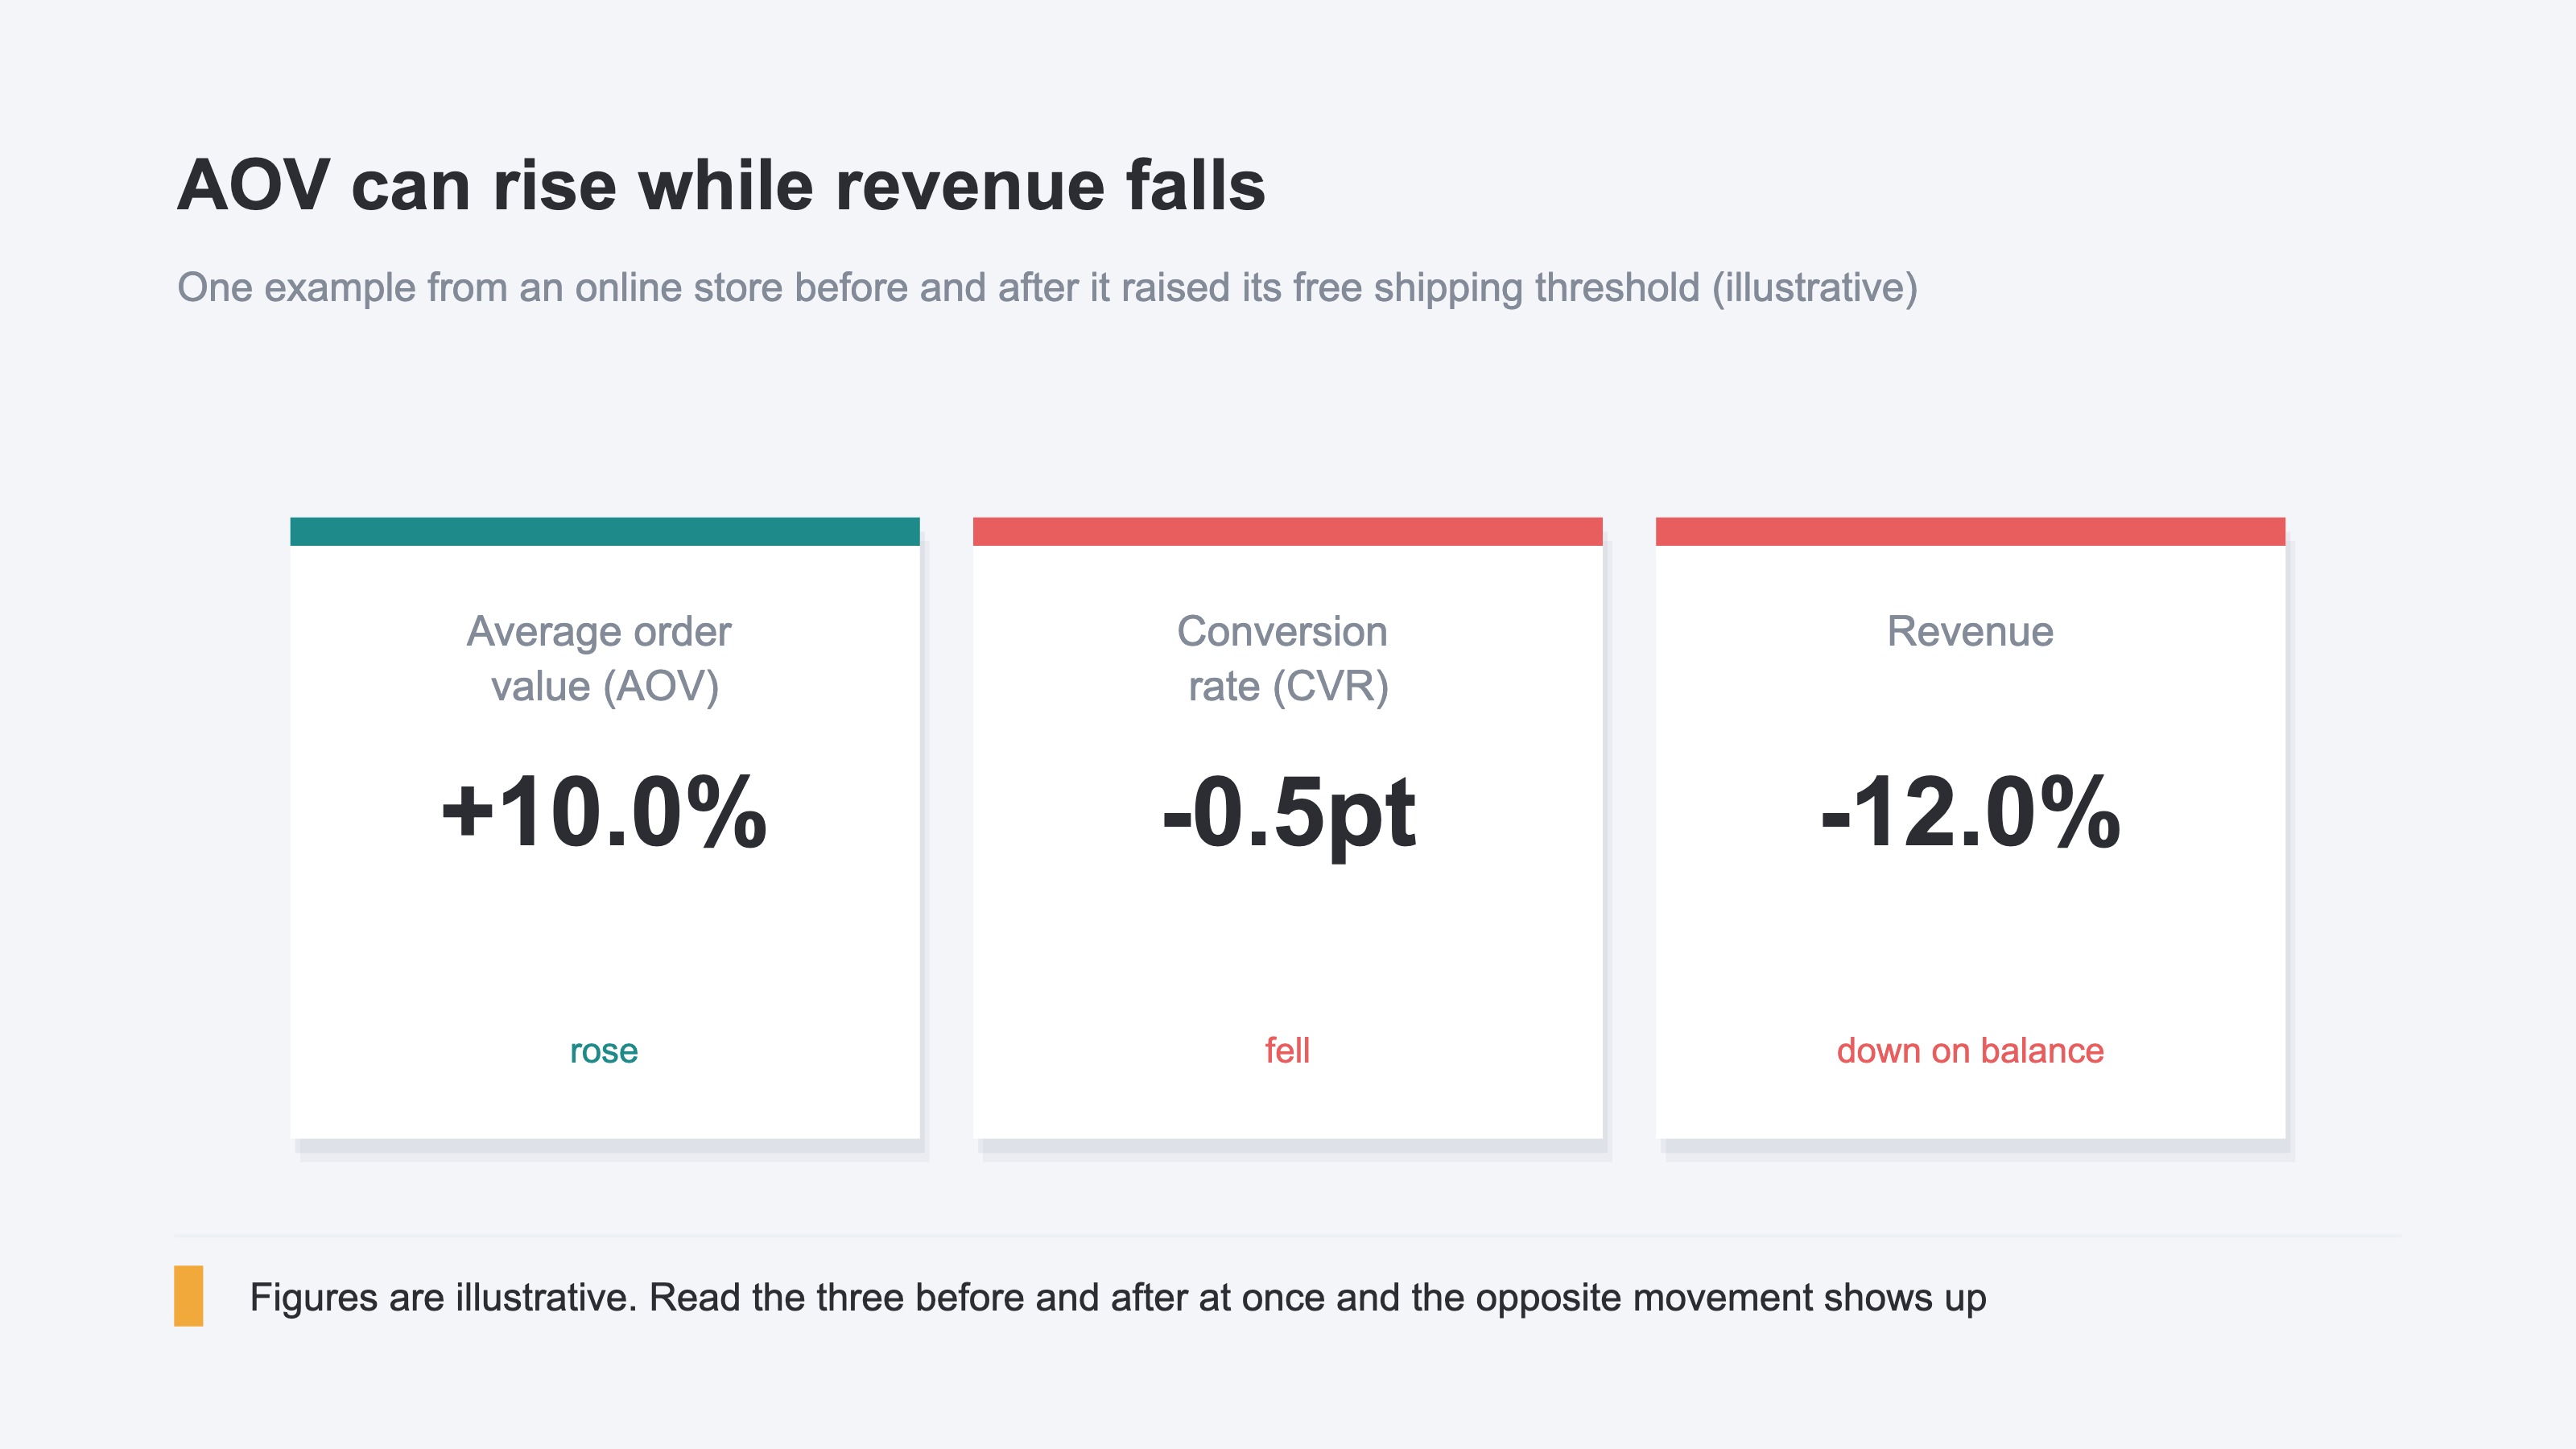
| Average order value (AOV) | ¥4,800 | ¥5,280 | +10.0% |
| Conversion rate (CVR) | 2.5% | 2.0% | -0.5 points |
| Revenue | ¥1,200,000 | ¥1,056,000 | -12.0% |
One example (illustrative figures). These free-shipping threshold figures come from a fictional sample site.
In this one example, AOV is up by a tenth, yet the conversion rate is down 0.5 points and revenue is down 12%. A change that looks like a success if you read AOV alone turns out, once all three are read before and after, to have been cutting into revenue. Only here does the decision — put the threshold back, or try a different number — have something to stand on.
How far the shipping absorbed by the store has eaten into profit (contribution margin) is a number read on the accounting and ledger side, where cost of goods and shipping costs live, and it sits outside what RevenueScope measures. What RevenueScope checks is the revenue-side movement — AOV, conversion rate, revenue and RPS — and laying your own profit side over that carries you through to the net effect of the change.
GA4 will show you AOV, conversion rate and revenue individually as well. But assembling by hand, every time the threshold moves, the work of splitting at the change date, aligning the same period before, and comparing all three at once is heavy, and the metrics sit on separate screens. RevenueScope returns the three metrics either side of the change on one screen, and answers the same question when an AI is asked, so whether moving the threshold was the right call can be settled on the spot.
FAQ#
Frequently asked questions#
Q. How many times AOV should the free shipping threshold be?
A. There is no single correct answer. Rules of thumb like "1.2 to 1.5 times AOV" exist, but the same setting can work in reverse on your own store. Set it once from the rule of thumb, then read AOV, conversion rate and revenue before and after the change and move it toward the number that suits the store. A list of the moves themselves is collected in ways to raise average order value (AOV).
Q. Why does revenue fall when AOV rises?
A. Because raising the free shipping threshold can leave people who feel they cannot reach the amount not proceeding to buy, which pulls the conversion rate (CVR) down. Even with more spent per order, if the share of visitors who buy shrinks, revenue is down on balance. Reading the conversion rate and revenue alongside AOV, rather than AOV alone, is what makes that opposite movement visible.
Q. How long a period should the before-and-after comparison cover?
A. Take the day you changed the threshold as the dividing line and compare against the same length of period before it. To smooth out the scatter in order counts, taking a span long enough for orders to accumulate — a few weeks on each side, say — makes it easier to read. Too short a period and the judgement swings on whatever happened to occur.
Q. Does a shipping bar saying "spend X more for free shipping" solve it?
A. It helps reduce people leaving, but it does not produce the correct number for the threshold itself. Shipping bars and multi-step thresholds are devices that soften the leaving; whether the threshold suits the store has to be confirmed by reading AOV, conversion rate and revenue before and after the change.
Summary#
A free shipping threshold is not set once and finished. Move it and AOV can rise while the conversion rate falls, leaving revenue lower. So what matters is less how you set it than the check you run after you set it. Take the day of the change as the dividing line, compare AOV, conversion rate and revenue against the same length of period before, and finish by reading the net amount with the shipping absorbed subtracted. Start by picking one recent occasion when the threshold moved, and confirm how the three metrics moved either side of it.
See which ads actually drive revenue, at a glance
Free up to 5,000 sessions/month, AI analyst included. No credit card required. Up and running in 5 minutes.