There is no ad-spend percentage that fits every e-commerce business. Sources cite a 1.3% average, 2.0% for retail, and around 5% for cross-border e-commerce, but they cover different groups and costs. This article explains how to read those averages and return to your own ad spend, sales, and ROAS.
Contents
TL;DR#
- No ad-spend-to-sales ratio works for every e-commerce business
- Tokyo Shoko Research's 1.3% average and 2.0% retail figure cover different companies
- Shopee Japan's 3% to below 10% range comes from 109 cross-border e-commerce managers
- Use averages for context, but use your own sales ratio and ROAS to change spending
- Sales ratio and ROAS use different denominators, so decisions need both
1. Ad Spend as a Share of Sales Depends on the Survey Scope#
Ad spend as a share of sales cannot be compared unless the scope of costs, industry, and surveyed population are aligned.
The ad-spend percentage formula is straightforward; aligning what counts as spend and sales is not.
Ad spend as a share of sales = ad spend ÷ sales × 100
The numerator differs by source. Tokyo Shoko Research defines promotional expenses as advertising expenses plus sales promotion expenses[1]. That scope does not match an in-house ratio counting only online ad spend.
Tokyo Shoko Research found an average advertising-to-sales ratio of 1.3% among 87,490 companies that recorded promotional expenses in FY2023[1]. The companies span many industries; the figure is limited neither to e-commerce nor to online advertising.
An average also requires care. The 1.3% figure averages the surveyed companies' ratios; it is not a target for every company. It cannot tell you by itself that 5% is too high or 1% too low.
Before using an external source, check these three points:
- Who the survey covers
- What the source includes in ad spend
- Whether the figure is a mean, a median, or a response distribution
Skip this check and you may compare different metrics sharing the label “ad-spend ratio.” Read the population and definition before the number.
2. The 1.3% Average and Retail's 2.0% Are Not the Same Benchmark#
The 1.3% average and the 2.0% retail figure cover different groups of companies. The latter is not simply the retail subset of the former.
Tokyo Shoko Research presents two calculations[1]. The 1.3% average covers 87,490 companies that recorded promotional expenses in FY2023. The 2.0% retail figure comes from 265,253 companies with available selling, general, and administrative expense details.
Their survey populations do not match, despite appearing in the same article. You cannot treat 1.3% as the whole and 2.0% as one component. Separate the populations before comparing the figures.
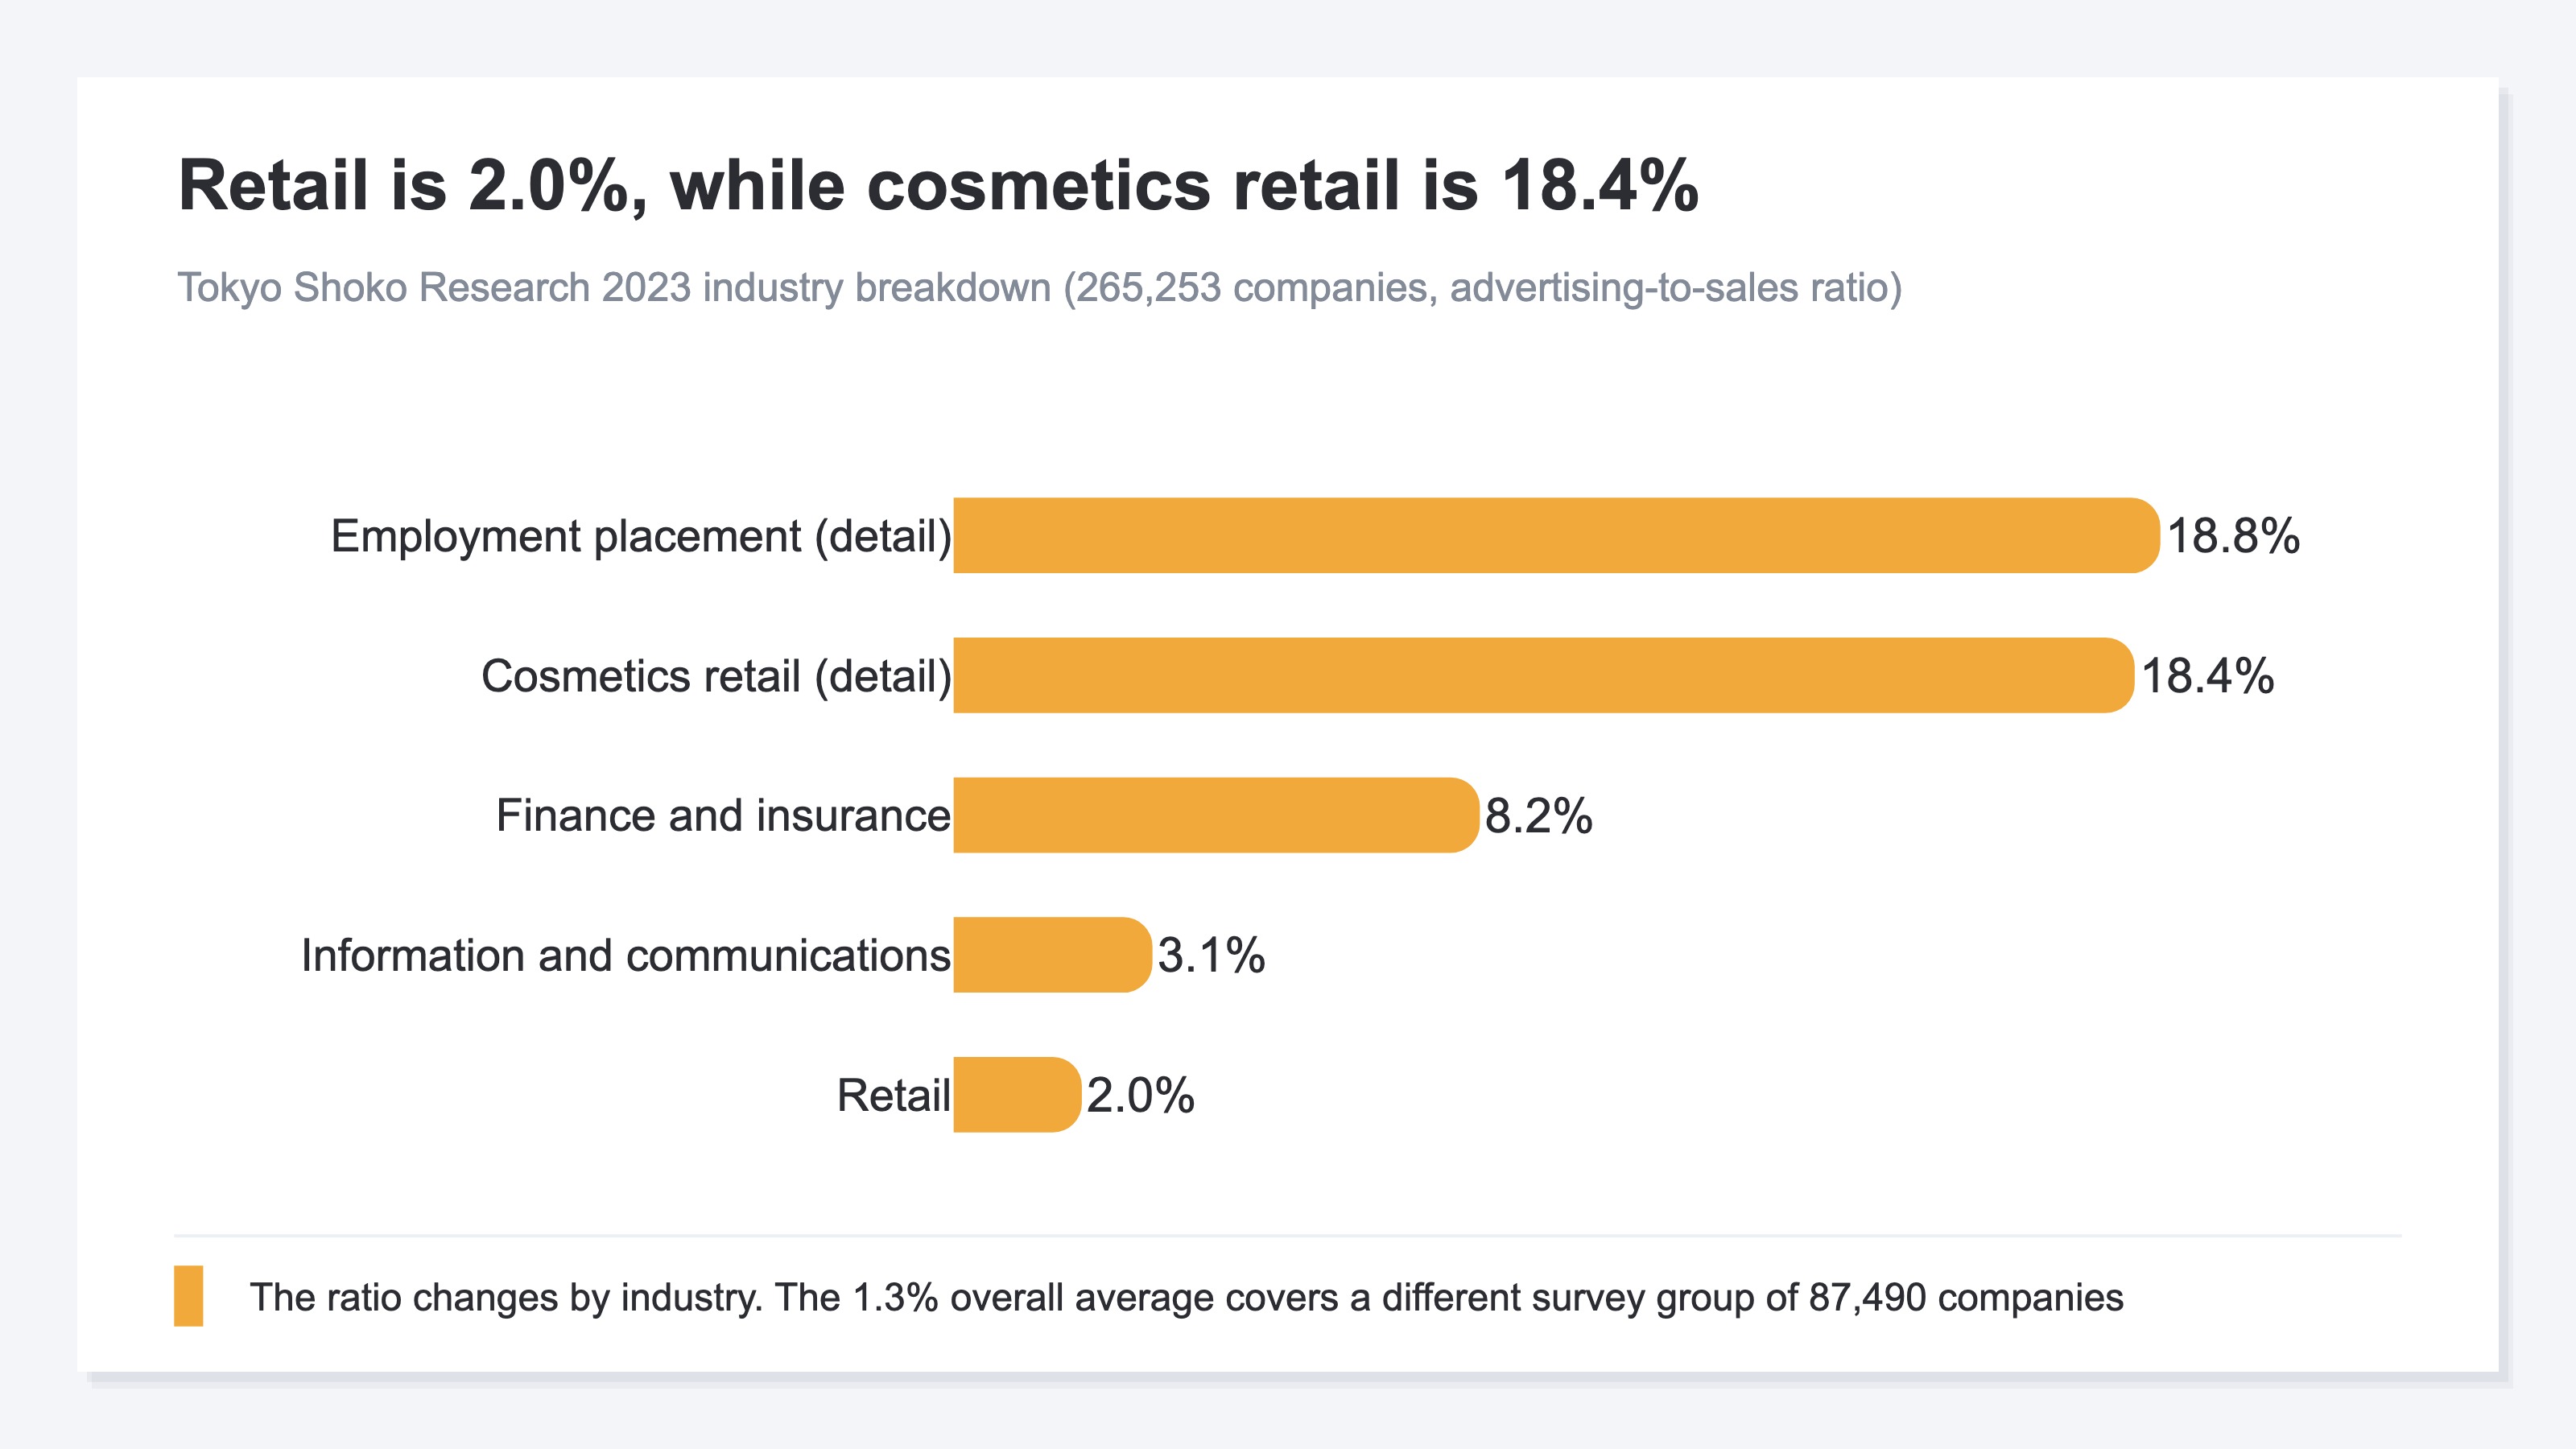
By broad industry, finance and insurance stood at 8.2%, information and communications at 3.1%, and retail at 2.0%. In the more detailed industry breakdown, cosmetics retail stood at 18.4%[1]. Even within the broad retail category, the ratio varies widely with the product and competitive environment.
The 18.4% figure for cosmetics retail is not a general e-commerce recommendation; it covers one industry. Applying 2.0% to every e-commerce business would likewise obscure high-spending industries such as cosmetics.
Industry averages show whether your business sits far outside a comparable industry. They cannot decide which channel should receive the next ¥10,000 of your budget. See Single-Product Ad Budget: Where the Next Yen Goes.
3. Do Not Apply the Cross-Border E-Commerce Range Directly to Domestic E-Commerce#
Shopee Japan's “around 5%” result comes from a survey of cross-border e-commerce managers, not an average for domestic e-commerce as a whole.
In February 2023, Shopee Japan surveyed 111 people responsible for or working on cross-border e-commerce businesses[2]. Of those respondents, 109 answered the question about ad spend as a share of sales. The largest group, 33.0%, selected “5% to below 10%,” followed by 23.9% selecting “3% to below 5%.” Together, the range from 3% to below 10% accounted for 56.9% of responses.
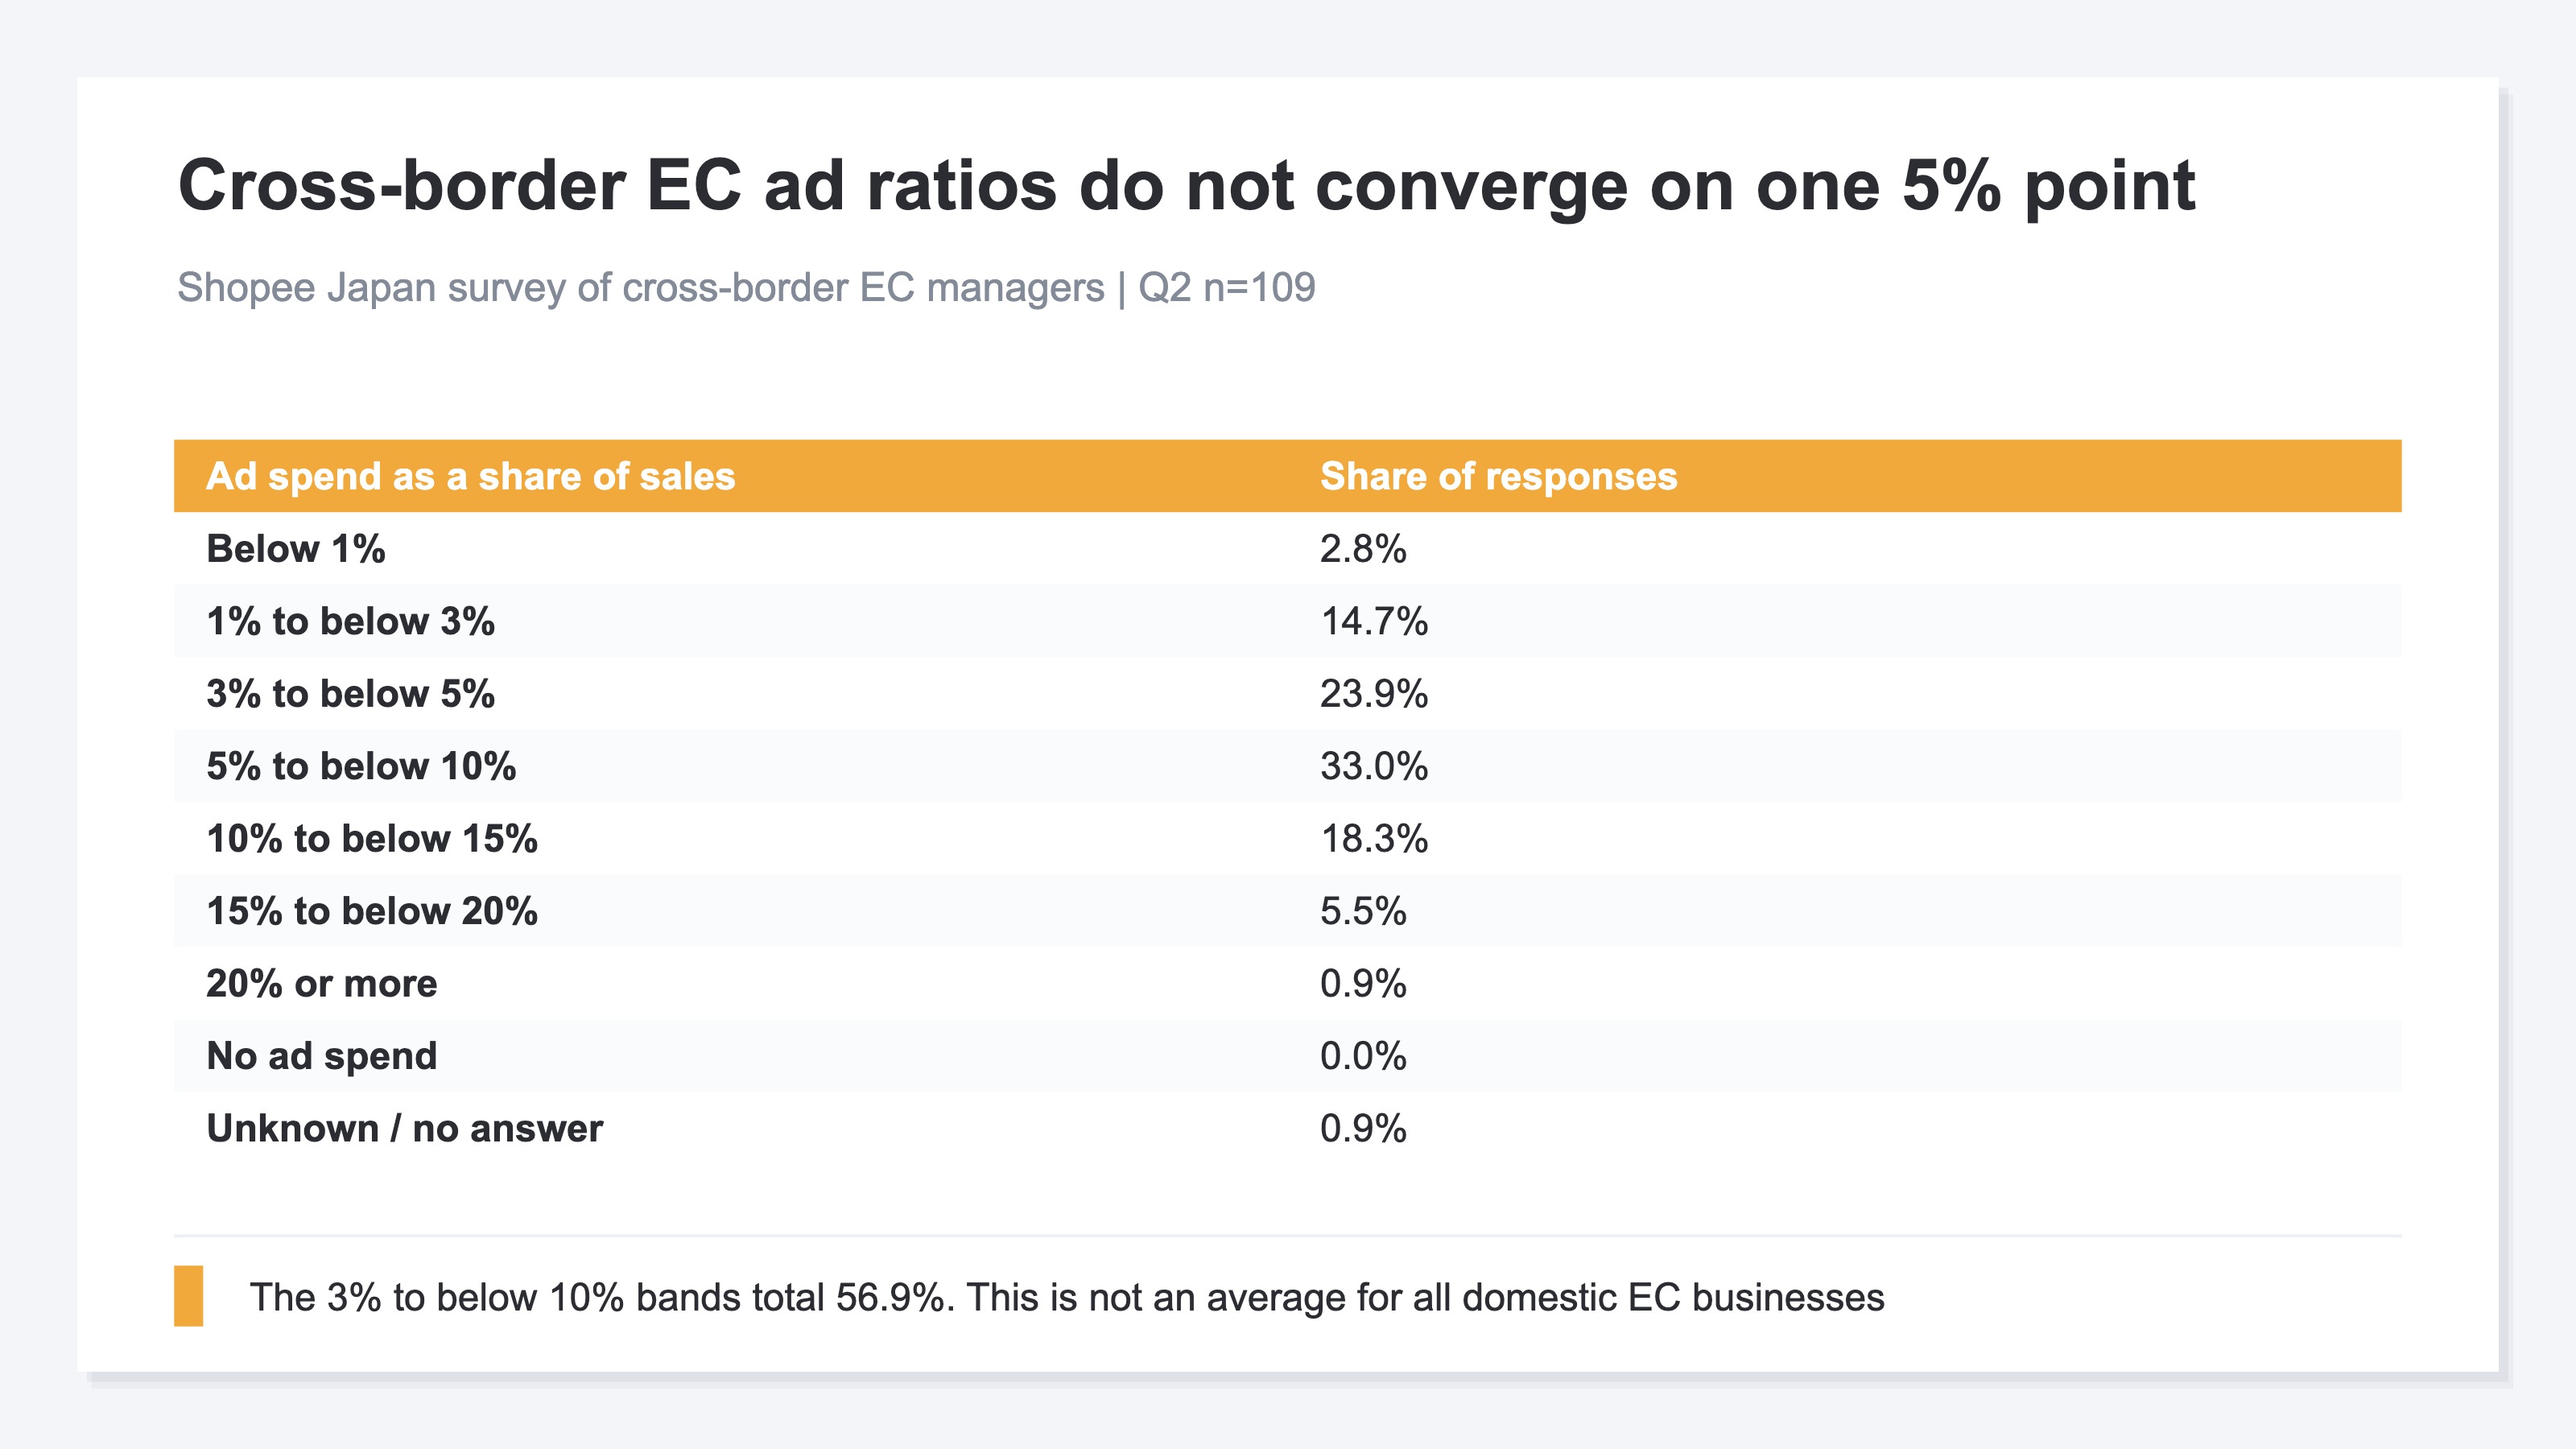
The survey did not identify a single 5% answer. Its largest category was 5% to below 10%, followed by 3% to below 5%; another 18.3% selected 10% to below 15%. Quoting only “around 5%” hides this spread.
The gap does not make either source wrong. Tokyo Shoko Research analyzes company financial data; Shopee Japan surveyed cross-border e-commerce practitioners online. Industry, region, timing, and cost framing all differ.
A domestic e-commerce business cannot use this survey to claim “the market rate is 5%.” For a cross-border business, the distribution is still only a reference point. Setting a budget requires connecting ad spend to sales on its own site.
4. Return from External Benchmarks to Your Own Ad Spend, Sales, and ROAS#
Decisions to increase or reduce a budget should return from external averages to your own ad-spend-to-sales ratio and revenue-based ROAS.
The ad-spend-to-sales ratio shows how much the company spends on advertising relative to total sales. ROAS shows how many times the ad spend was returned as sales. RevenueScope uses measured sales from the channels mapped to each advertising platform as the numerator.
Ad spend as a share of sales = ad spend ÷ total sales × 100
ROAS = measured sales from mapped channels ÷ ad spend
For example, if monthly sales are ¥10,000,000 and ad spend is ¥500,000, the ad-spend-to-sales ratio is 5%. If measured sales for channels mapped to the advertising platform are ¥2,000,000, ROAS is 4.0x. The 5% and 4.0x figures do not conflict: total sales are the denominator of the former, while mapped-channel sales are the numerator of the latter. This is a fictional example provided only to show the calculation relationship.
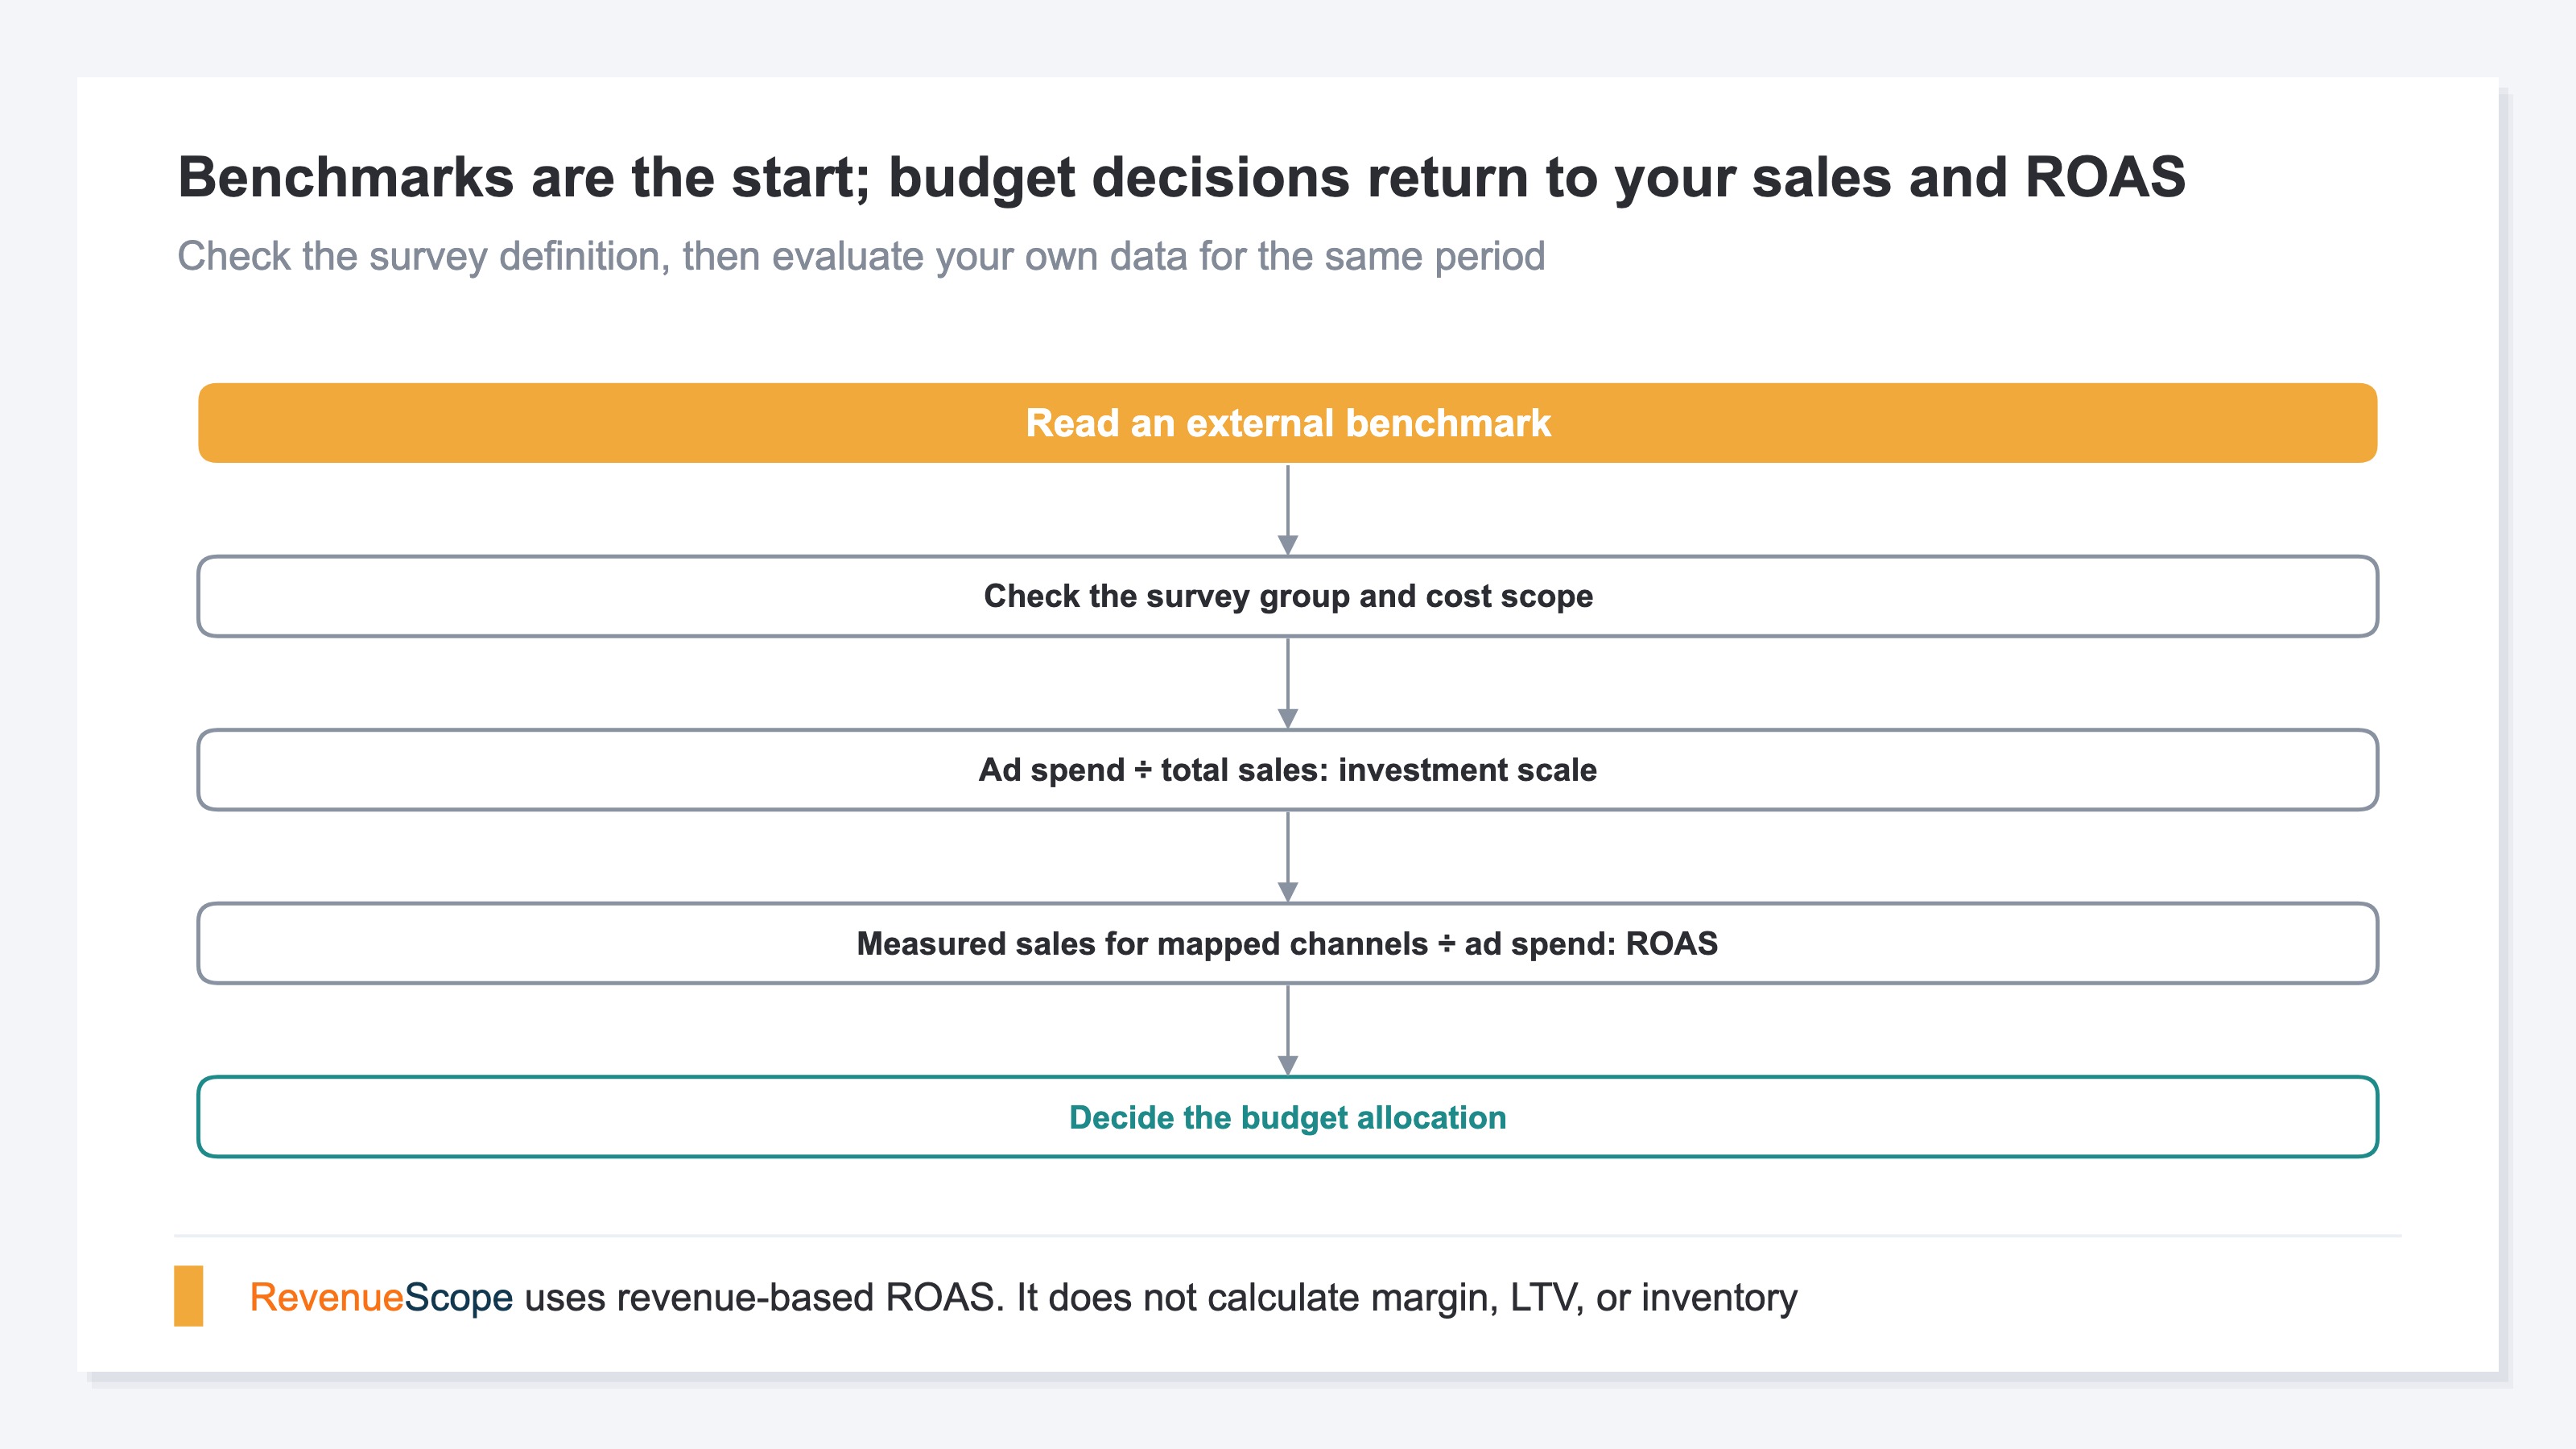
Use this three-step sequence:
- Check the surveyed population and cost scope of the external source
- Divide your ad spend by total sales to understand the scale of investment
- Calculate revenue-based ROAS by advertising platform to assess return efficiency
Even when the overall ad-spend ratio is close to an average, concentration in a channel with weak return efficiency does not justify an increase. Conversely, a business may sit above the average while still recovering its spend through a channel with high revenue-based ROAS. Platform ROAS and company-measured efficiency explains the difference between advertising platforms' reported figures and measurements based on your own sales.
The logic behind calculating these ratios each month is straightforward. Repeatedly collecting spend from multiple platforms and sales generated on your own site for the same period is not. An external average may need to be researched only once, but your ROAS must be updated whenever spending or sales change.
RevenueScope solution
RevenueScope displays revenue-based ROAS calculated from ad spend and sales measured on your own site.
Ad spend can be entered through a form by selecting the year, month, and channel. Bulk CSV import is also available. For periods with registered ad spend, you can review ROAS for the site as a whole and by advertising platform. The numerator is not sales claimed by an advertising platform; it is sales that RevenueScope measures on your own site.
Example display for a fictional e-commerce site
| Display level | Ad spend | Sales | ROAS | Revenue Per Session (RPS) |
|---|---|---|---|---|
| Meta (advertising platform) | ¥80,000 | ¥96,000 | 1.20x | — |
| ┗ Instagram (channel) | — | ¥72,000 | — | ¥90 |
| ┗ Facebook (channel) | — | ¥24,000 | — | ¥120 |
The table is a fictional example created for explanation and differs from the sample data in the sample store. Sales for an advertising platform combine sales from its mapped channels. Those channels may include organic traffic, so the total is not necessarily sales generated by ads alone.
At the advertising-platform level, RevenueScope displays ad spend, sales, and ROAS. For the underlying channels, it shows sales and Revenue Per Session (RPS). Here, RPS is the underlying channel's sales divided by its sessions. This separation keeps the role of each level clear when ad spend is registered at the platform level but visits are recorded at the channel level.
RevenueScope does not display ROAS as zero for a period in which no ad spend has been registered. If ad spend is greater than ¥0, it calculates ROAS as 0x even when sales are ¥0. RevenueScope supports ad-allocation decisions using sales, ad spend, ROAS, and RPS.
An external average tells you only how far your business sits from a comparable industry. Returning to measurements in RevenueScope lets you review revenue-based ROAS for each advertising platform, together with sales and RPS for its underlying channels. Ask AI How to Split Your Ad Budget also shows how to build an allocation draft from measured data.
FAQ#
Frequently Asked Questions#
Q. Should I use 1.3% of sales as my ad-spend benchmark?
A. The 1.3% figure is the average Tokyo Shoko Research calculated from 87,490 companies that recorded promotional expenses in FY2023. It is not an e-commerce-only average, and promotional expenses include both advertising and sales promotion expenses. Use it as an external reference, not as a ceiling for your own budget.
Q. Is 2% of sales appropriate for a retail business?
A. The 2.0% figure comes from an industry breakdown of 265,253 companies whose selling, general, and administrative expense details were available. In the same source, cosmetics retail stood at 18.4%. The spread within retail is too large to conclude that 2% is appropriate on its own.
Q. Is 5% of sales the standard ad budget for e-commerce?
A. Shopee Japan's “around 5%” figure comes from a survey of people responsible for or working on cross-border e-commerce. Among the 109 who answered the ad-spend-ratio question, 33.0% selected 5% to below 10%, while 23.9% selected 3% to below 5%. It is not an average for domestic e-commerce as a whole.
Q. What is the difference between ad spend as a share of sales and ROAS?
A. The sales ratio is the scale of investment, calculated by dividing ad spend by total sales. RevenueScope's ROAS divides measured sales for channels mapped to the advertising platform by ad spend. Because the numerator and denominator differ, two e-commerce businesses with the same sales ratio can have different ROAS. See What Is ROAS? for the fundamentals.
Q. How can I register ad spend in RevenueScope?
A. You can enter it through a form by selecting the year, month, and channel, or use bulk CSV import. RevenueScope displays ROAS, with sales measured on your own site as the numerator, only for periods with registered ad spend.
Summary#
No single average determines what percentage of sales should go to advertising. Tokyo Shoko Research's 1.3% average covers 87,490 companies that recorded promotional expenses. Its 2.0% retail figure comes from a separate industry breakdown covering 265,253 companies. The concentration of Shopee Japan responses from 3% to below 10% is likewise limited to 109 cross-border e-commerce managers.
Use an external average to check whether your business sits far outside a comparable industry. Decide whether to raise or reduce the budget by returning to your own ad spend as a share of total sales and to ROAS calculated from measured sales for channels mapped to each advertising platform. Do not mix averages with different populations and definitions; make your own measurements the final basis for the decision.
See which ads actually drive revenue, at a glance
Free up to 5,000 sessions/month, AI analyst included. No credit card required. Up and running in 5 minutes.
References#
- [1] Tokyo Shoko Research "Promotional Spending Recovers as Cosmetics Retailers and Employment Placement Firms Spend About a Fifth of Sales" (2025)
- [2] Shopee Japan "What Is the Ad-Spend Benchmark for Cross-Border E-Commerce? 92.7% of Operators Say Investing in Advertising Is Important, with Around 5% of Sales as the Market Range" (2023)