
"If we add related-articles cards and match the internal links both ways, will engagement really go up?" We tried it on our own site. We added a related-articles component to all 212 posts and matched the related: frontmatter both ways. We shipped it in a batch in mid-June, and 30 days later, site-wide pages per session had risen about 14%. But you can't stop at "did it work / didn't it." New articles were added in the same window, and seasonality and traffic mix shifted too. This article discloses the dogfooding measurement straight — "engagement went up, but the confounders aren't cleanly separated yet" — and threads it into the more useful question: "which entry page's internal-link work moves revenue?"
Table of contents
TL;DR#
- Added related-articles cards to all 212 posts and matched
related:frontmatter both ways - Thirty days later, pages per session rose about 14%. But bounce rate barely moved and there are confounders — new articles, seasonality, traffic mix
- So the before/after alone can't settle "did it work." The better question isn't "did it work" — it's "which entry page's internal-link work moves revenue?"
- Line up entry pages by engagement growth rate and landing-revenue period-over-period, and you can tell "winning entries" from "just recirculating." The landing-revenue axis only exists on a site with revenue data connected — our own site sells nothing, so our measurement covers the engagement side only
1. What we did — added related-articles cards and matched links across all 212 posts#
Bottom line: two moves. One, drop in a component that auto-renders a "related articles" card at the end of every post. Two, curate related: frontmatter on each post so links go both ways where they should. We applied both to all 212 posts in a mid-June batch.
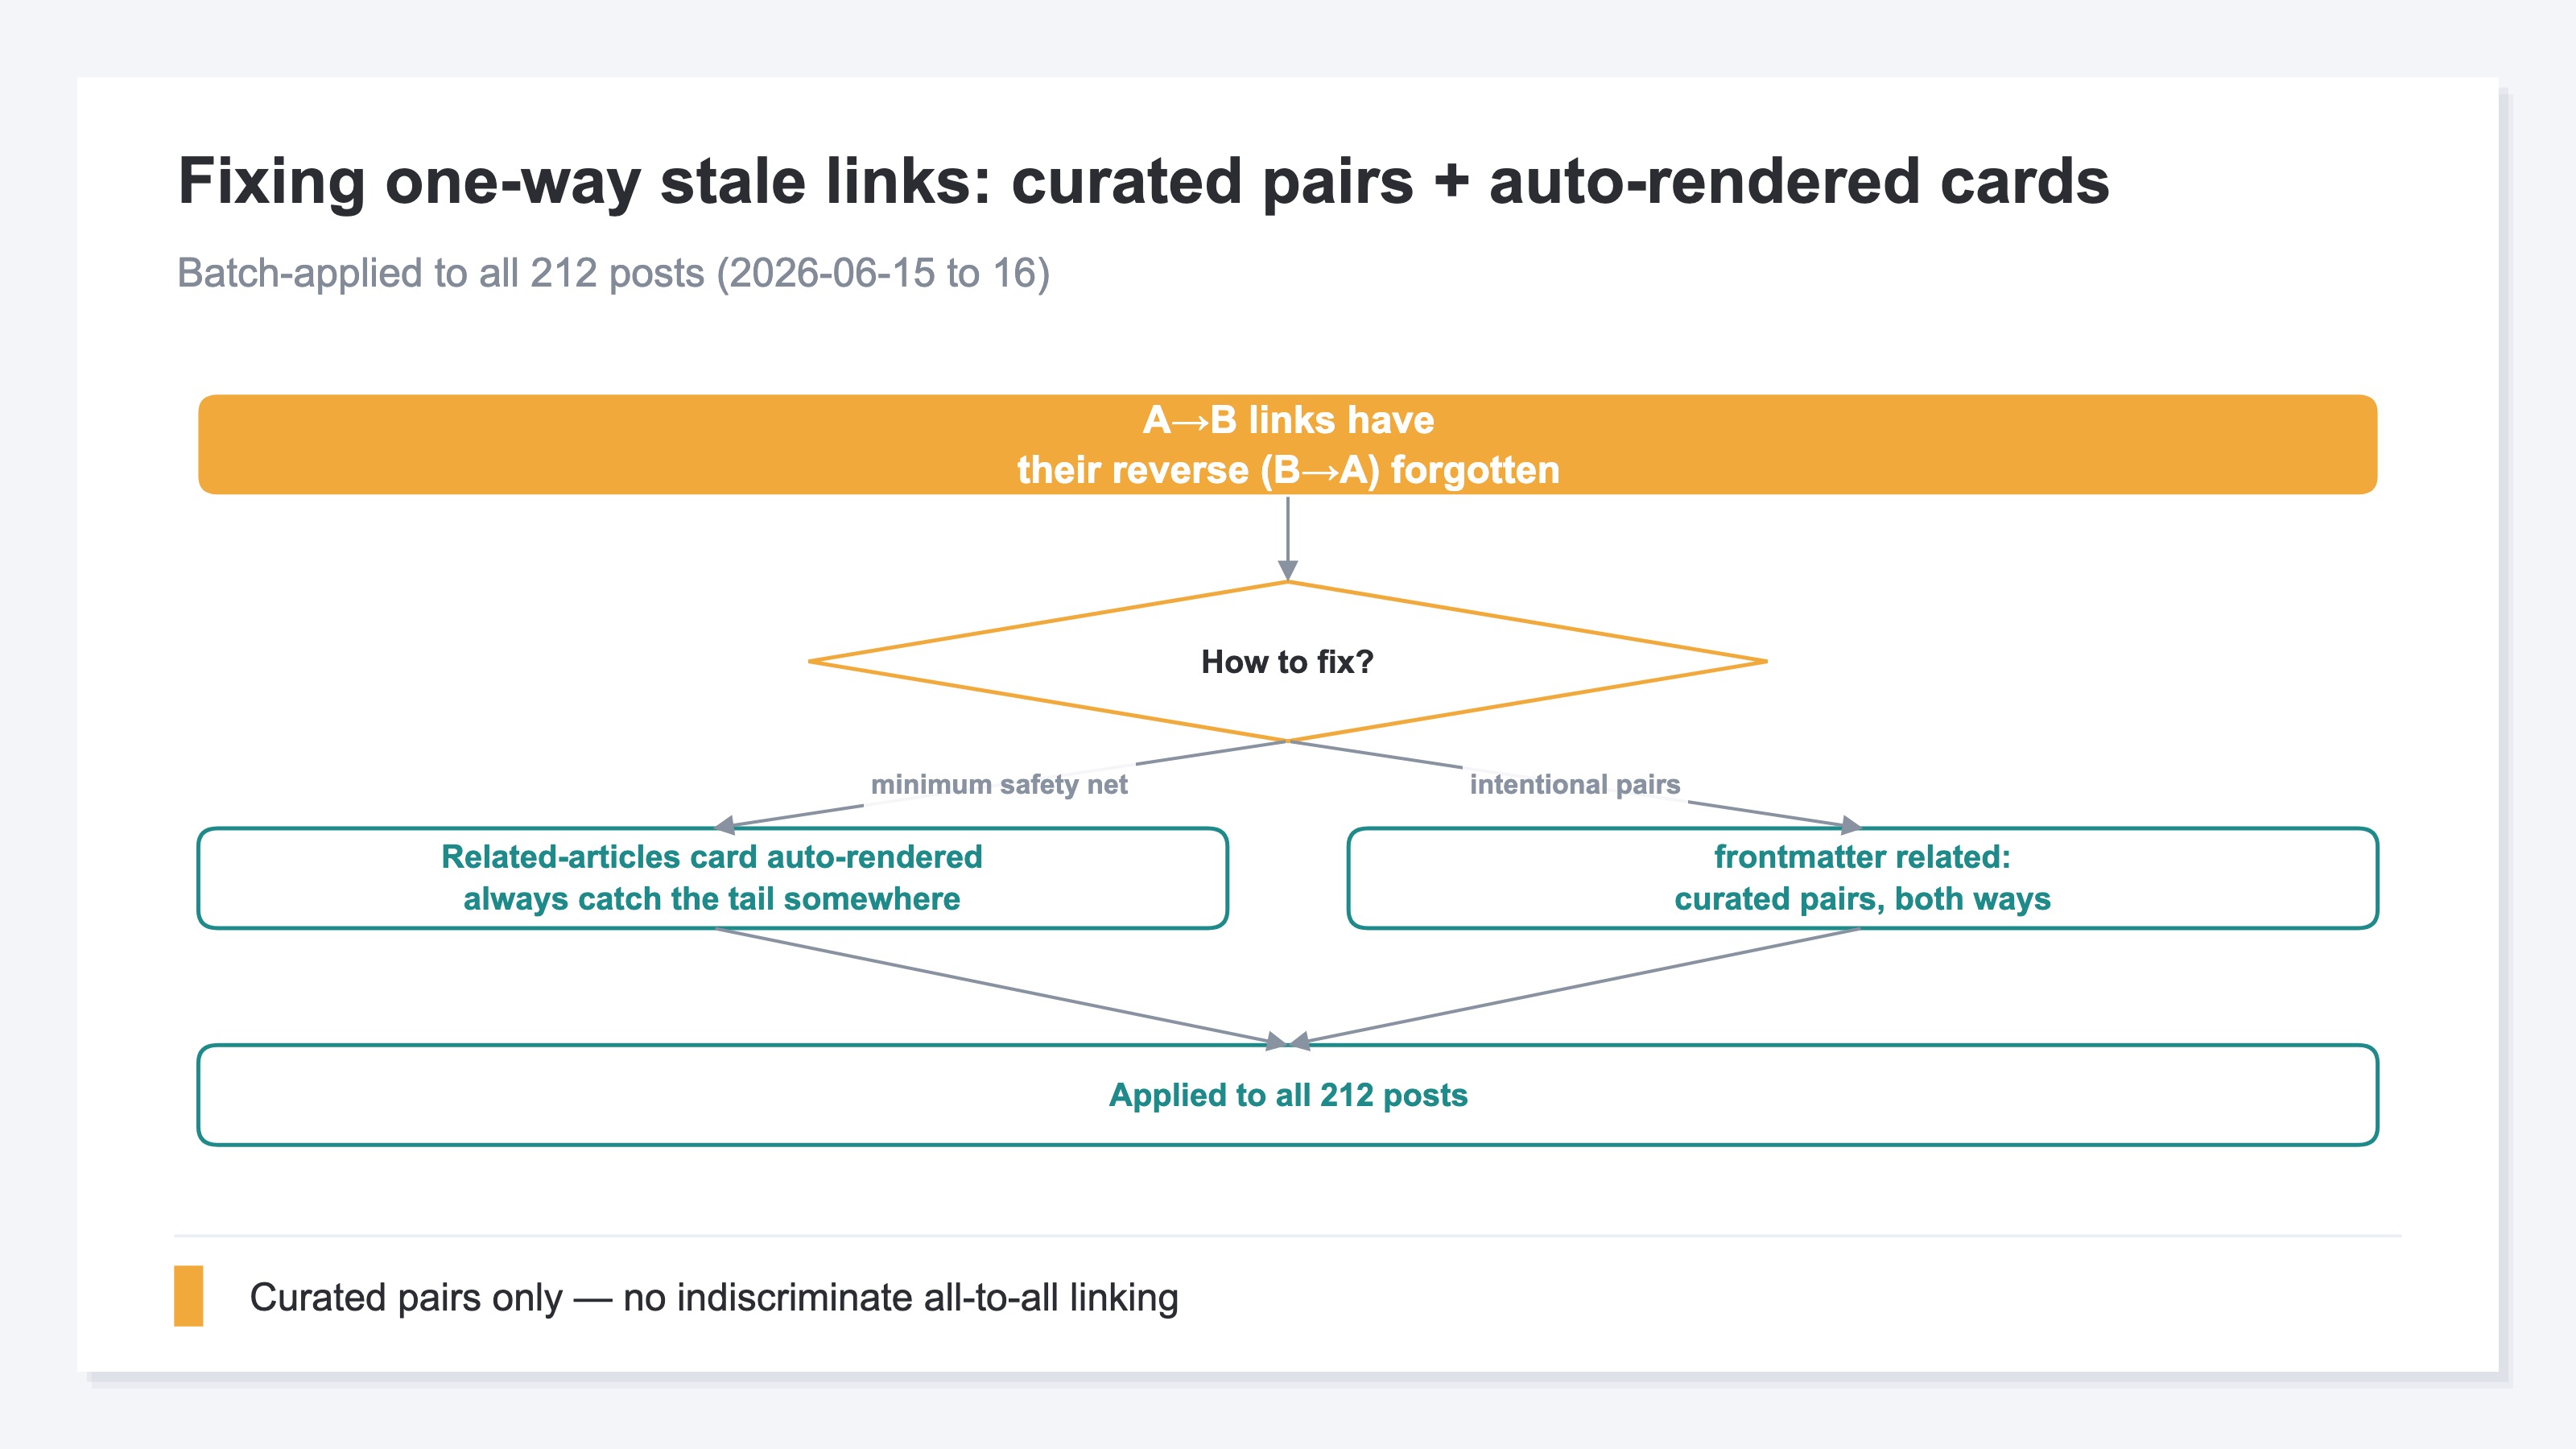
The background: internal links across posts had been mostly one-way. When you link from post A to post B, most of the time you forget to write the reverse (B back to A). Over time, a reader who lands on B has no way back to A from within B. The related-articles card, at minimum, ensures the tail of every post catches the reader and points somewhere. The related: frontmatter is where you deliberately pick which pairs should link both ways — the ones that make sense by topic cluster and revenue. The card falls back in this order: curated → same theme → recent posts.
2. 30-day measurement — pages per session rose ~14%, but that's still "suggestive" at best#
Bottom line: 30 days later, site-wide pages per session came out at roughly +14%. But the number alone can't say "bidirectional links worked." The article count also grew in the same window.
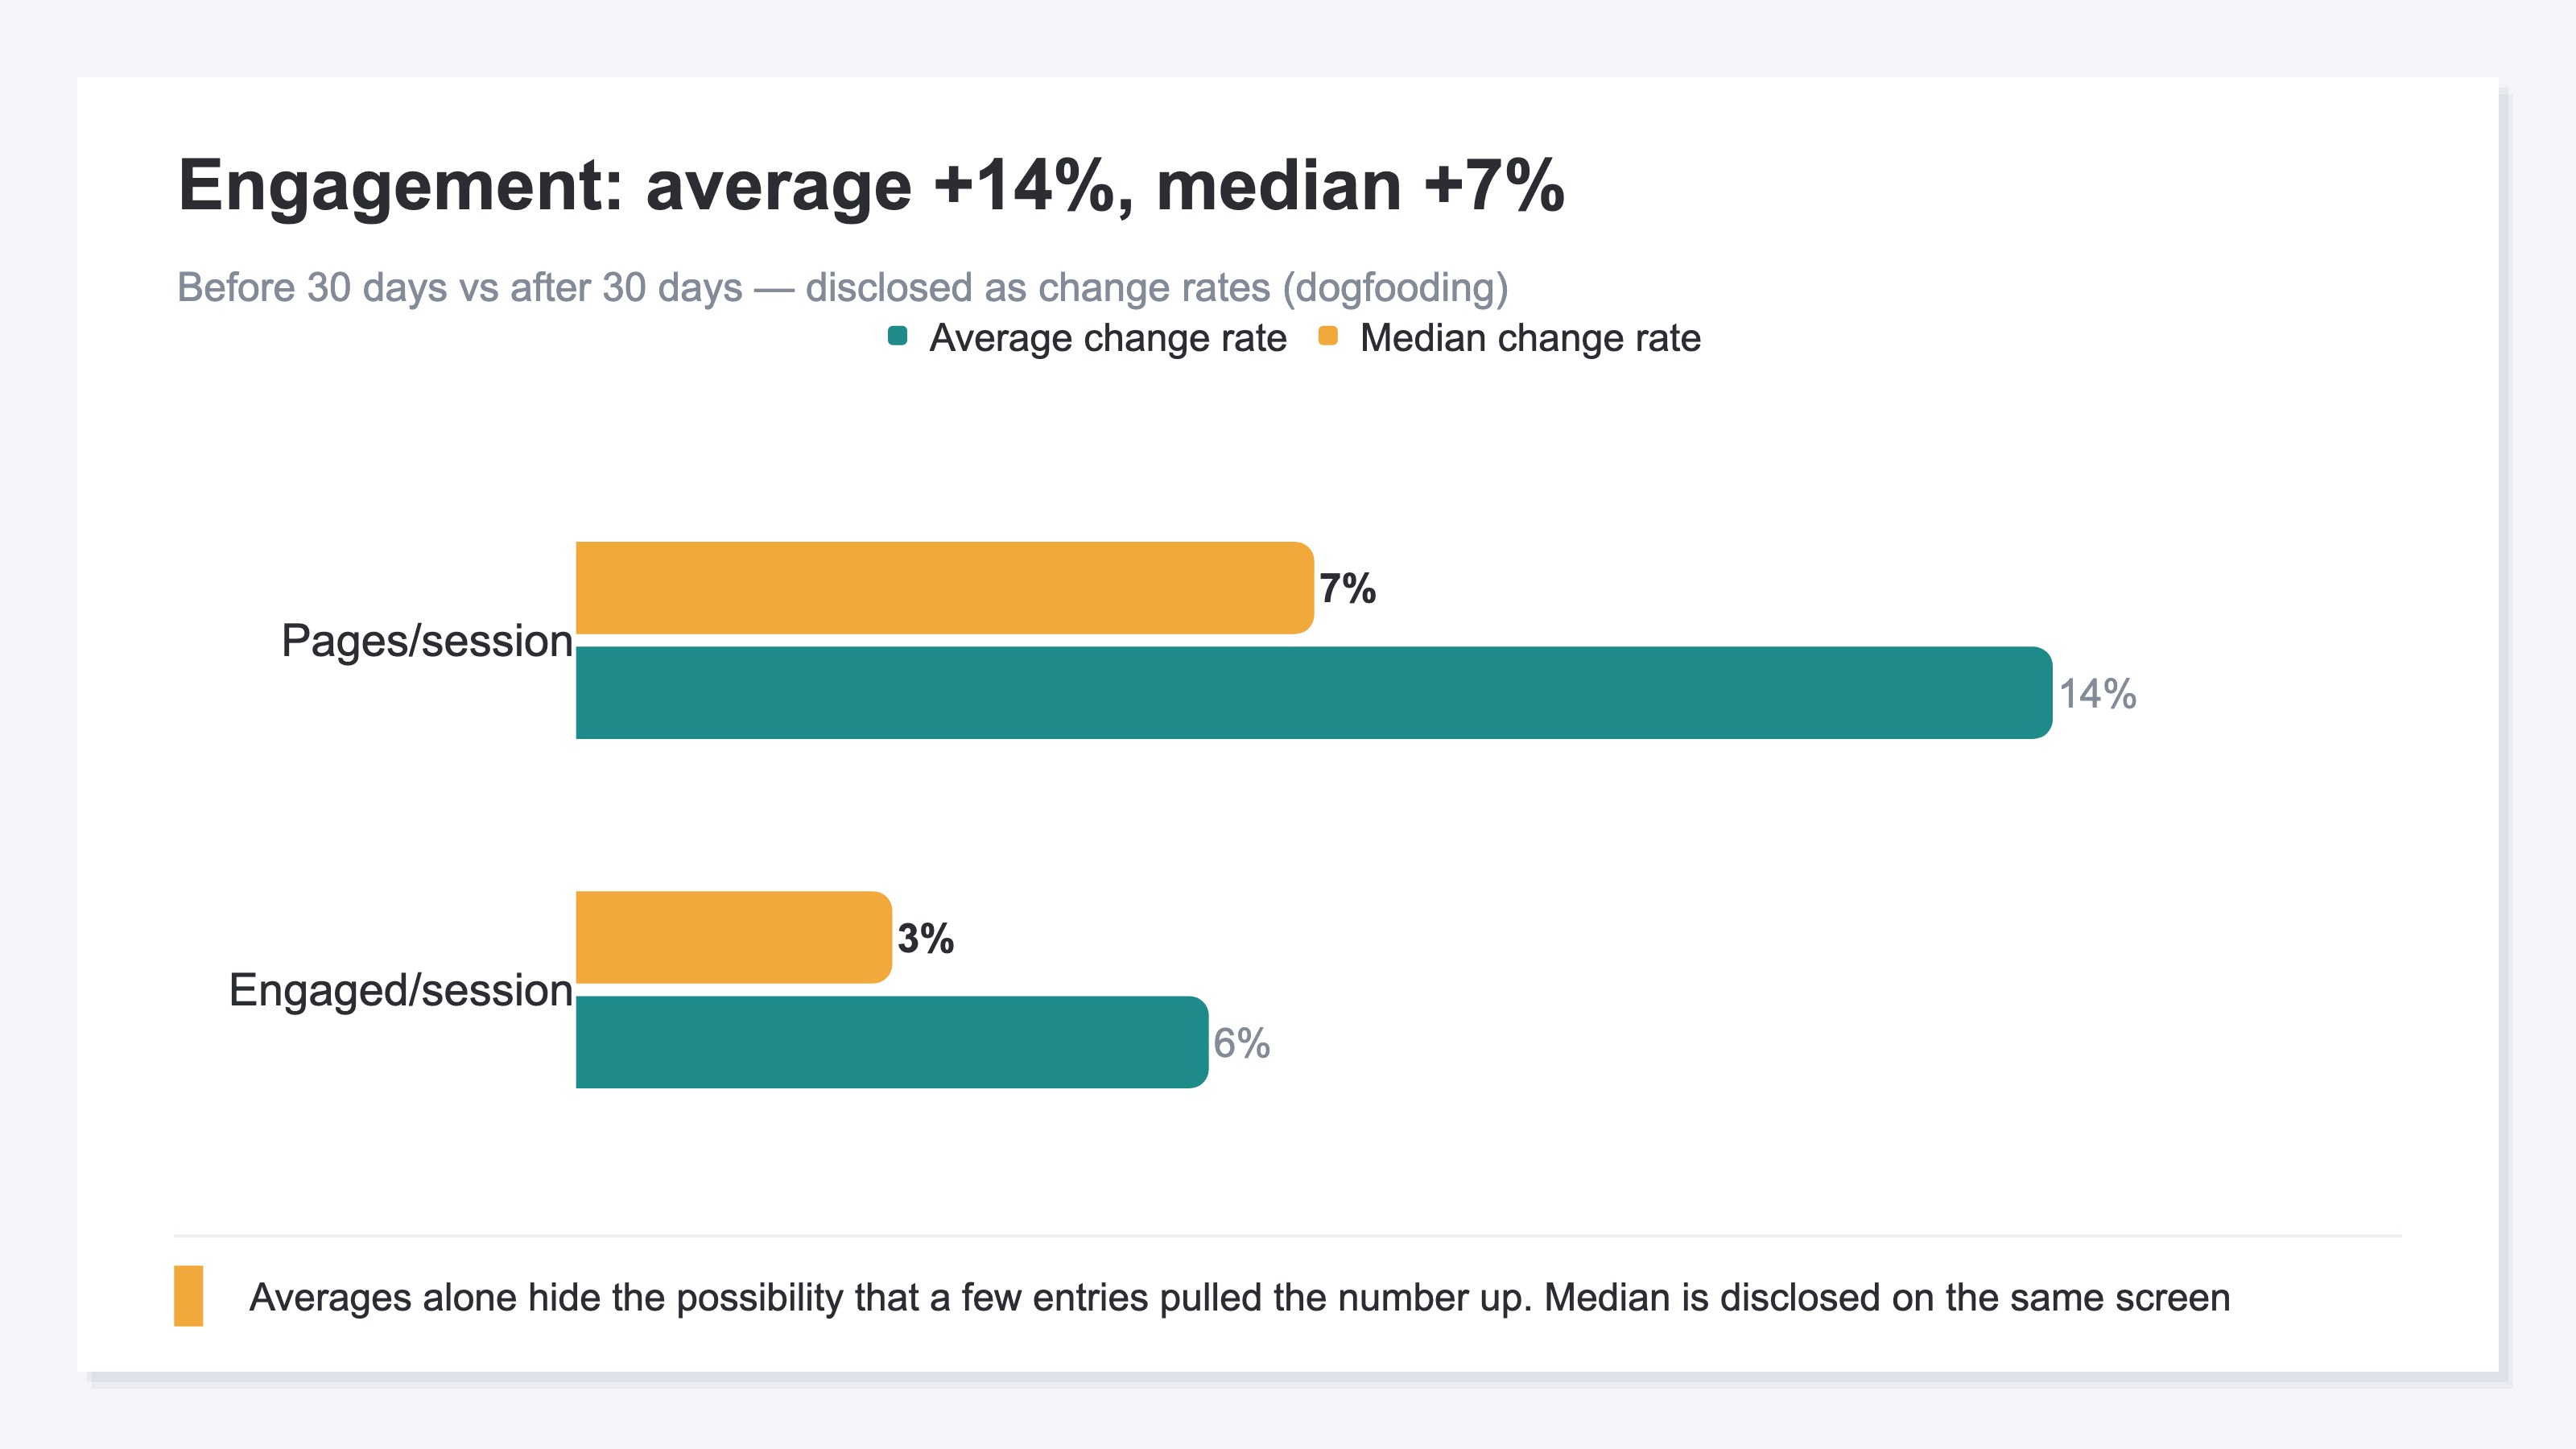
Break the number down. Numerator: site-wide pageviews. Denominator: site-wide sessions. Between the 30 days before and after, average pages per session rose ~14%. But averages alone mislead. The same metric's median only rose 7% — half of the average lift. The gap means a few entry pages did the heavy lifting; not "every article gained 14%" but "some entries lifted, others didn't." Bounce rate barely moved (-1pt). Engaged/session (share of sessions with at least a 10-second stay) rose about +6%.
Three confounders live in the same window. First, article-count growth. In this 30-day window, we added roughly a +28% jump in the total article count. New posts tend to become the landing hubs of curated links faster than legacy winners, pulling the site-wide average up. Second, seasonality. The rainy season into summer prep shifts EC operators' search intent and the shape of what they're looking up. Third, a traffic-mix shift. Organic search versus AI-referred traffic moved in ratio, and AI-referred sessions tend to circulate through curated internal links more than average.
Separate all three and you'd get the pure effect of bidirectional links. Without that separation, the 30-day before/after is "suggestive" — not "worked." The important move here is not to hide that fact and to get on with the next decision. Wrangling over "the number went up / didn't go up" is less useful than moving to "so how do we judge from here." How high-PV pages can still be underread is covered in Pages with high PV but low scroll, and setting rewrite priority by revenue is in Setting rewrite priority by revenue.
3. How to judge "worked / didn't work" — by entry page × landing revenue#
Bottom line: shift the axis. Move from "did the site-wide average change" to "per entry page, how did engagement growth move against landing-revenue period-over-period." Even without full confounder separation, laying out entries side-by-side surfaces "winning entries," "just recirculating," and "no signal."
Two axes. One: pages-per-session growth rate (after ÷ before − 1). Two: landing-revenue period-over-period. Landing revenue means revenue attributed to the entry page a visit started on — a visitor lands on a page and buys somewhere else during the same visit, and that revenue is credited back to the entry (defined in detail in Which to read by, CVR or landing revenue). Plot entries on these two axes and four quadrants emerge. Top-right: both engagement and revenue up — the winning entries. Strengthen these; funnel more curated internal links their way. Bottom-right: engagement up but revenue didn't move — the "just recirculating" state. The linked destinations aren't converting; the cluster design needs a rethink. Top-left: revenue up without engagement — likely explained by a different cause (seasonality, traffic mix); disentangle it from the bidirectional-links effect. Bottom-left: no signal — outside the scope of this rollout.
To be straight about it: this four-quadrant view doesn't complete on our own site, for two reasons. One, the vertical axis (landing revenue) can't be drawn — it's a media site that sells nothing, so landing revenue simply doesn't occur. Two, even the horizontal axis (per-entry engagement) can't be cleanly isolated as an internal-link effect. Look at per-entry period-over-period and it swings from several-hundred-percent gains to double-digit drops, tangled up with new-article growth and traffic-mix confounders — the bidirectional contribution can't be pulled out on its own. So the only thing we can stand behind as measured is the site-wide aggregate (pages per session 1.4 → 1.59, about +14%). The full per-entry × landing-revenue quadrants only materialize on an e-commerce site with revenue data connected — which is why that view is shown separately, on the sample store's demo screen, in the next section.
Averages of before/after can't separate top-right from bottom-right. The apparent "+14% site-wide lift" could be bottom-right entries doing the pulling. Only when you get down to per-entry × landing revenue can you split the next move (strengthen, redesign, ignore). Get this into one screen or per-entry judgment breaks down. Building it in GA4 means a pages-per-session exploration report plus an entry_page-attributed revenue report — two views, cross-referenced. Weekly, that's heavy. The lifting of that weight comes in the next section. Setting weekly-improvement priority by revenue is also covered in Setting weekly website-improvement priority by revenue.
RevenueScope helps
By now it's clear that judging bidirectional links by the site-wide average misses the point; the judgment happens at per-entry engagement growth × landing-revenue period-over-period. What's left is producing that per-entry view weekly.
RevenueScope ships that view. Per-entry engagement (pageviews, unique visitors, average time on page, bounce rate with period-over-period, plus GSC impressions, clicks, and position) comes from get_breakdown (dimension=page) on one screen. Entry-page-attributed landing revenue comes from get_content_actions, measured. Two GA4 exploration reports cross-referenced by hand collapse into these two calls.
Which entries rose and which sank on engagement lines up in that one screen. But engagement alone can't say whether a lifted entry is a "winner" that carried revenue or one that's "just recirculating." That split comes from the vertical axis — landing revenue — which only lines up on a site with revenue data connected. What the full four quadrants look like with that axis is visible on the sample store's demo screen. Once you're down at per-entry granularity, you can decide separately which pages to strengthen with more inbound links (winners) and which clusters to redesign (just recirculating).
One thing to be clear about. What RevenueScope gives you is entry-page-attributed landing revenue and the main KPIs — not per-page conversion rate (what share of a page's visits converted). Because landing revenue is attributed to the entry page, purchases made after a visitor wanders around are counted toward the entry rather than the product page. Gross margin and inventory are out of scope. What RevenueScope takes on is lining up engagement and revenue per entry. Which entries to strengthen — and which clusters to redesign — is up to you.
FAQ#
Frequently asked questions#
Q. Pages per session rose ~14% in 30 days. Can't we just say it worked?
A. The number moved — but no, not "worked" as a conclusion. Three confounders live in the same window: article count grew about +28%, seasonality shifted, and traffic mix changed. The pure effect of bidirectional links isn't separable from those. The median only moved +7%, well short of the average's lift, so a few entries likely pulled the average up. Rather than declare on the average alone, drop to entry × landing revenue to see which entries actually gained — and you'll make fewer wrong next moves.
Q. Should pages per session or engaged/session be the primary metric?
A. If the point is "did engagement reach reading depth," engaged/session is safer. Pages per session's numerator includes "opened and bounced" pages, whereas engaged/session (share of sessions with at least a 10-second stay) leans toward sessions where the reader actually engaged with the content. This article disclosed both, but when deciding the next move (strengthen, redesign), we recommend reading engaged/session as the primary.
Q. Isn't there a downside to bidirectional links (diluted PageRank flow)?
A. Blanketing every post with links to every other post is risky. The rule is "link where the content is related," and pairs curated on topic-cluster and revenue logic are the safe scope. Even on the all-212 rollout, we deliberately restricted links to inside-cluster pairs — unrelated posts don't auto-link. Google also recommends linking between related pages in the internal-links documentation [1].
Summary#
Thirty days after adding related-articles cards and matching internal links across all 212 posts, site-wide pages per session came out at roughly +14%. But new-article growth, seasonality, and traffic-mix shifts share the same window, and we can't cleanly separate them out. The median only moved +7%, so the average may have been pulled by a few entries.
Rather than argue on the average, move on. Shift the axis from "did the site-wide average change" to "per-entry engagement growth rate against landing-revenue period-over-period," and winners (strengthen), just-recirculating (redesign), and no-signal (skip) fall into separate buckets. Building this in GA4 means hand-rolled exploration reports — heavy work weekly.
RevenueScope returns per-entry engagement on one screen, and on a site with revenue data connected, landing revenue lines up alongside it. Whether you can drop below the before/after average to per-entry granularity is what decides the next move (which clusters to strengthen) for a bidirectional-links rollout.
See which ads actually drive revenue, at a glance
Free up to 2,000 sessions/month, AI connection included. No credit card required. Up and running in 5 minutes.




![[Research] More AI Traffic Isn't Proof It Worked: Tell the Real Gain by Revenue](/_next/image?url=%2Fimages%2Fnews%2Fai-referral-revenue-real.jpg&w=3840&q=75)