
The three operators in this article are illustrative case studies built from EC field interviews and public data. They are not real companies or real performance disclosures. The lift figures (+15% / +8% / +22%) sit inside the +5-20% range typically observed in the field for ad-budget reallocation.
Note on terminology: Revenue Per Session (RPS) is not yet a widely standardized industry term. We use "RPS" because it captures revenue efficiency in a single number — Revenue ÷ Sessions — that integrates AOV and CVR.
"Where should I push my ad budget, and by how much?" This is the most common question we hear from Shopify EC operators in the ¥10M-50M monthly revenue range. Pushing budget to the highest-CVR channel does not lift revenue. Pushing to the highest-ROAS channel only adds operating overhead. Without a single decision axis, budget allocation drifts and performance plateaus.
Revenue Per Session (RPS) — revenue divided by sessions — is the absolute revenue-efficiency metric that integrates AOV and CVR. With RPS as the primary axis, you can answer "which channel actually generates revenue?" with one number. This article walks through three illustrative case studies (apparel, general goods, food/D2C) to lay out the practical workflow.
TL;DR#
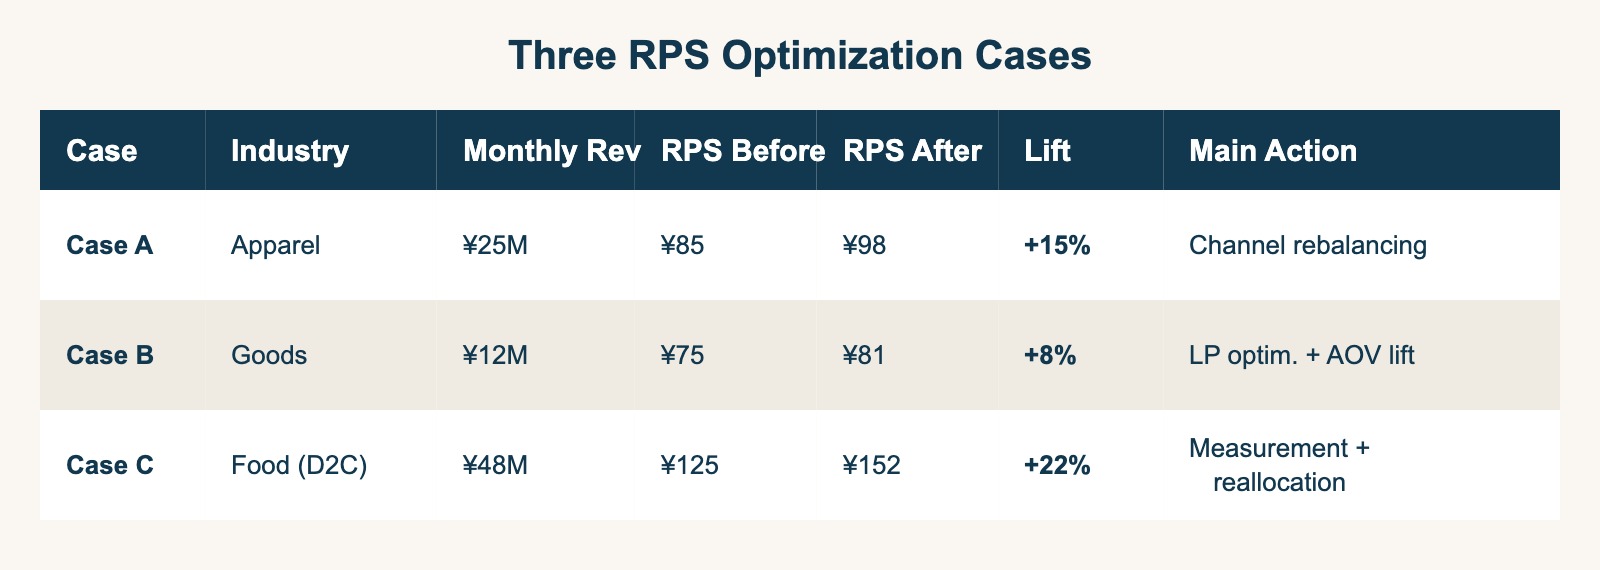
- Three illustrative case studies — apparel (+15%), general goods (+8%), food/D2C (+22%) — demonstrate the RPS-first ad-budget reallocation workflow. Lift figures sit within the typical +5-20% field range
- The framework is shared across all three: ① measure your "current position" against the industry RPS median, ② plot each channel on the RPS × CVR four-quadrant matrix, ③ shift budget from low-RPS channels into high-RPS channels
- Case C (food/D2C) failed in the first three months. The team adopted RPS-first decisions but had measurement gaps (UTM drift, Safari ITP cookie loss, last-touch-only attribution). After fixing the measurement layer, RPS reached +22%
1. Three-Case Overview — RPS × CVR Quadrant Framework#
Summary of all three. Monthly revenue range ¥10M-50M, all on Shopify, all adopted Revenue First thinking (evaluate ad efficiency starting from revenue, not from intermediate metrics).
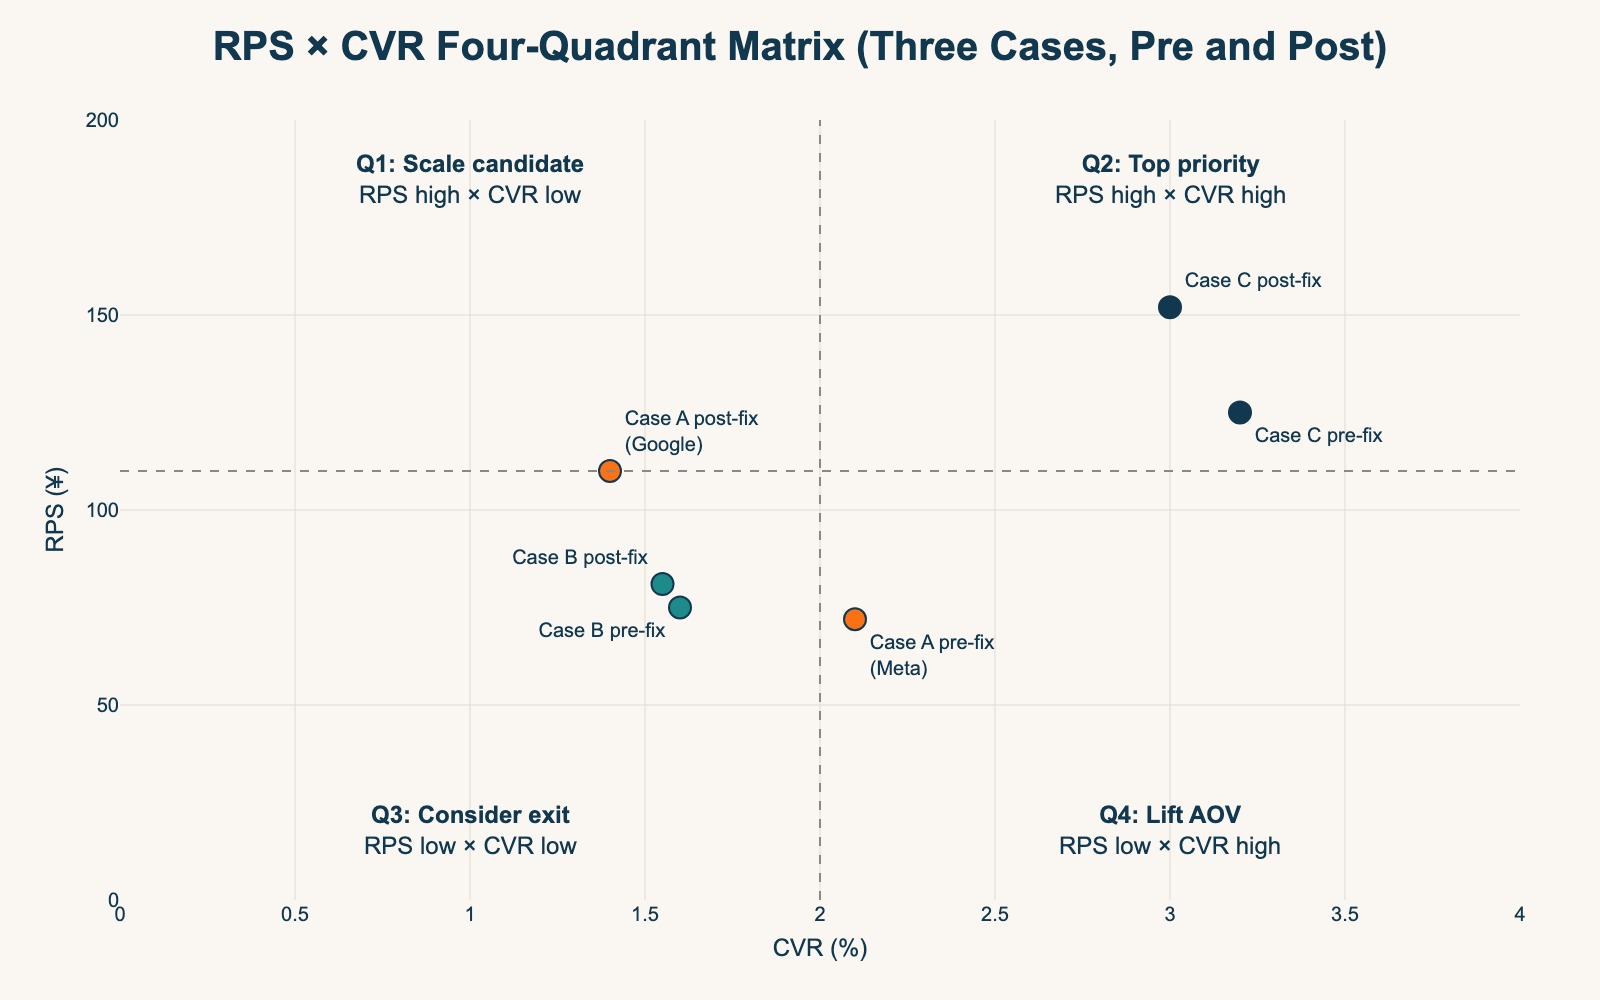
The shared framework: plot each channel on a two-axis (RPS × CVR) quadrant. Shift budget from Q3 (both low) into Q2 (both high) or Q1 (high RPS / low CVR). See the companion piece "RPS vs CVR: A Two-Axis Framework" for the full framework.
2. Case A: Apparel EC — Channel Rebalancing for RPS+15%#
Starting point: ¥25M monthly revenue. 70% of ad budget concentrated on Meta (Instagram + Facebook). CVR was 2.1% via Meta, 1.4% via Google Search, 1.8% organic — Meta looked like the winner.
The gap: On RPS, Meta was ¥72, Google Search was ¥110, organic ¥95. AOV via Meta was only ¥3,400, less than half of Google Search at ¥7,800. Meta was driving high-volume, low-AOV traffic — high CVR but sacrificing AOV.
Action: Cut Meta from 70% to 40% of budget. Reallocate 20% to Google Search, 20% to organic SEO investment, 10% to retargeting. On the Meta side, switched to catalog ads prioritizing higher-AOV items.
Outcome: After three months, overall RPS went from ¥85 to ¥98 (+15%). Revenue from ¥25M to ¥28.4M. Meta CVR dropped 2.1% to 1.7%, but Meta AOV climbed ¥3,400 to ¥4,800, so Meta RPS itself improved ¥72 to ¥82. The number passed the apparel industry RPS median of ¥90 [1] and started climbing toward the top-25% threshold of ¥200.
A high-CVR channel is not automatically a high-efficiency channel. Channels with low AOV tend to "drive volume without driving revenue" — exactly the pattern RPS exposes.
3. Case B: General Goods EC — LP Optimization and AOV Lift for RPS+8%#
Starting point: ¥12M monthly revenue. Household goods, kitchen items. Budget split evenly (Meta 30% / Google Search 30% / Yahoo 20% / organic 20%). RPS at ¥75, near the lower end of the estimated industry-median range of ¥80-100 [2]. Increasing ad spend was no longer producing proportional revenue lift.
The gap: Per-channel RPS was tightly clustered (Meta ¥68, Google Search ¥82, Yahoo ¥71, organic ¥78). Channel mix was not the bottleneck. Sitewide AOV (¥3,200) was the structural issue. General-goods carts often hold a single item, CVR at 1.6% (industry-median territory).
Action: Keep the channel mix; invest on the site side instead. ① Raised free-shipping threshold from ¥3,500 to ¥5,000. ② Added "frequently bought together" module on product pages. ③ Klaviyo cart-recovery email. ④ A/B tested hero image and CTA.
Outcome: After three months, overall RPS went ¥75 to ¥81 (+8%). AOV climbed ¥3,200 to ¥4,100, CVR dipped slightly (1.6% to 1.55%), but the composite RPS improved. Revenue ¥12M to ¥12.95M.
When per-channel RPS is tight, reallocating channels won't move RPS. Sitewide AOV lift becomes the higher-priority lever. The +8% lift is the smallest of the three cases but sits realistically near the lower end of the +5-20% field range.
4. Case C: Food/D2C EC — Initial Failure, Then Measurement Fix for RPS+22%#
The largest lift of the three — and the one that failed first. The lesson here is on measurement-layer design.
Starting point: ¥48M monthly revenue. D2C food (health products, gifts). High repeat rate, CVR at 3.2% (food-industry median ~3.0% [1]). RPS at ¥125, just below the industry median of ¥135. Budget split evenly between Meta and Google Search.
Initial failure (months 1-3): The team introduced RPS-first decisions but pushed budget to the wrong channel due to measurement gaps:
- UTM drift: utm_source=facebook and Facebook were tagged as separate channels, undercounting Meta-attributed RPS
- Cookie limits: Safari ITP suppressed Meta-attributed conversions
- Last-touch only: Assist effect was ignored, so organic search contribution looked too low
The team cut Meta and shifted to Google Search — the wrong call. After three months, overall RPS moved only from ¥125 to ¥128 (+2.4%). Revenue ticked up but retargeting cuts likely cost some repeat-purchase opportunities.
Measurement fix (months 4-6): After detecting the failure, the team rebuilt the measurement layer. ① UTM auto-normalization (lowercase + trim across all utm_source variants). ② dataLayer redundancy (capture revenue from GA4 ecommerce dataLayer.push as a parallel path, mitigating cookie-loss impact). ③ Last-touch + assist hybrid (last-touch primary, assist visible for any touch within 3 clicks).
Outcome: Three months after the measurement fix, overall RPS went ¥128 to ¥152 (+18.8%). Cumulative from the original starting point: ¥125 to ¥152 (+22%). Revenue ¥48M to ¥58.56M. Past the industry median of ¥135, climbing toward the top-25% threshold of ¥280.
RPS-first decisions presuppose accurate measurement. If UTM drift, cookie loss, and attribution model are not handled, the very numbers driving the decision are skewed.
5. Common Decision Axes — Anchor on Industry RPS Median#
Three common decision axes emerge from these cases.
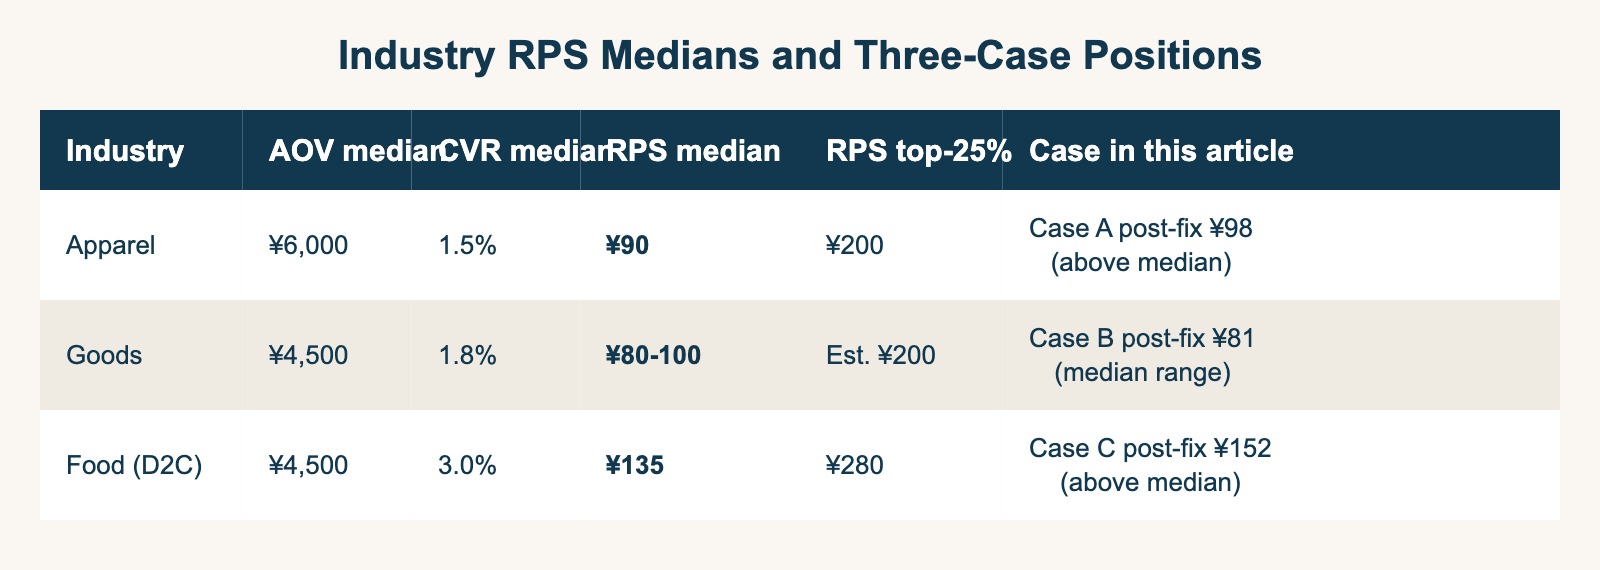
① Anchor on the industry RPS median: Without knowing your industry's median and top-25% range, you cannot tell whether you are above or below average. Apparel ¥90, food/D2C ¥135, cosmetics ¥110, electronics ¥200 — the industry spread is 2-3× [1]. Without an industry-anchored starting point, you misread your own headroom. See "Industry RPS Benchmark" for the full benchmark.
② Plot each channel on the RPS × CVR matrix: The shared framework all three used. Shift Q3 (both low) channel budget into Q2 (both high) or Q1 (RPS high, CVR low). Case A's Meta-cut / Google-Search-expand was the textbook pattern.
③ Measurement accuracy is a precondition: Case C demonstrated this. Without UTM normalization, cookie-loss mitigation, and attribution model integrity, the RPS numbers themselves are skewed. See "The Complete RPS (Revenue Per Session) Guide" for the underlying definition and formula.
The Japanese B2C EC market reached ¥26.1 trillion in 2024 [3], and the quality of ad budget allocation directly drives growth. The Revenue First dashboard design pattern is laid out in "Revenue Dashboard Design". The next piece in this series will provide an interactive RPS calculator that reproduces the figures shown across these three cases. Migrating from CVR-only judgment to RPS-as-primary is mostly a KPI configuration change in your dashboard — not a tooling overhaul.
References#
[1] Dynamic Yield 「E-commerce Benchmarks」 2025
[2] Yotpo 「2025 State of E-commerce」 2025
[3] Ministry of Economy, Trade and Industry (Japan) 「FY2024 E-commerce Market Survey」 August 2025
See which ads actually drive revenue, at a glance
Free up to 5,000 sessions/month, AI analyst included. No credit card required. Up and running in 5 minutes.
Start measuring for free