
You've finished the monthly report. Revenue, sessions, the channel breakdown — every number is lined up neatly. And yet, right there, your hand stops. "So… where do I start?" you think, staring at the screen for a while. Does that way of stalling sound familiar?
You stall not because your analysis is weak. A report is a lineup of "what happened," not a lineup of "what to do next." What you get stuck on, every time, is the single question of which of all these numbers to act on.
The goal of this article is to keep the monthly report from ending at reporting and connect it to your next move. The key is to choose that move not "in order of biggest change" but "in order of what moves revenue." Written for EC operators, step by step, in plain terms.
Contents
TL;DR#
-
Stalling on the monthly report isn't an analysis problem
The report is a list of "what happened," not a list of "what to do next." What you get stuck on is the single question of which number to act on.
-
Act in order of what moves revenue, not what moved the most
People react to the number with the biggest change rate, but change rate and revenue impact are different things. Mix them up and you spend your effort chasing small numbers.
-
Getting the revenue-impact order out is heavy by hand
To produce it you have to cross-reference channels, period-over-period movement, AI-referred traffic, and KPIs. The idea is simple, but running it by hand every month is heavy. Hand the reordering back to a machine and a bridge forms from reporting to action.
1. Why You Stall After the Report Is Done#
Bottom line: a report is easy to treat as "done" the moment it's made, and the sense of accomplishment stops your hand. The real work starts after it's made, at "so, what now."
Building a monthly report has a clear finish. You gather the numbers, tidy them, turn them into charts, paste them into a deck. Get this far and there's a sense of "this month is wrapped up," and that becomes a stopping point. But what's lined up in the report is a record of the past — "here's how last month went." The work of deciding "so where do I act this week" hasn't moved a single step yet. Between the step of making and the step of deciding, there's an invisible ledge.
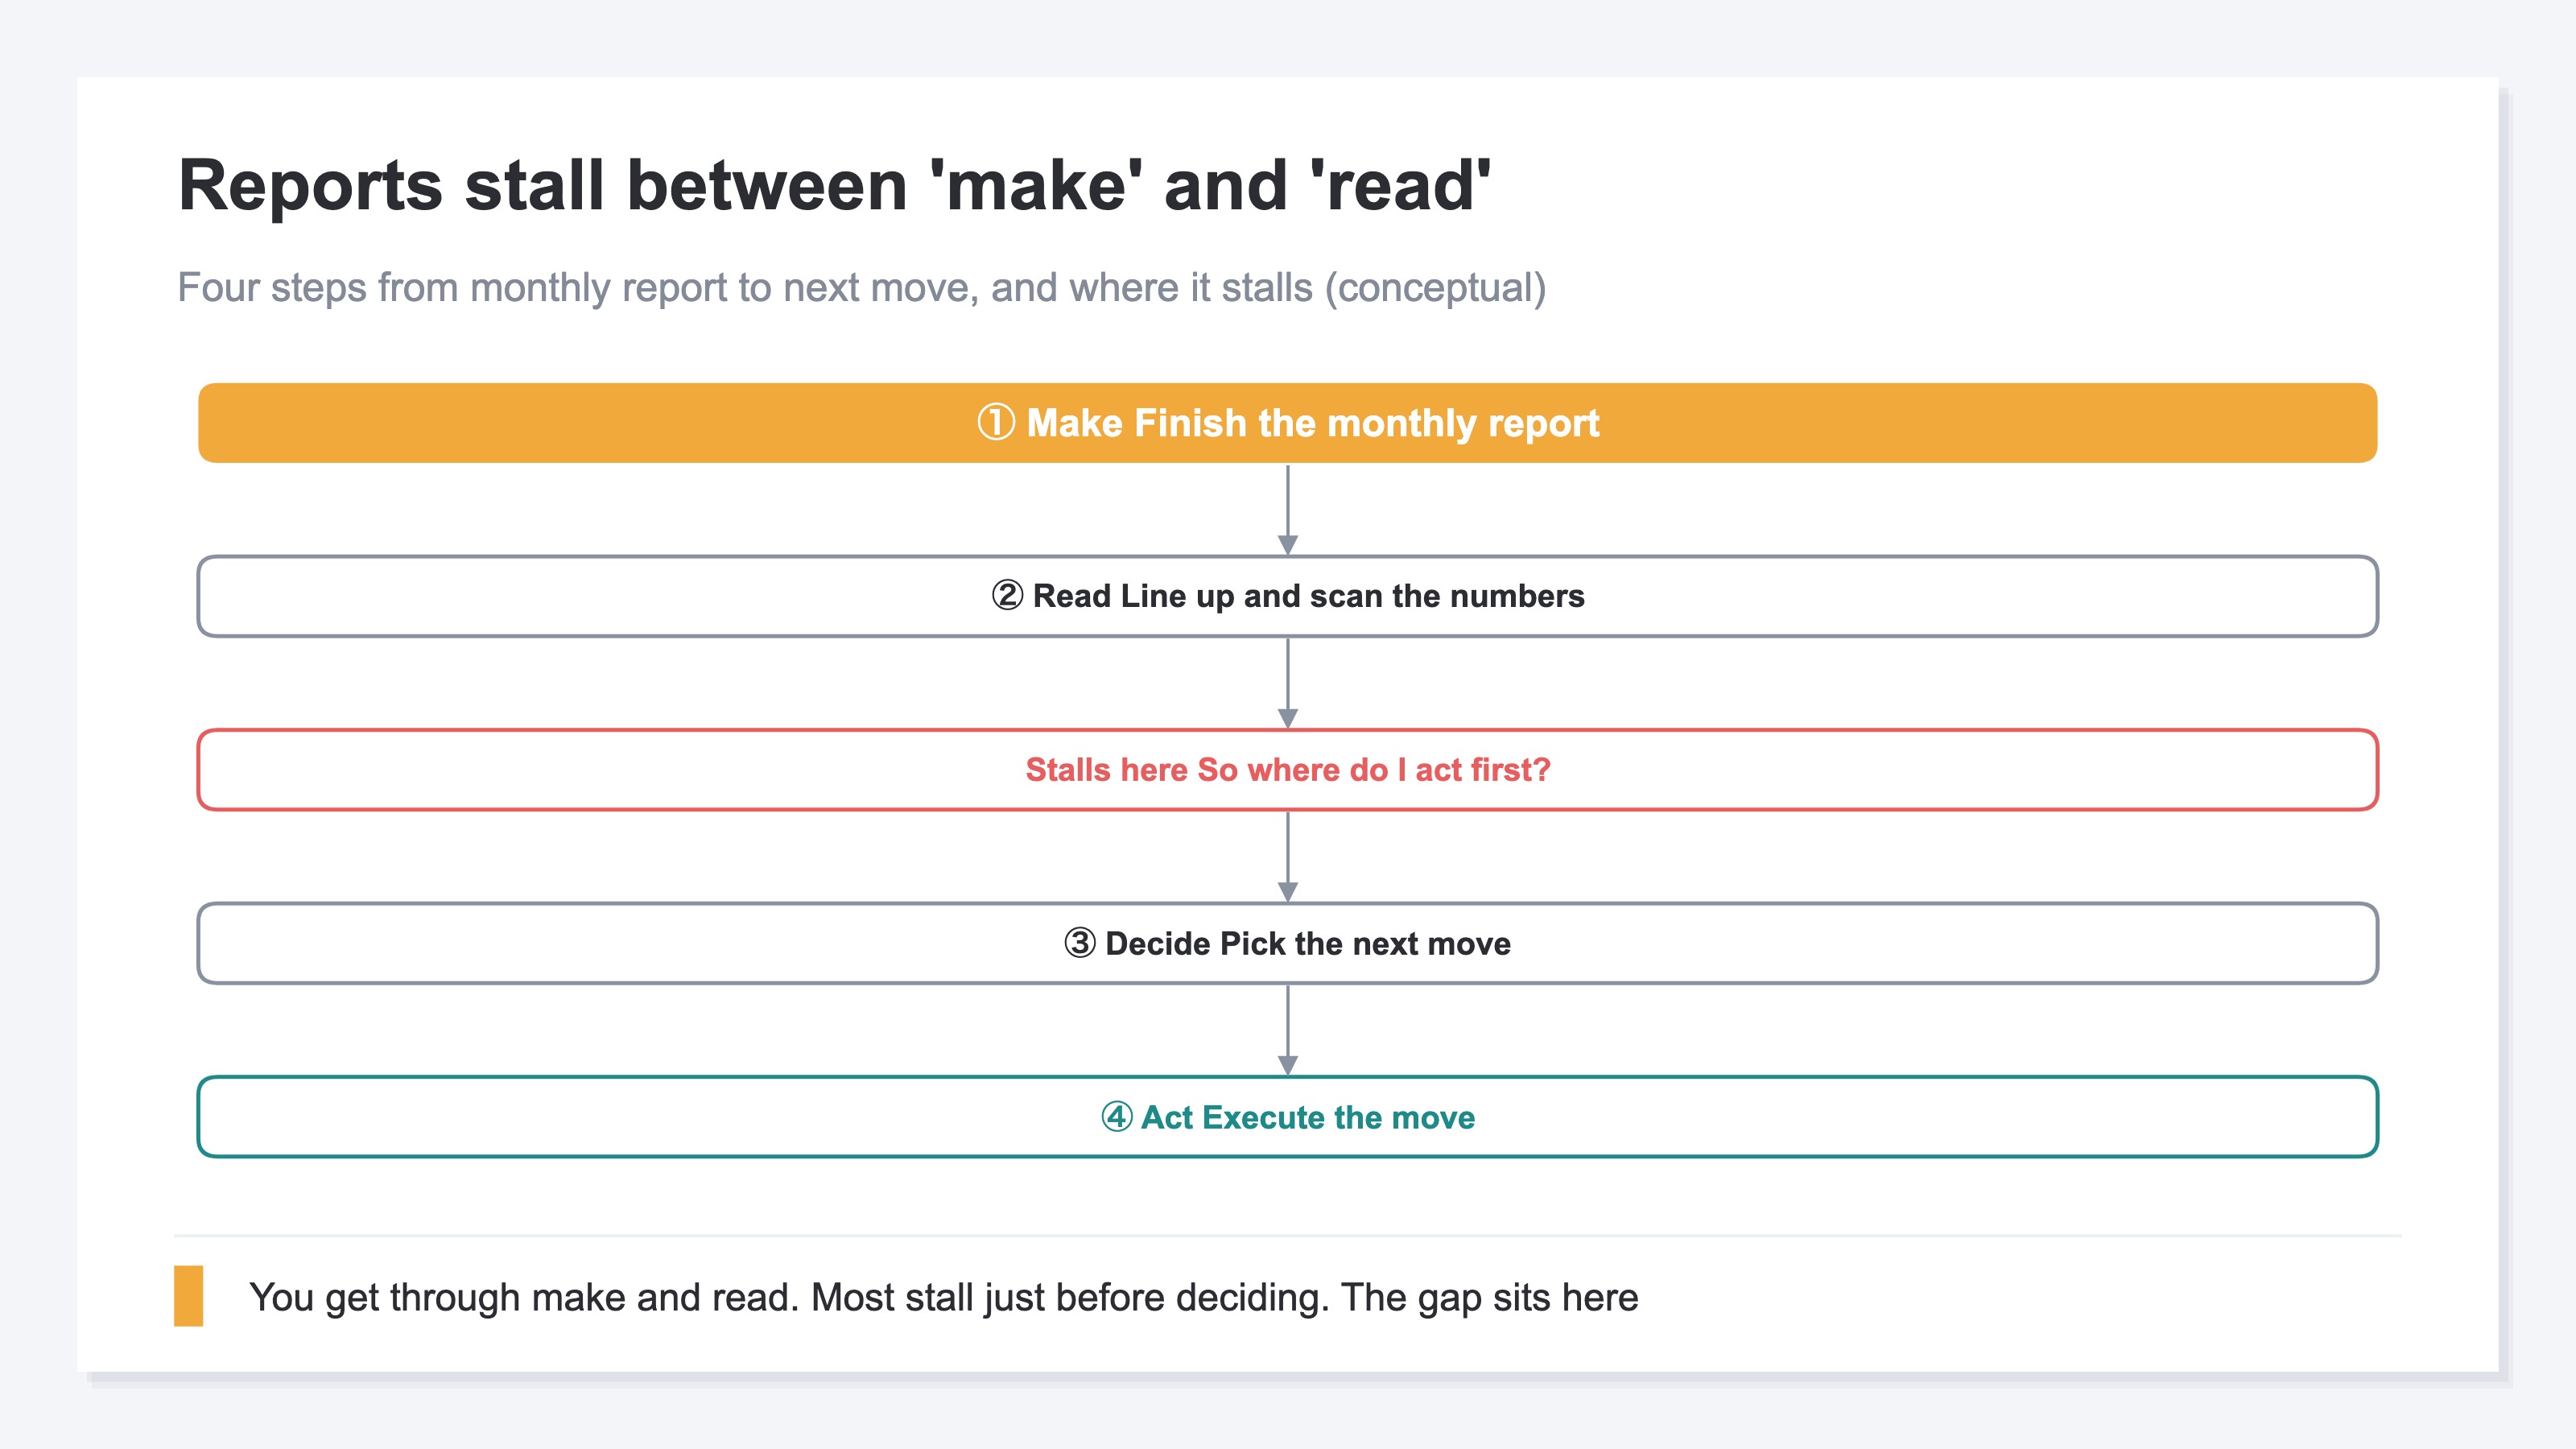
The tricky part is that the moment you try to move on to deciding, you run short of material again. The report shows you "revenue fell," but it doesn't lay out "which channel's drop, of how much, is doing the most damage." Having AI build the report itself to cut the manual work is covered separately in Build your monthly report with AI — stop retyping, connect the data, and the design of what to put on it in Put revenue on one page — how to think about a one-pager. What this article deals with is what comes after that: once it's made, where do you move from.
2. Pick the Next Move by Revenue Impact, Not Change Rate#
Bottom line: people's eyes go to the number with the biggest change, but what you should act on is what moves revenue — because the size of a change rate and the size of a revenue impact are two different things.
Looking over a report, the first thing that jumps out is a number with a big change rate, like "down 40 percent versus the prior period." People can't help but react to whatever moved most dramatically. But there's a trap here. If the channel that fell 40 percent was only generating a few thousand yen a month to begin with, fixing it barely moves revenue at all.
Meanwhile, suppose your single largest revenue channel was "only down 8 percent." It isn't flashy, but converted into yen it may be cutting into revenue far more. In other words, unless you re-sort your priorities from "order of change rate" to "order of what moves revenue," you'll pour your effort into chasing small numbers.
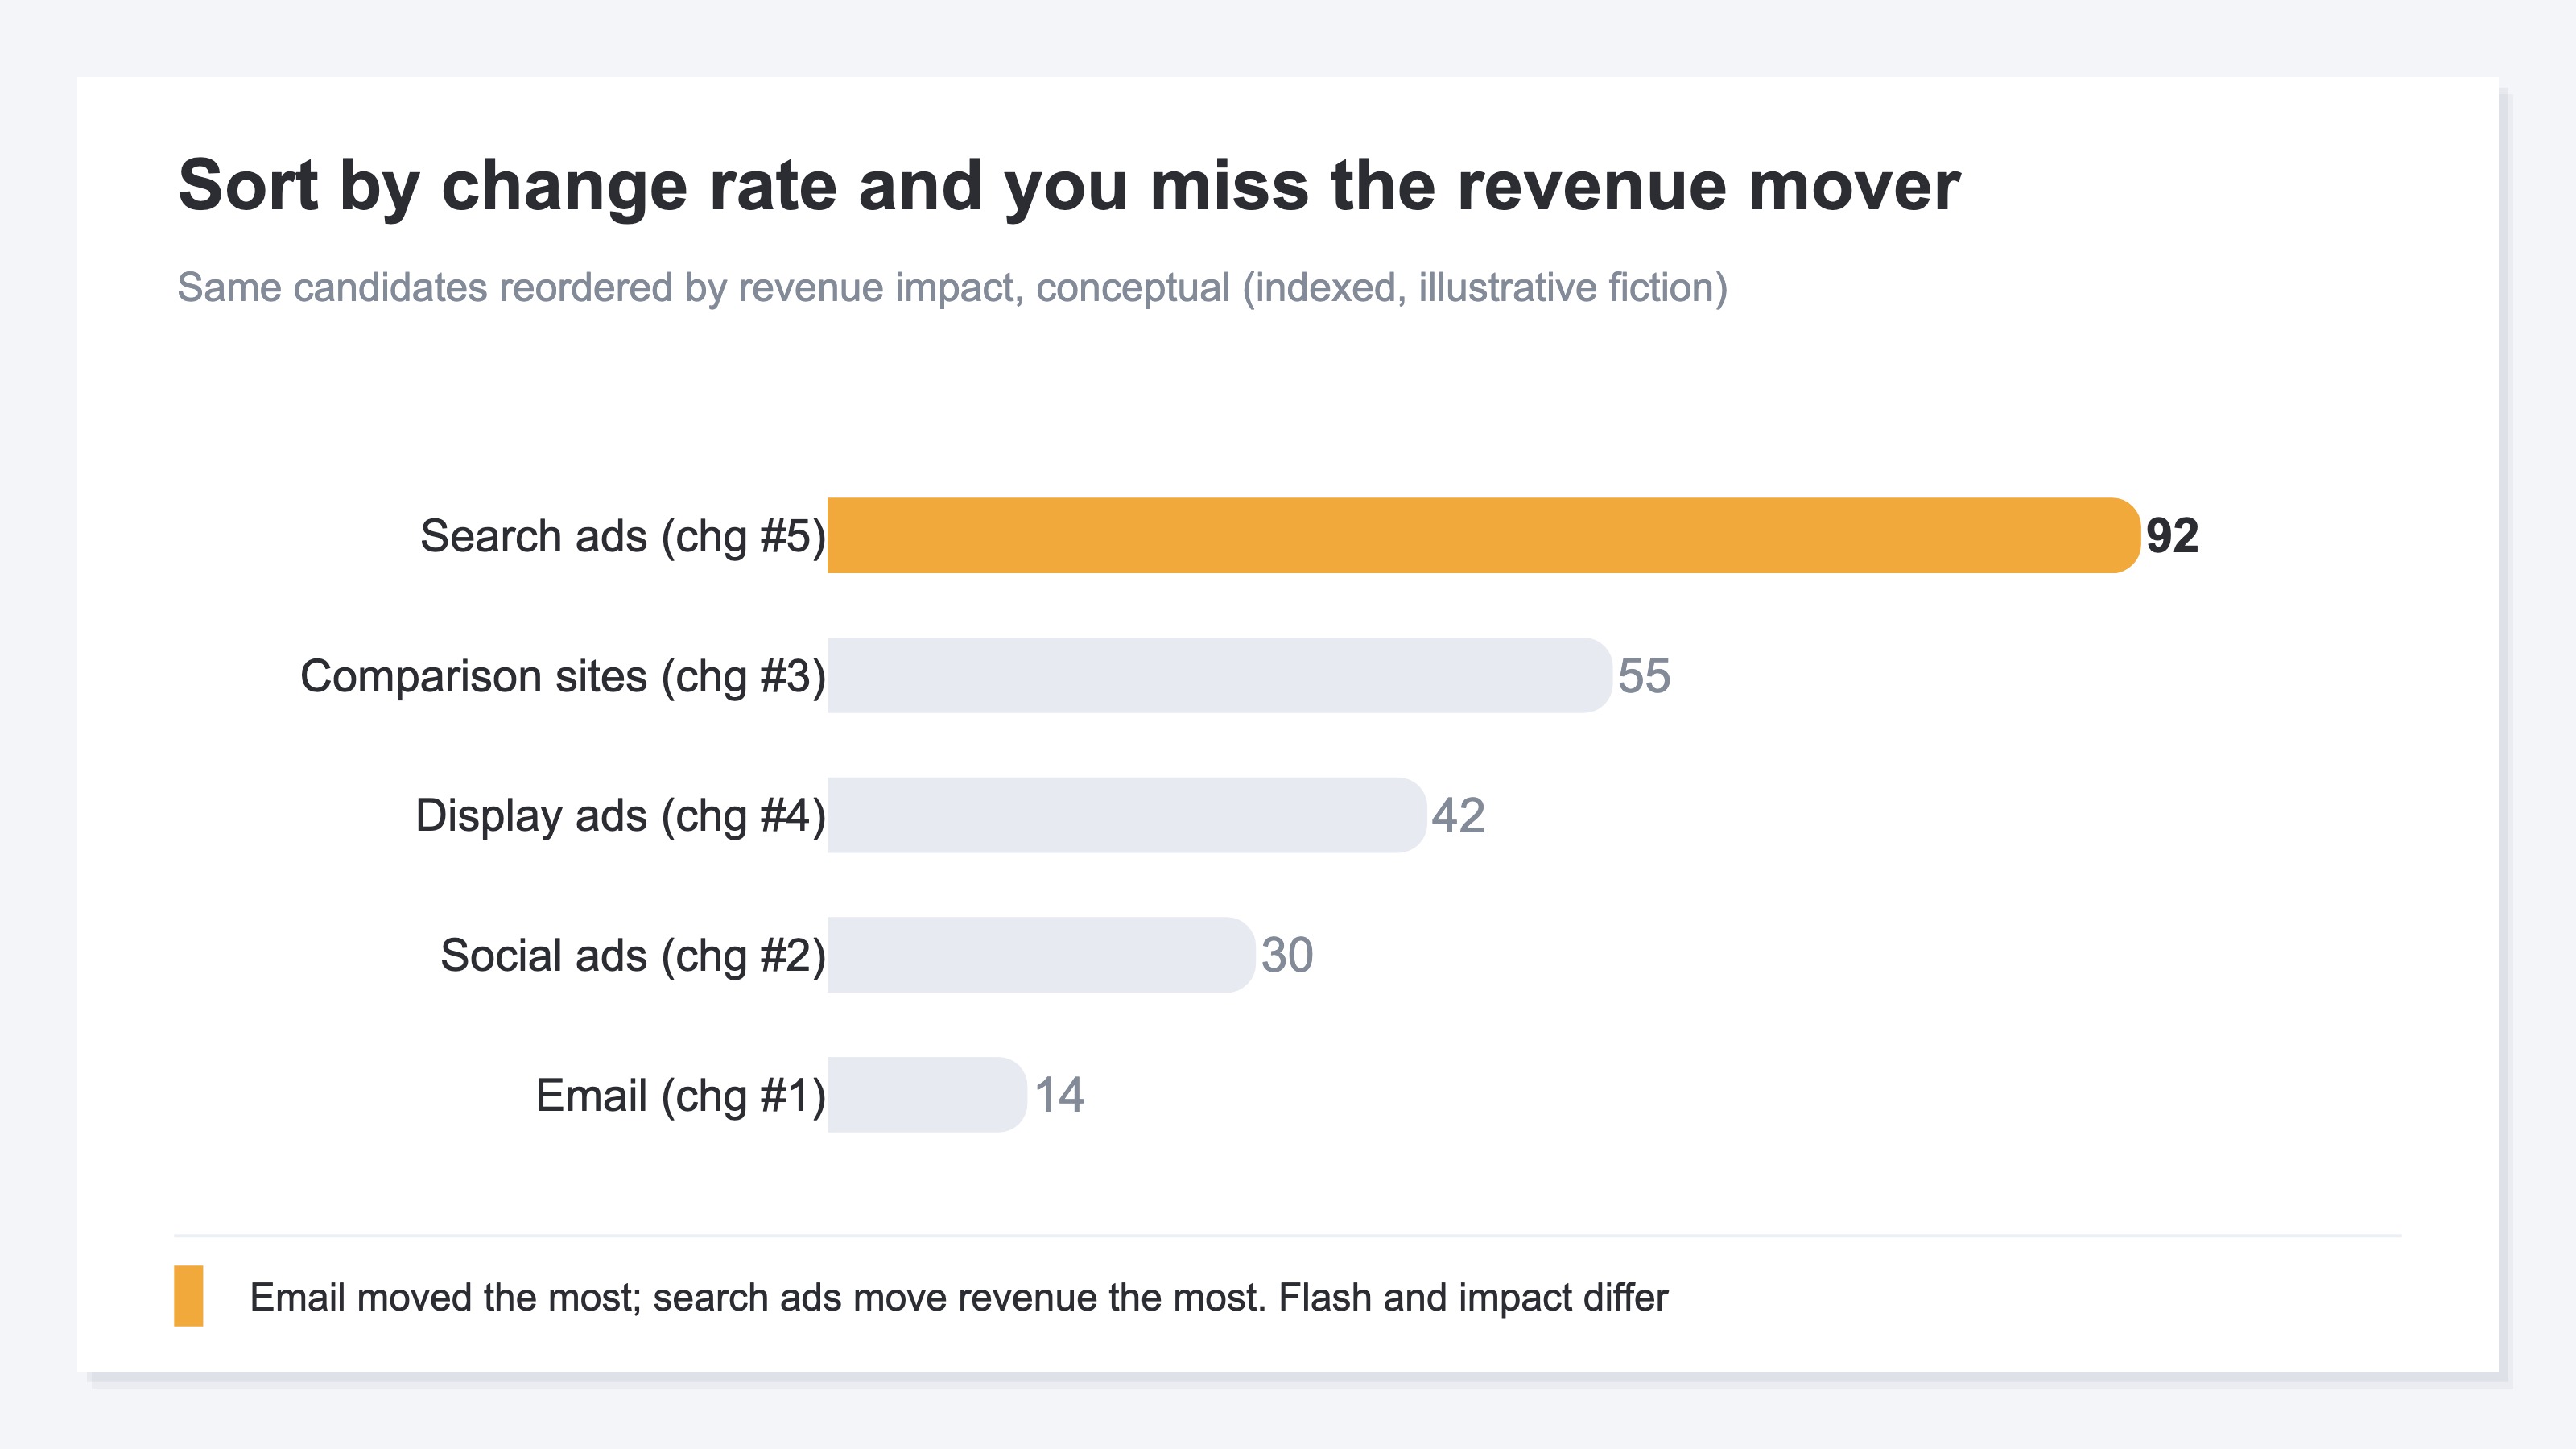
The step of making "which number moved" visible as a chart is covered in Letting AI make your charts — don't hand over the data, let it read them. What to do once you can see it in a chart — that's this article. Making it visible and deciding what comes next are continuous, but they're separate jobs.
3. Priority Is Set Once You Read Period over Period#
Bottom line: to produce the revenue-impact order, you have to cross-reference channels, period-over-period movement, and KPIs to estimate "where revenue is falling right now." The idea is simple, but running it by hand every month is heavy work.
"Just sort by what moves revenue" — the idea is very simple. The problem is that when you actually try to do it, the number of steps jumps. First, produce period-over-period movement per channel. Next, convert that drop from a "rate" into an "amount." Then, if there's a growing entry point like AI-referred traffic, line that up separately as an opportunity to press, not a leak to defend. Only then does the order — "the move that moves revenue most this week is this" — come into view.
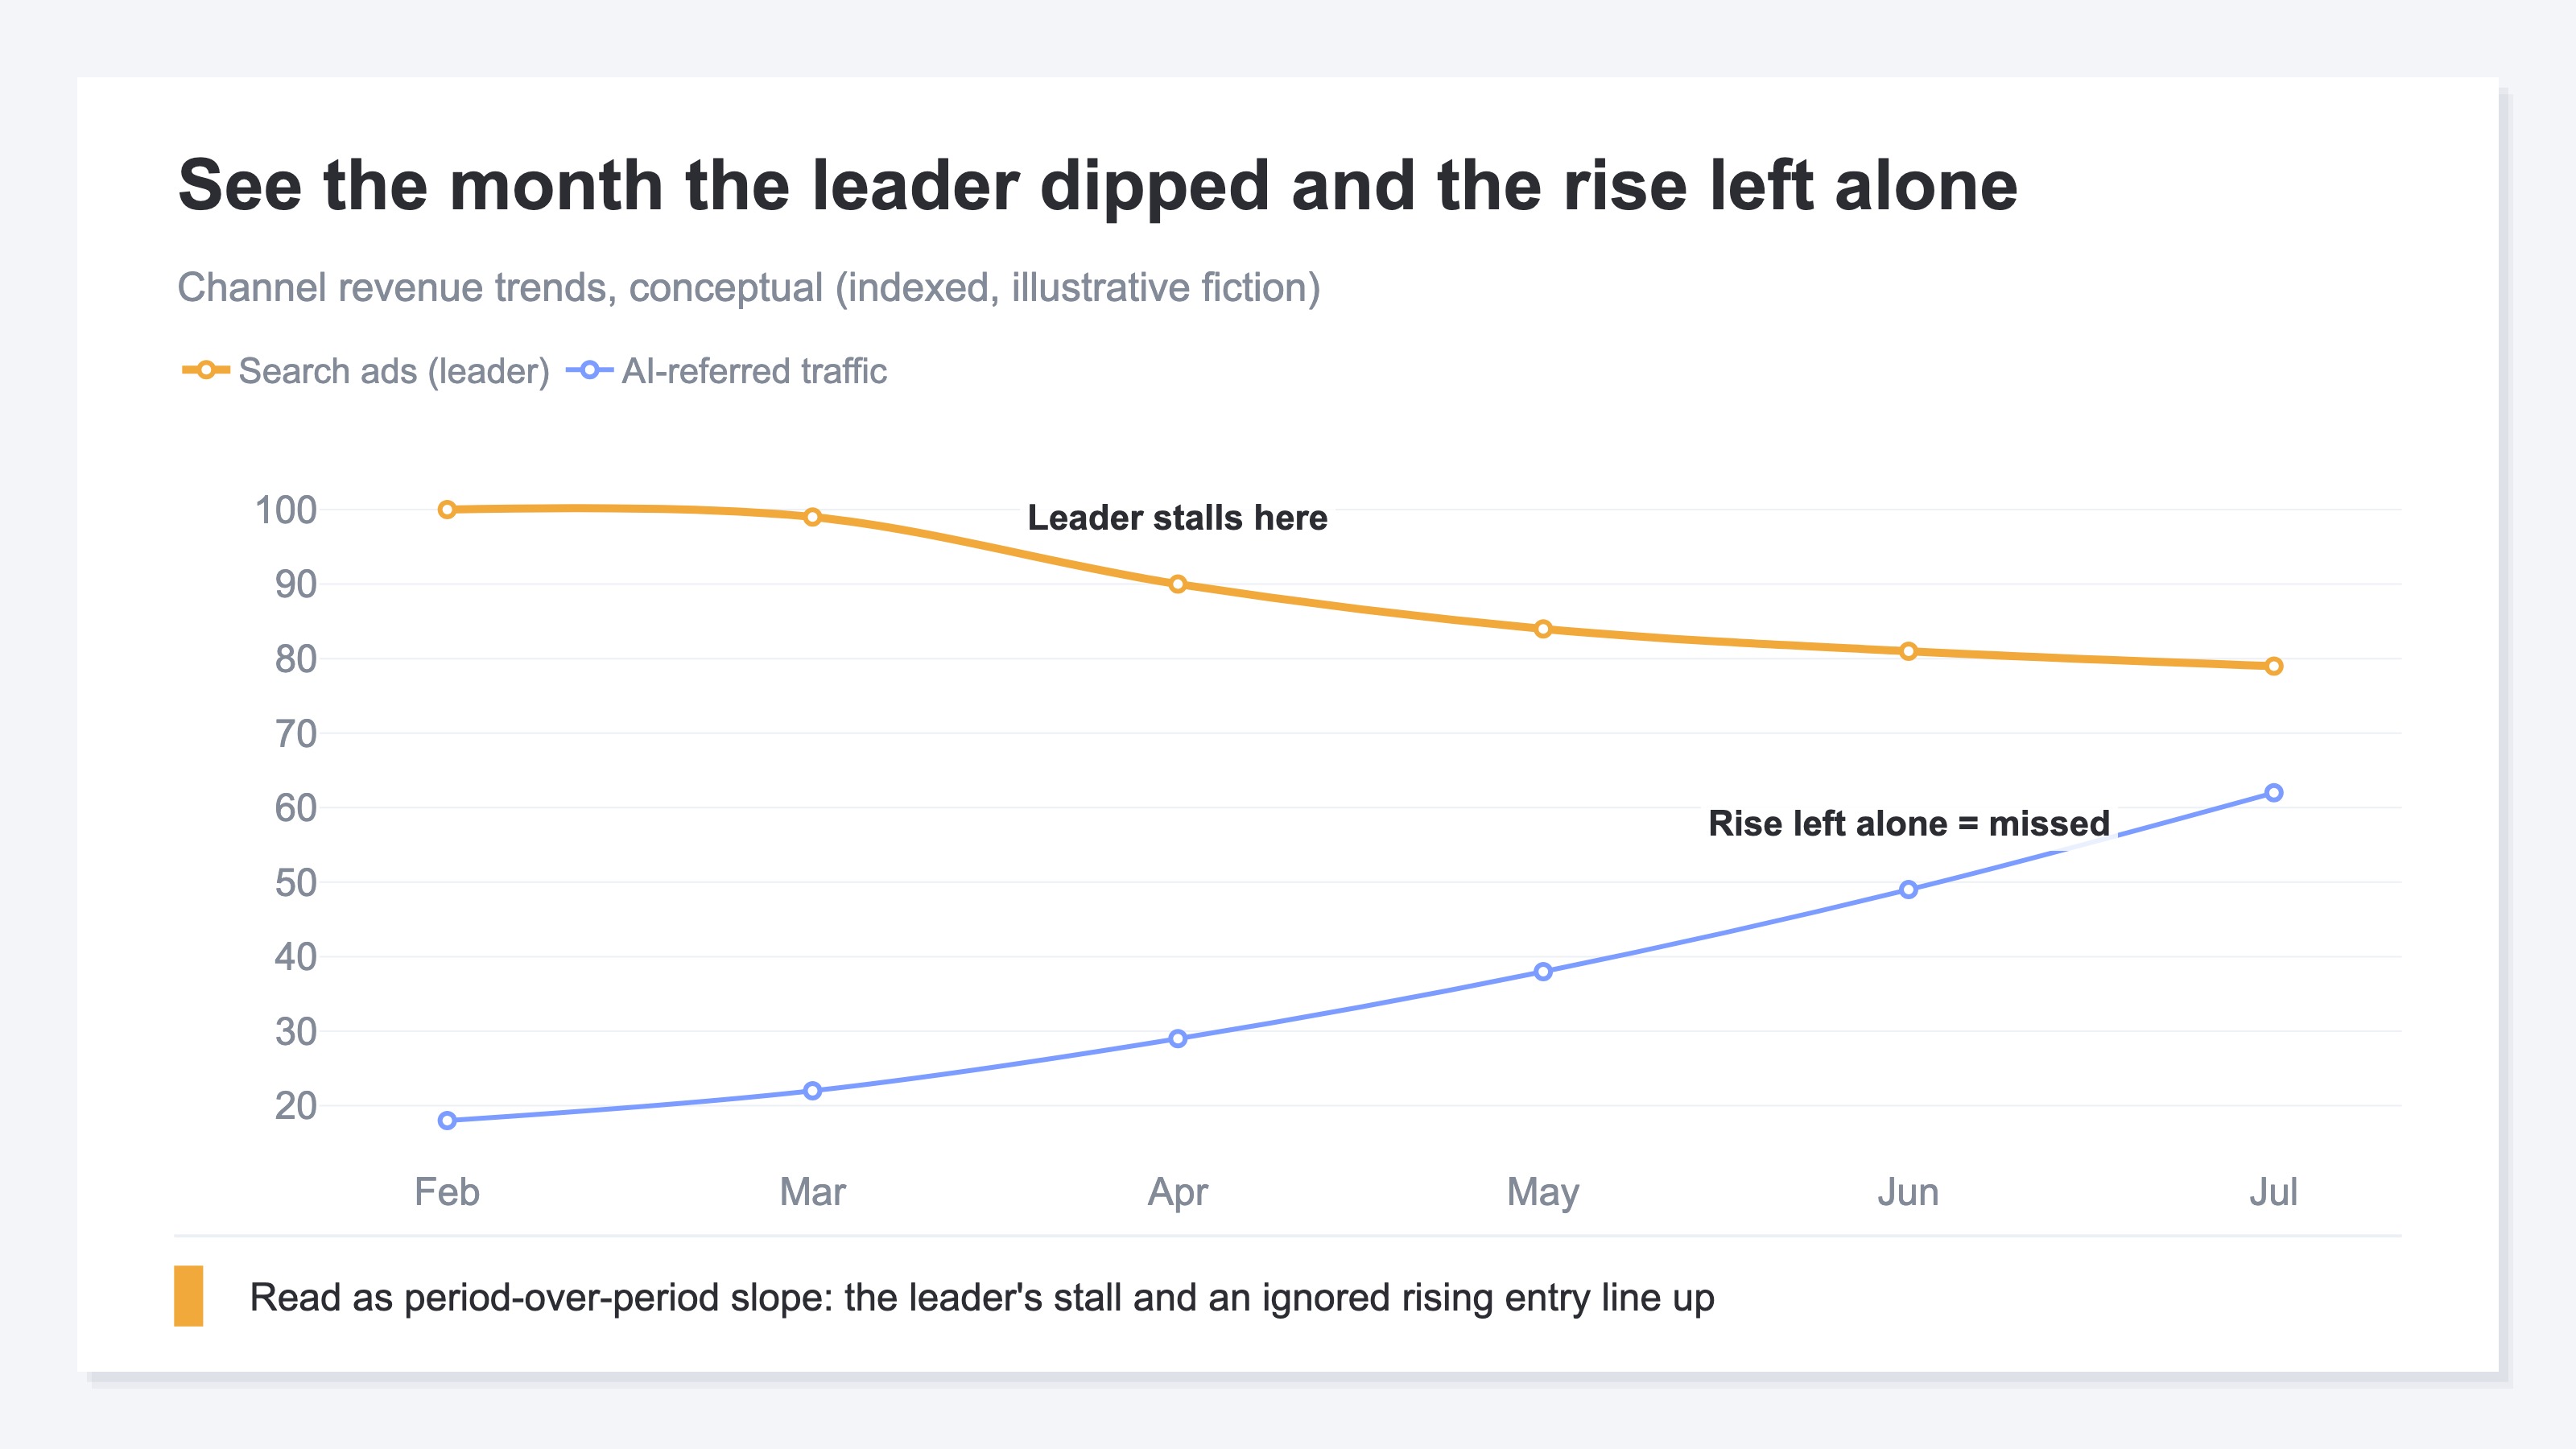
The hard part is redoing this cross-reference by hand, every month. The weight of the prep work — exporting GA4 data and rebuilding period-over-period figures[2] — is laid out in Stop the monthly GA4 re-aggregation — switch to connecting, and on top of that comes converting to amounts and reordering by revenue impact. Because the idea is simple, you end up powering through it by hand every month. But this estimation is exactly the part you can leave to a machine. What a person should do is look at the order that comes out and decide "this one now, this one next month."
RevenueScope helps
Bottom line: in GA4, cross-tabulating "period-over-period × channel × revenue impact" is structurally heavy, and running it by hand every month doesn't hold up. RevenueScope returns the Top 3 "what to do this week," ordered by what moves revenue, just by asking. And it's free to start.
What's become clear so far is that the reason you stall on the monthly report is "the reordering after it's made is heavy." If so, the answer isn't to do the reordering faster — it's to hand the reordering itself back to a machine.
RevenueScope is a light dashboard you can use just by dropping in a single tag, with a window (MCP)[1] for letting AI read that data. It automatically computes the last 30 days against the prior equal 30 days with period-over-period figures, and holds channel-level revenue alongside. So you can just ask the AI "where should I act first this week?" and get back a Top 3 (only as many high-priority rules as actually fire, up to 3) reordered by what moves revenue. No hard setup or SQL required. Because it connects read-only, there's no worry about your data being rewritten.
Ask the sample site and here's what comes back.
| Your question | What the AI returns (example) |
|---|---|
| What should I prioritize this week? | AI-assistant traffic has grown to 155 sessions, up 100% period over period. Identify the cited articles and reinforce related topics — an opportunity to press. |
| What should I look at next? | The "Direct" channel is highly efficient (RPS ¥559, 1.6x the site average) but only 17% of traffic. Worth considering whether you can grow spend or the entry paths here. |
This is what RevenueScope's sample site returns (a fictional site with sample data). It only returns as many high-priority rules as actually fired — no padding — which is why this window came back with 2.
What RevenueScope does is one thing: it reorders your moves by how much they move revenue and returns them as the Top 3 to do this week. It computes that order by cross-referencing channels, period-over-period movement, and revenue impact — that's where it focuses. Looking at the order it returns, deciding "which to do now, which to hold" is your job, as the person who knows the situation on the ground. RevenueScope adds the order of "where to act" on top of the "what happened" that GA4 shows — a complementary role. Having the heavy monthly step of reordering disappear entirely carries real value. And RevenueScope can be started from a free sign-up.
FAQ#
Q. Do I not have to chase every number in the report?
A. Right — you don't have to chase them all with equal weight. Numbers are "records of what happened," so lined up alone they don't form a priority. The realistic approach is to narrow to just a few in "order of how much they move revenue" and act from the top of that list. The rest are enough to use as a check afterward, once you've acted on the top ones.
Q. Should I ignore the numbers with big change rates?
A. Don't ignore them. But it's important not to auto-decide "big rate = priority." A change rate only becomes comparable for its pull on revenue once you convert it into an amount. A big rate but a small amount goes later; a small rate on a main channel is top priority — make that call after looking at the amount.
Q. Can I just execute the Top 3 RevenueScope returns as-is?
A. The Top 3 RevenueScope returns is a "candidate order for this week," reordered by how much each move is likely to move revenue. Leave the ordering to a machine, and let you — the one who knows the situation on the ground — decide "which to do now, which to hold." That division of labor fails least often.
Summary#
The real cause of stalling on the monthly report isn't a lack of analysis, but that the report is a list of "what happened" and not a list of "what to do next." When you choose your next move, re-sort not by whatever moved most dramatically but by what moves revenue. To do that you need the estimation of converting period-over-period figures into amounts and cross-referencing them — but because the idea is simple, running it by hand every month doesn't hold up.
So even after you finish reading this, it doesn't end at "just sort by revenue." What remains is to hand that reordering back to a machine and turn your time toward the work of deciding which to do now. Start free, connect your own data, and try asking for the single move most likely to move revenue this week.
See which ads actually drive revenue, at a glance
Free up to 2,000 sessions/month, AI connection included. No credit card required. Up and running in 5 minutes.