
Do you repeat the same thing every month? You open GA4, export the data, fix the garbled text when the file opens broken, rebuild a pivot, sort it by channel, calculate the period-over-period change with a calculator or a formula, and paste it into a deck. By the time all of that is done, half a day is gone.
It is not tiring because you are bad at this. It is tiring because GA4 does not treat "cut by month and line it up against last month automatically" as a main feature. So every time, you end up exporting the raw data and re-aggregating it by month yourself. The genuinely heavy part is not the finished chart — it is the prep in front of it.
The goal of this article is to stop building the monthly aggregation and switch to connecting instead. Change one thing in the approach, and the period-over-period change comes back already calculated. Laid out step by step, plainly, for EC operators.
Contents
TL;DR#
Here are the takeaways up front.
- The monthly GA4 aggregation is tiring not because you run it badly, but because GA4 does not put "monthly" or "period-over-period" front and center, so you re-stack it from scratch every time. The heavy part is not the chart but the prep in front: fixing encoding, pivoting, and calculating period-over-period
- The common answer is "automate it with GAS, Looker, or BigQuery," but that automation itself needs maintenance every time an axis changes
- Connect your own data to AI directly and the period-over-period change comes back already calculated — the aggregation step itself disappears. What you free up is less the time than the focus the prep had been stealing from your decisions
1. Where Your Monthly GA4 Time Actually Goes#
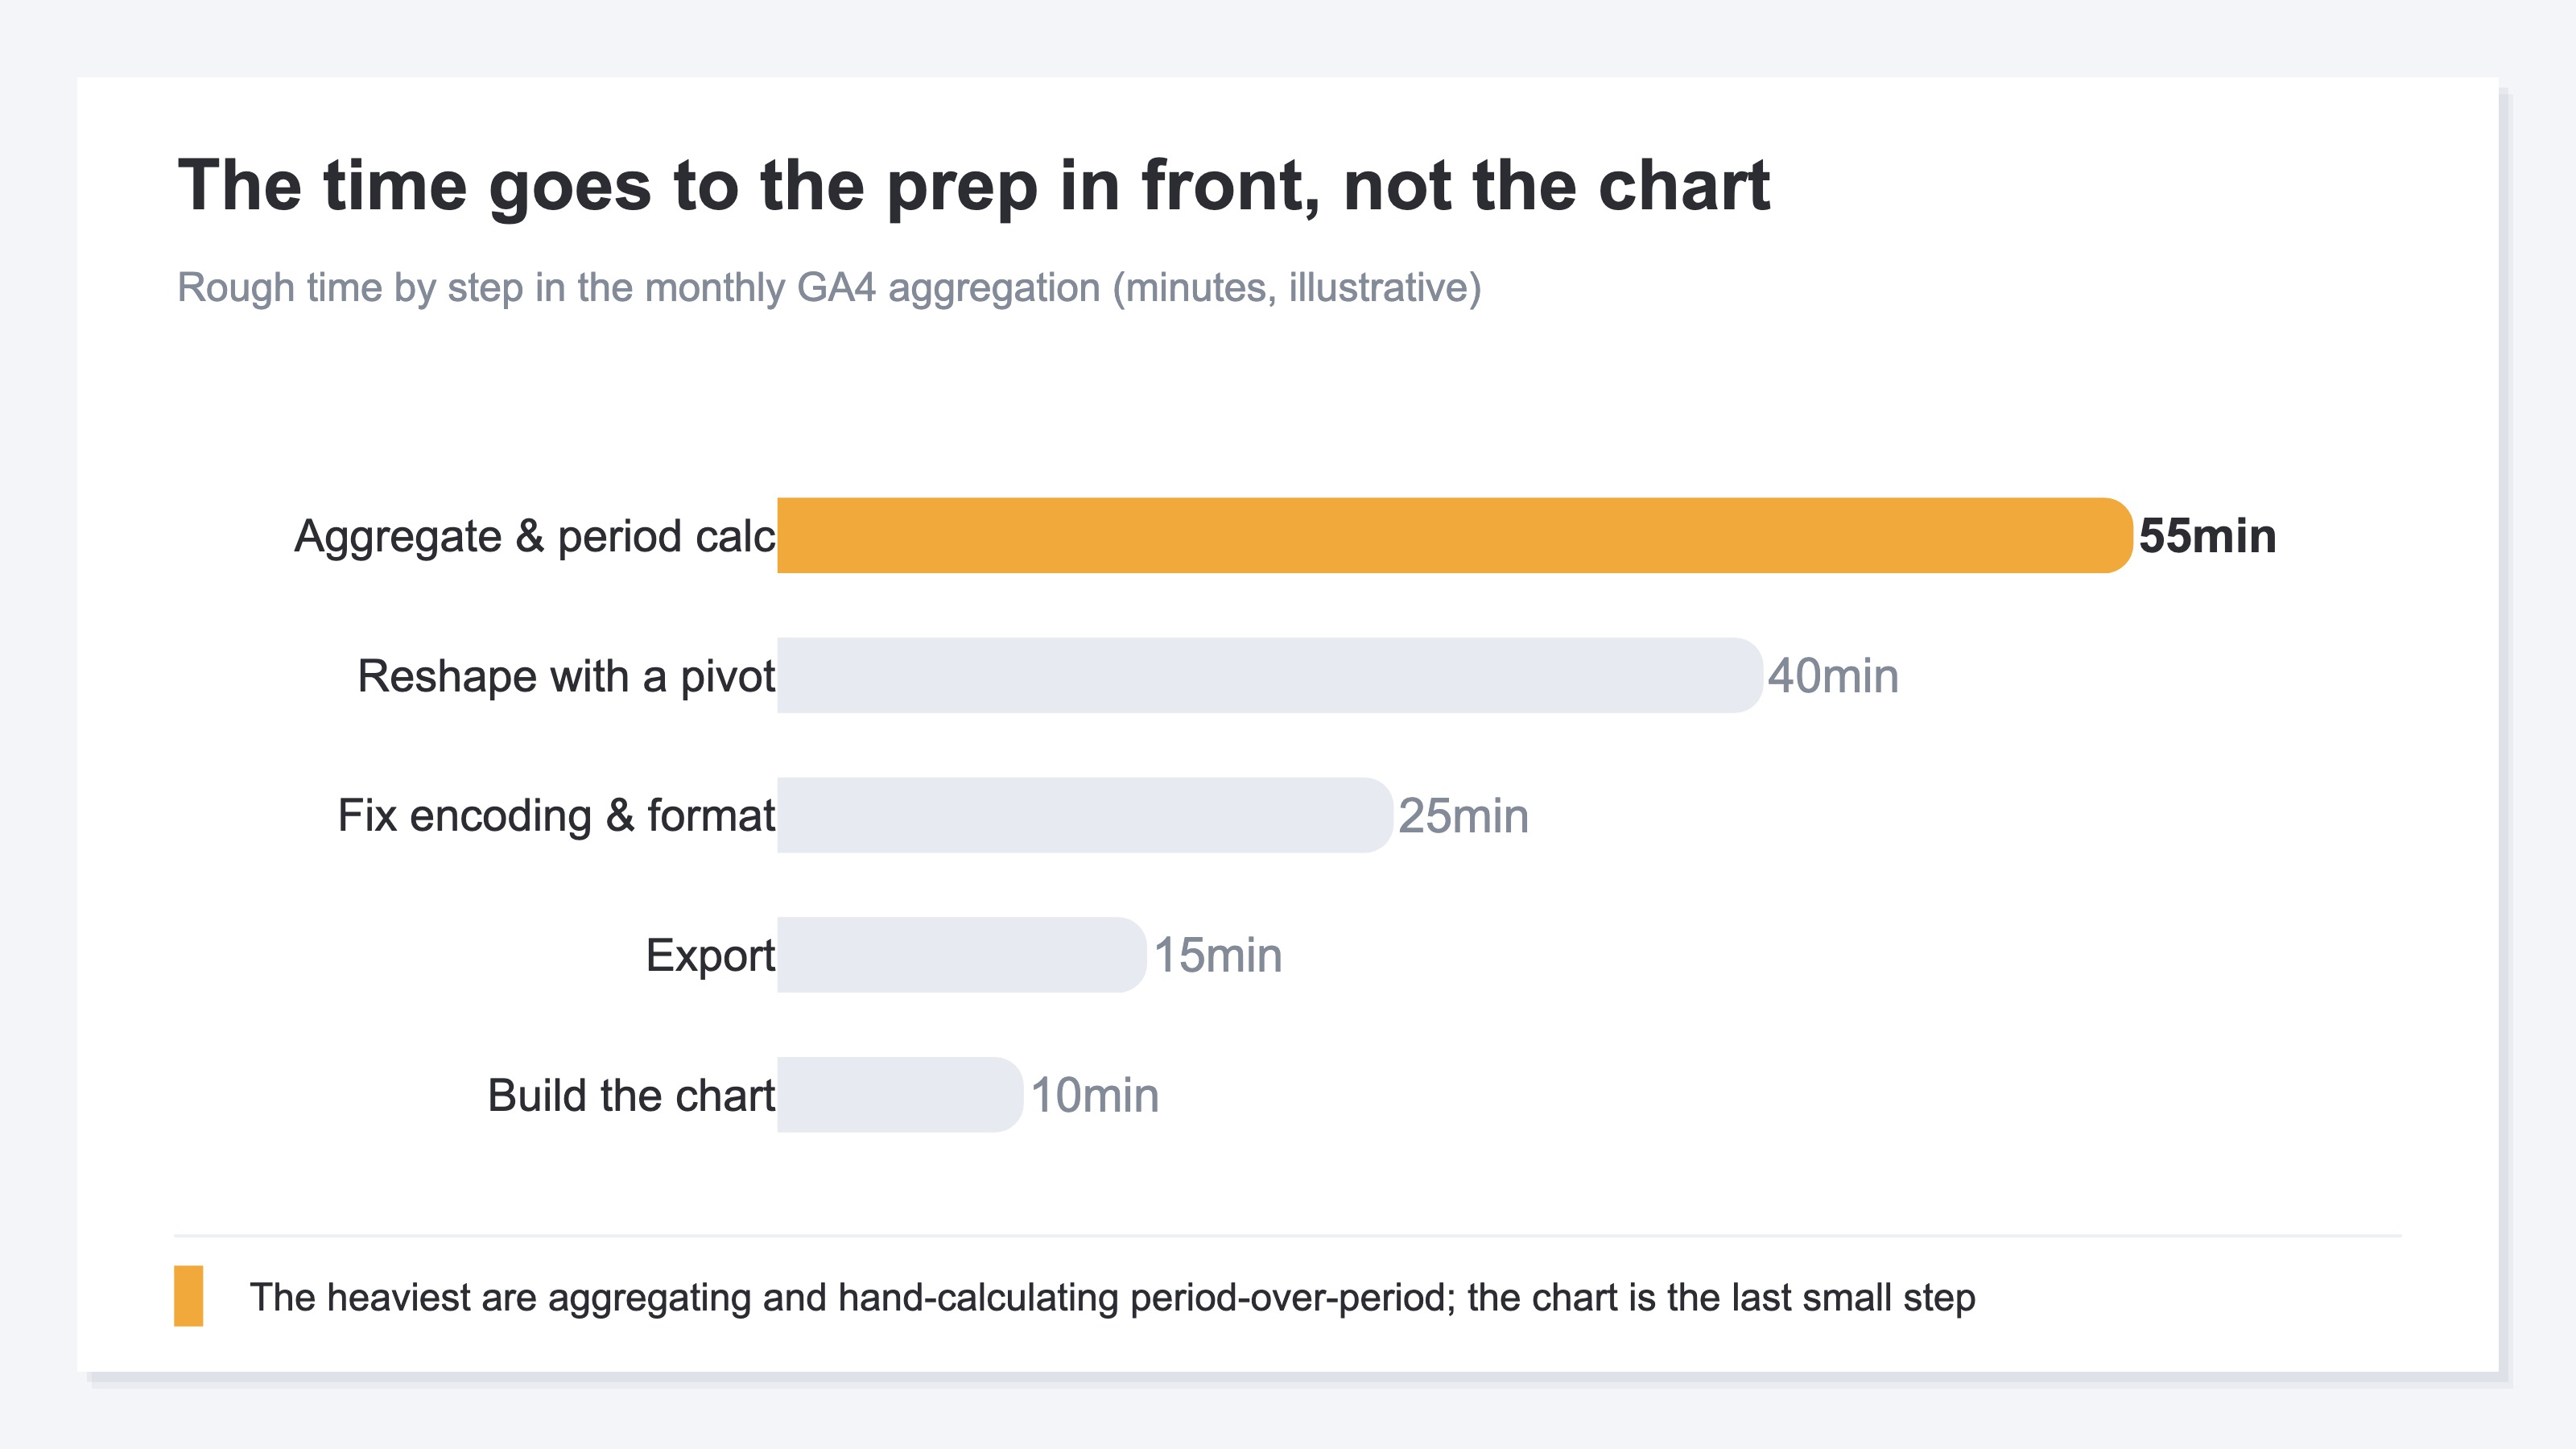
Bottom line: what actually eats your time in the monthly GA4 aggregation is not building the chart, but the prep in front of it.
Break the monthly work down, and you can see where your hands actually stall. First you export the data you need from GA4. You open the CSV, find the Japanese garbled, and fix the character encoding. Channels and periods are scattered, so you rebuild them with a pivot. Only then do you finally start calculating the period-over-period change — this month is X, last month was Y, the gap is minus so-many percent. Turning it into a chart is just the last little step after all that long prep is done.
The tricky part is that next month, this prep starts again from the very beginning. The table you built last month does not fit this month's new data. If you get lost deciding which report to pull numbers from, sort that out first with the top 3 GA4 reports to watch in EC, and you can shrink the scope of the prep itself.
2. GA4 Doesn't Center "Monthly" or "Period-Over-Period"#
Bottom line: you end up re-stacking from scratch every month not because you run it badly, but because GA4 does not put "monthly" or "period-over-period" front and center.
GA4 is a tool where you specify a date range yourself and look at it. It does not make "cut by this month automatically and line it up next to last month to show the gap" a main feature. So if you want it cut by month and compared to the prior month, you have no choice but to write the data out and re-aggregate it by hand. The straight line from GA4's standard use leads to an Excel export and manual calculation [1].
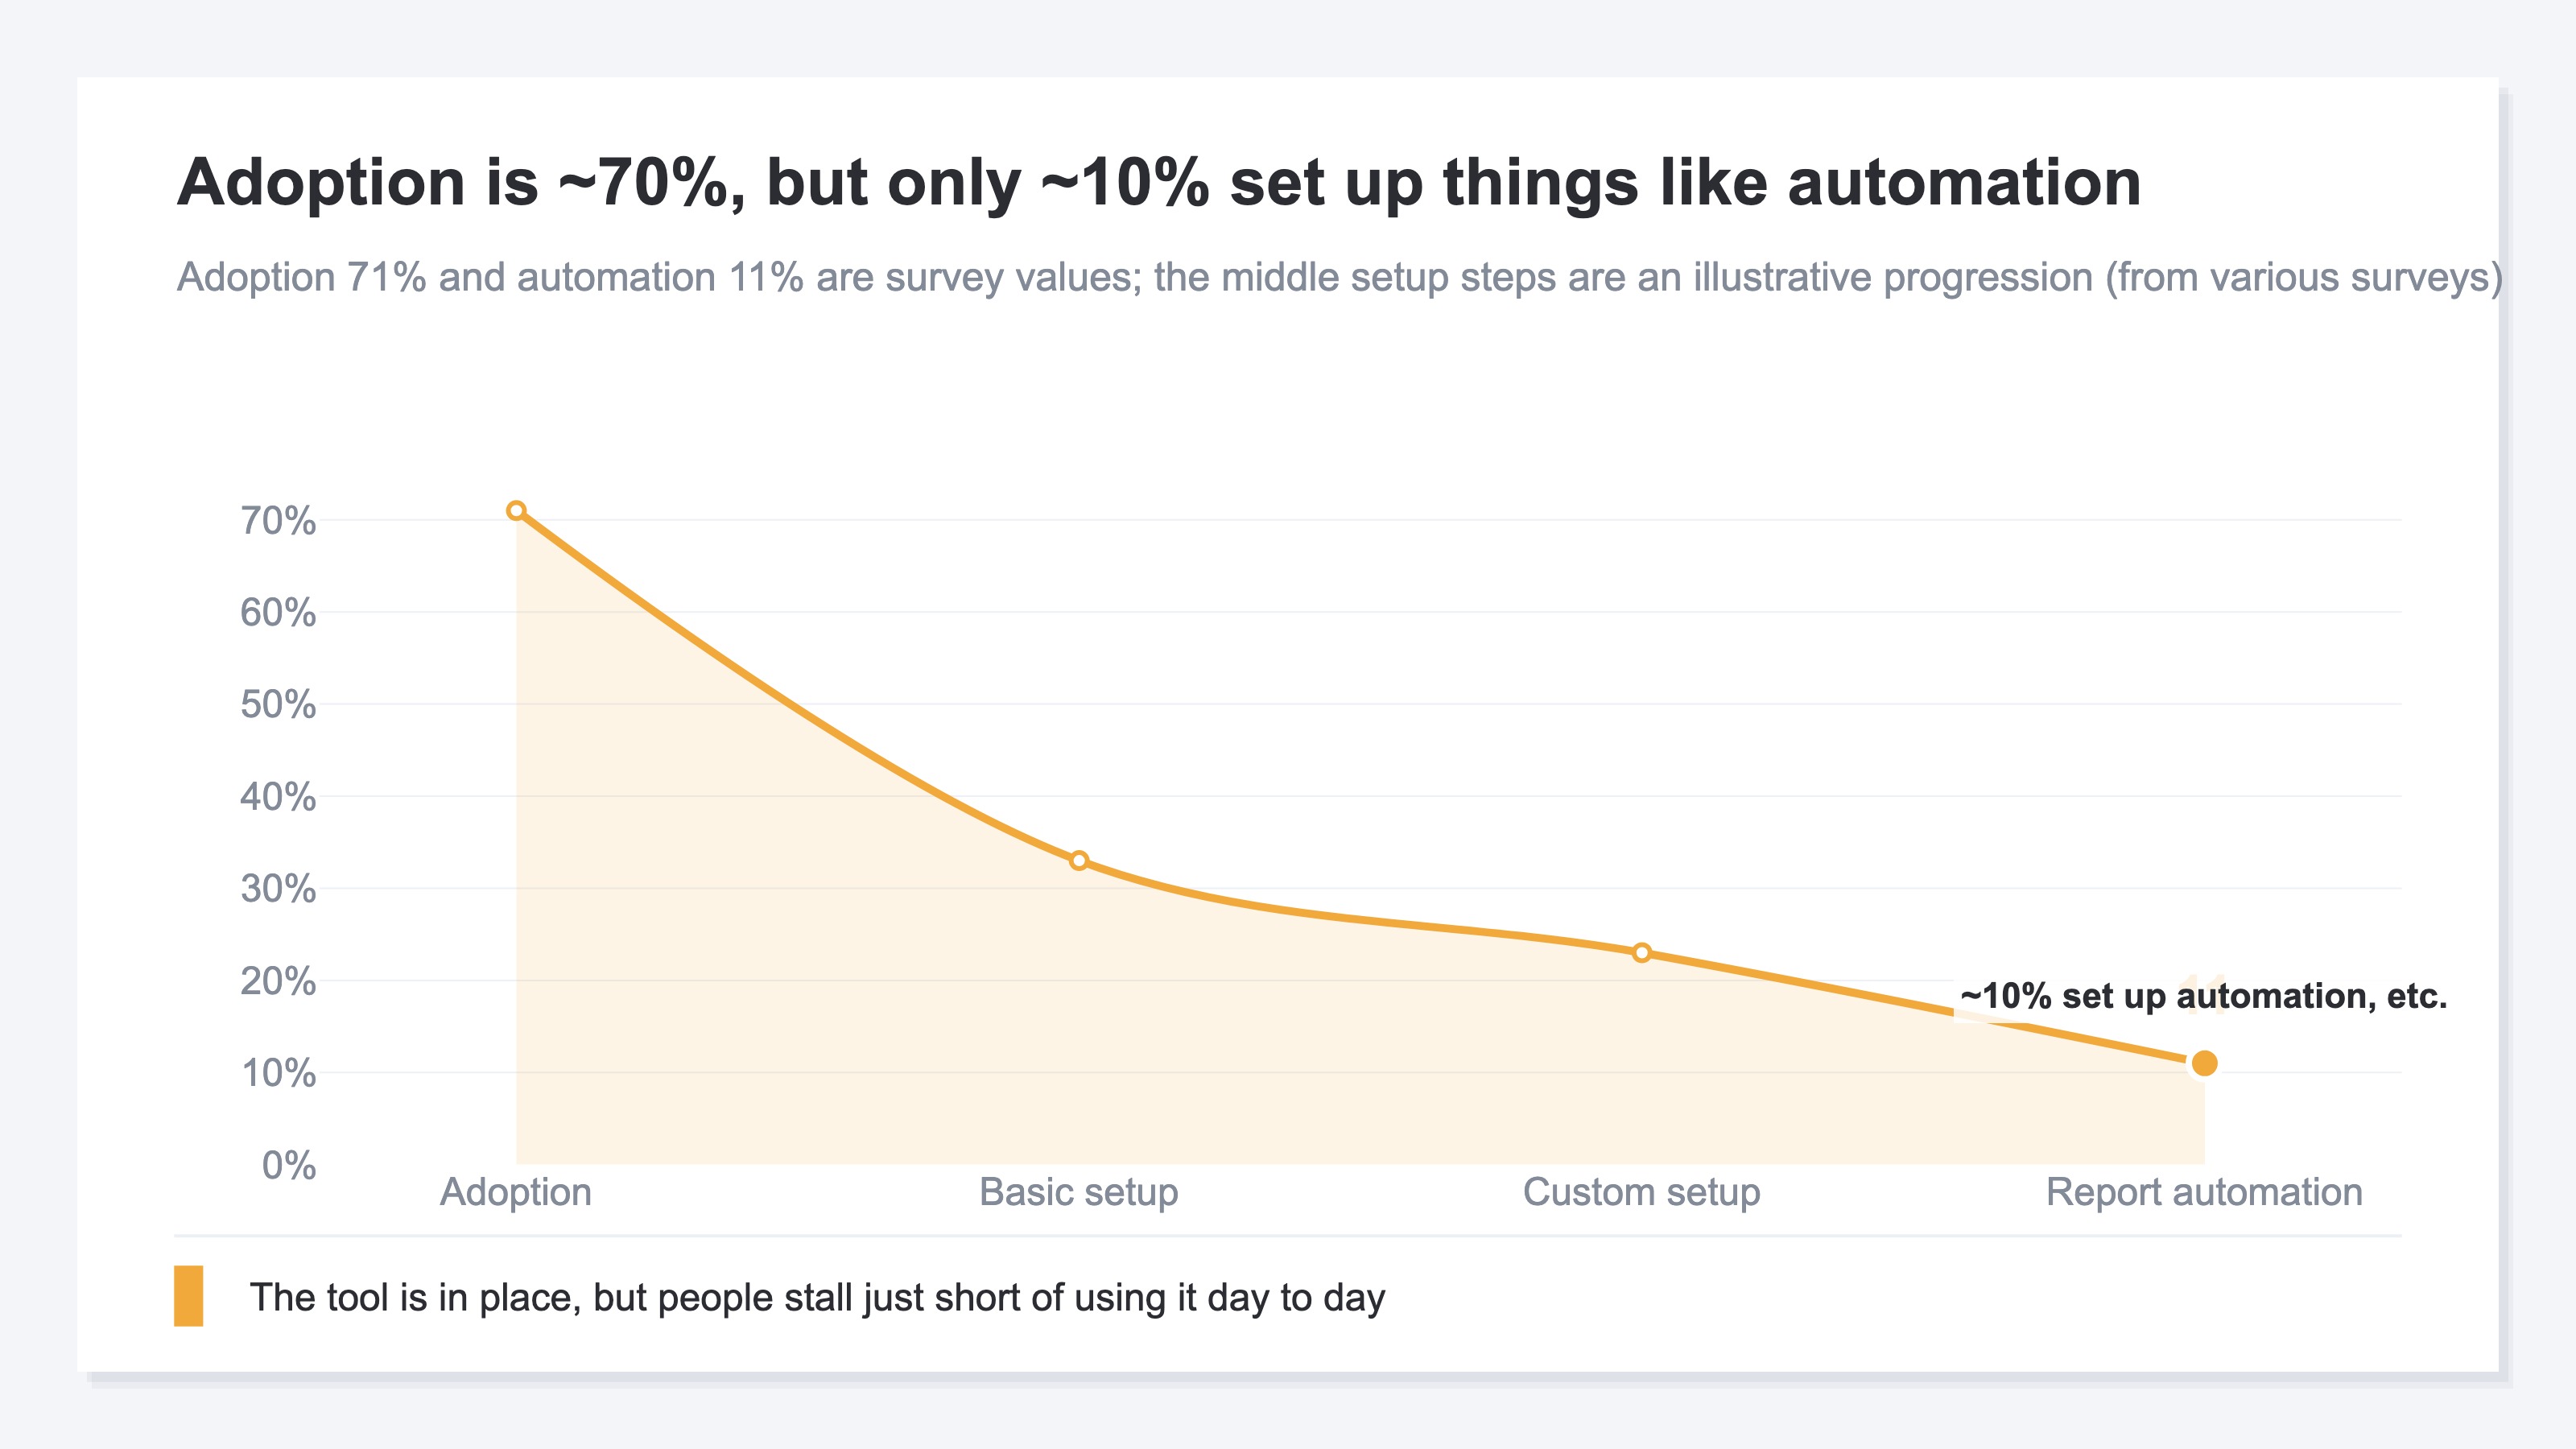
You are not the only one stumbling here. In one survey, 71% of companies said they had adopted GA4 [2] (2022, a survey of marketing staff). Yet the share that had gone as far as setting up things like report automation was only about 11% [3] (2023, a separate field survey). Further, a 2024 survey found that 50.7% of respondents felt "the best way to make use of the data" was difficult [4]. The tool is in place, but people stall just short of using it well in day-to-day operations — and that shows up in the numbers.
What remains at the very bottom of not reaching automation is a state where you cannot answer a very simple question at once. For example: "Yesterday I spent 50,000 yen on ads. How much of that turned into sales?" Not many EC operators can produce that answer on a single screen — because answering it takes yet more prep. The way to see revenue and its entry points on one sheet is laid out in putting your revenue on one page.
3. Why the Copy-Paste-and-Pivot Routine Doesn't Last#
Bottom line: the reason automation somehow does not last is that every time you change the shape of the report, the plumbing behind it has to be rebuilt, and maintenance gets heavy.
"Then just automate it" is the answer many articles arrive at. Have GAS transcribe into a spreadsheet, build a dashboard in Looker Studio, pile data into BigQuery and aggregate it. The direction is right, and once it is built, it runs every month for you.
But there is a hidden difficulty in keeping it going. What automation takes off your hands is only the work of "building the report in its current shape." Add one more axis you want to see, and you rebuild the inside of the aggregation. Change a GA4 field or how channels are grouped, and you rebuild again. If no one in-house can maintain the formulas or queries, it stops the moment that person leaves. In other words, automation often did not erase the prep — it just moved the prep to the "building" side. So the thing that was supposed to be convenient quietly reverts to manual work.
Having AI "build" the monthly report itself is a separate topic, covered in AI for monthly reports: stop transcribing, connect the data. What this article is about is the manual work of "aggregating and period-over-period" that comes before building the report. If you want to compare monthly channel efficiency, the monthly channel efficiency review pairs well with this too.
RevenueScope's solution
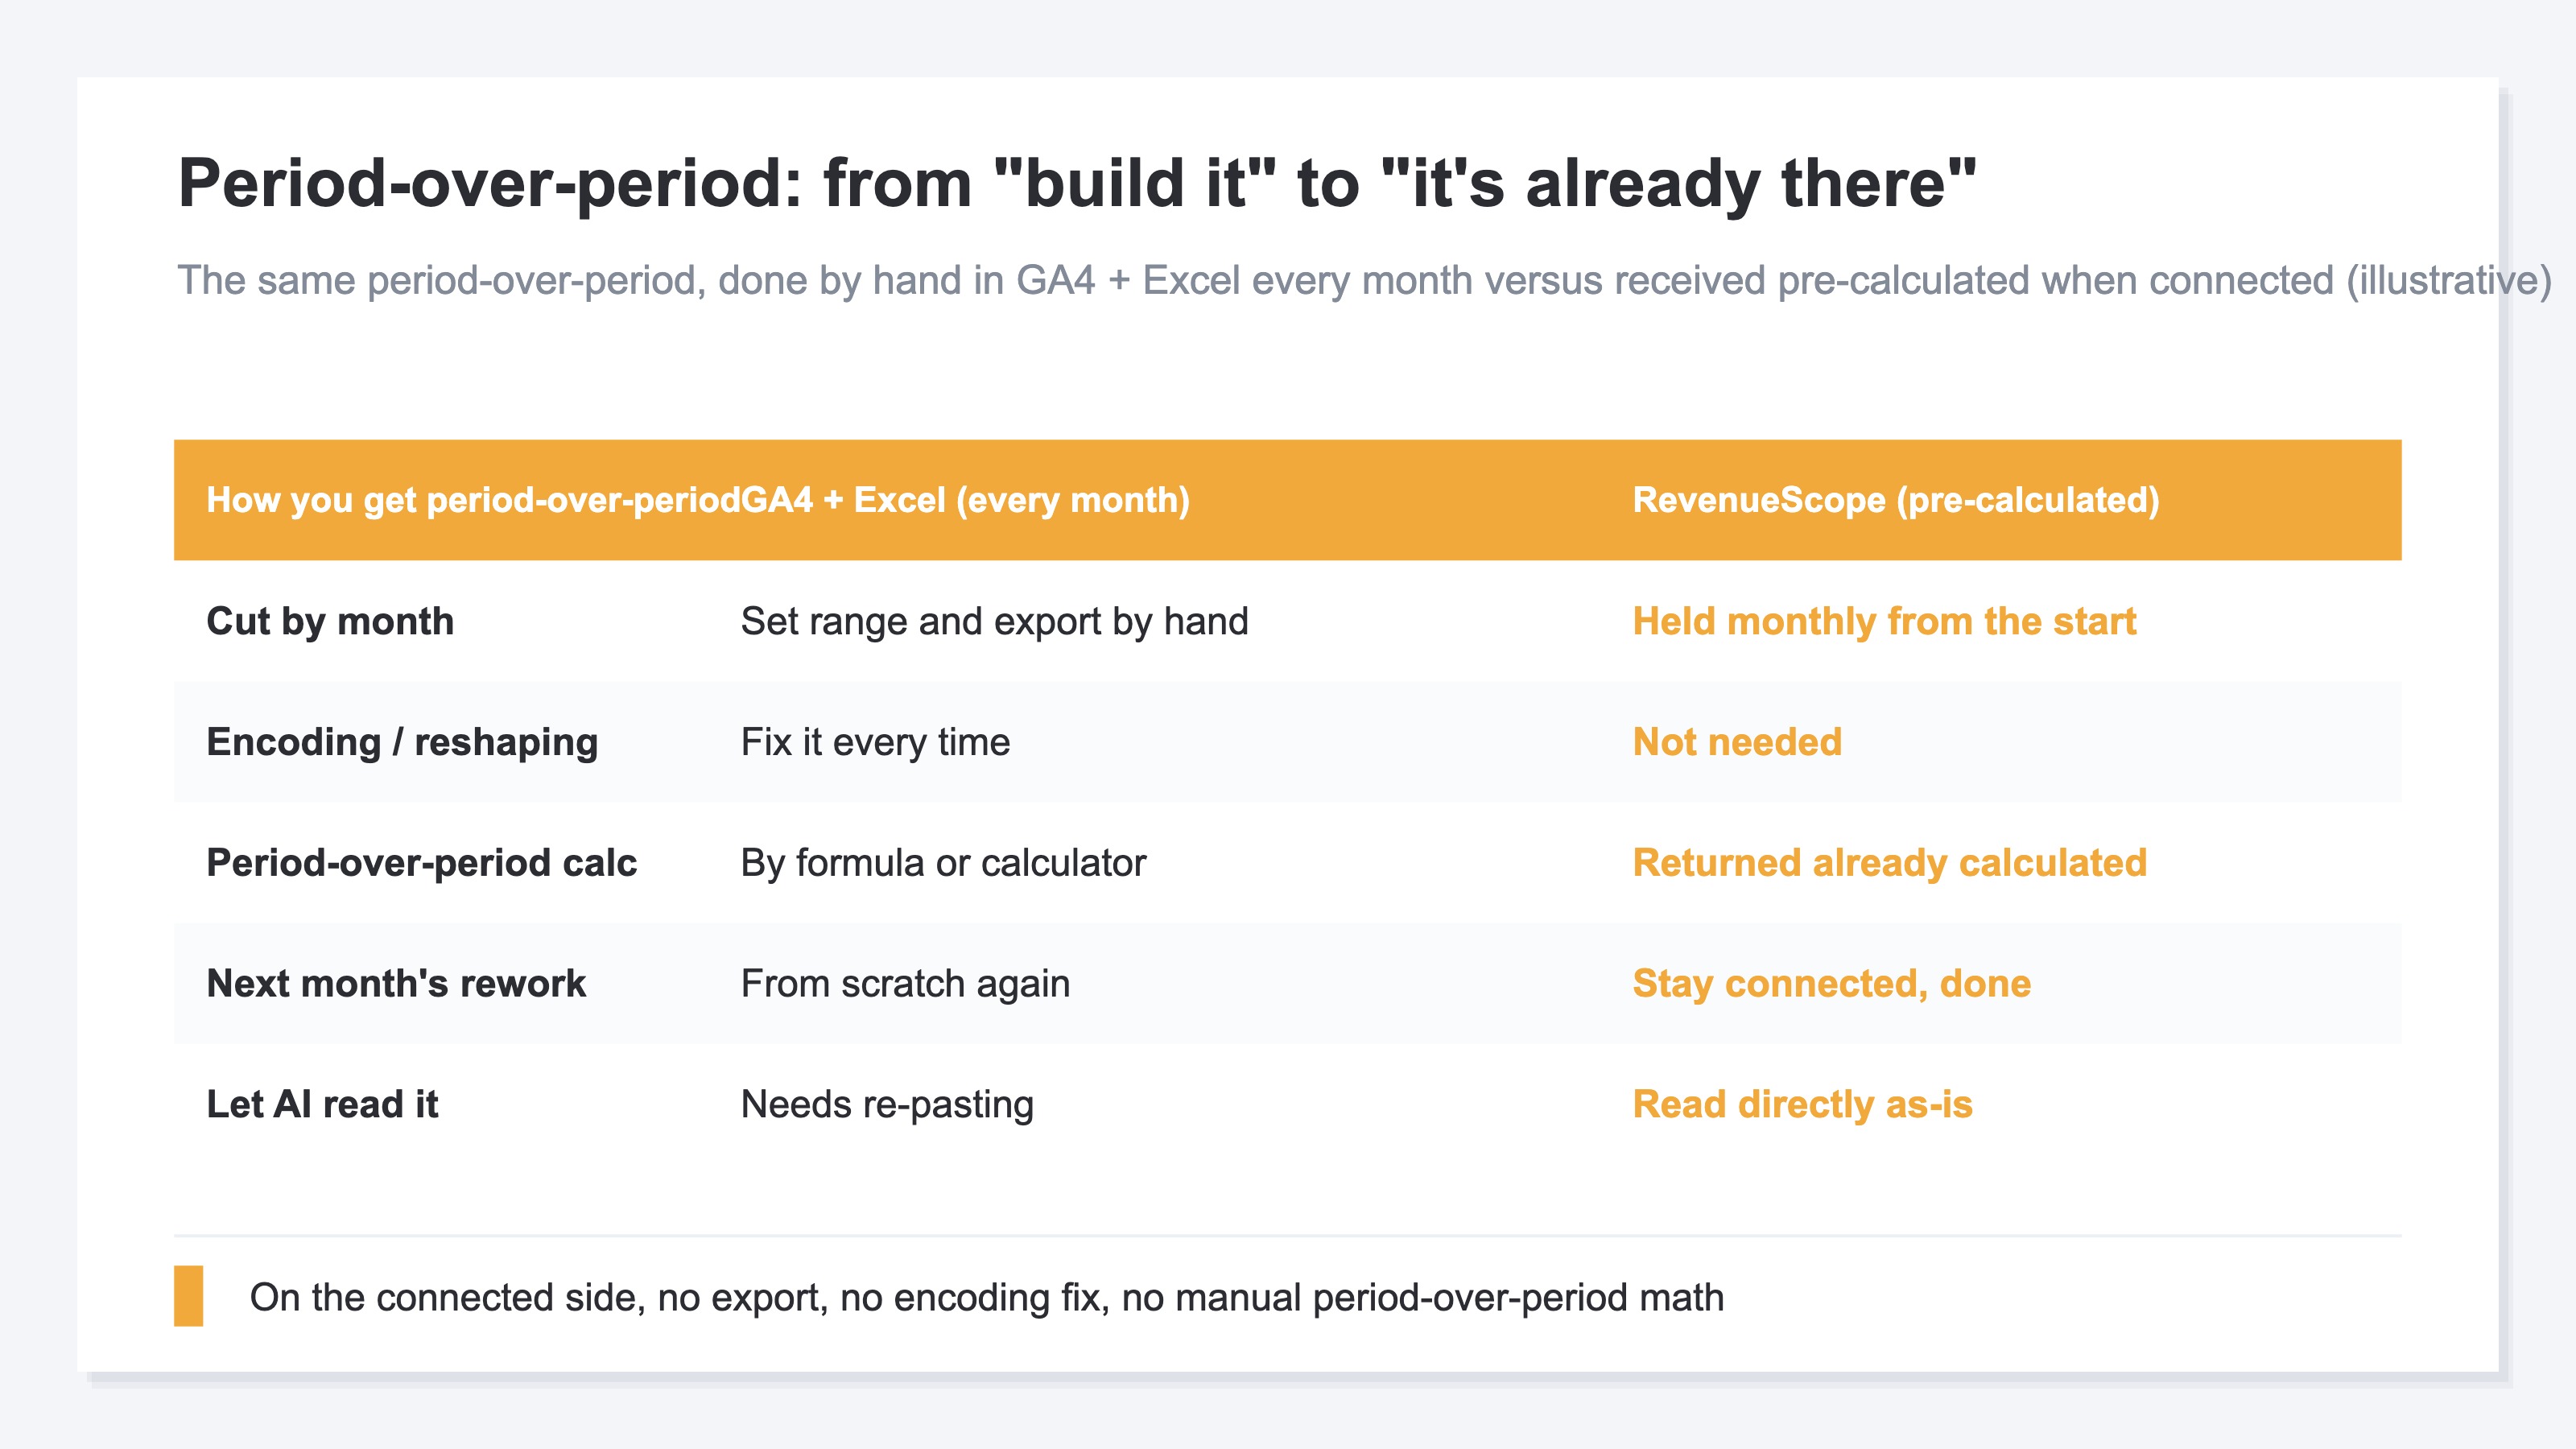
Bottom line: GA4 splits the "aggregate then period-over-period" steps apart, and re-stacking them every month is heavy. RevenueScope returns the period-over-period change already calculated the moment you connect, and lets AI read it directly. And it is free to start.
What you have seen so far is that the reason aggregation is tiring is "because you build it from scratch every month." If so, the answer is not to build it fewer times, but to remove the building step itself.
RevenueScope is a lightweight dashboard you can use by adding a single tag, with a window (MCP) [5] that lets AI read those numbers. It computes the last 30 days against the prior 30 automatically, with the period-over-period change already attached. So just ask AI "how are sales versus last month?" and the answer comes back with no export and no manual math. No hard setup or SQL is needed. Because it connects in read-only mode, there is no risk of your data being rewritten.
Ask the sample site, and it returns like this.
| Your question | What AI returns (example) |
|---|---|
| How are sales versus last month? | The last 30 days are 419K yen, down 12.4% vs the prior period. No need to calculate the change by hand |
| Which number is falling the most? | Revenue per session (RPS) is 312.7 yen, down 8% vs the prior period — a bigger drop than sessions at down 4.8% |
| Did sessions fall? | 1,342, down 4.8% vs the prior period. Not as much as revenue |
Ask RevenueScope's sample site, and it returns this (fictional site with sample data).
This view of RPS (revenue per one visit) is laid out in detail in RPS: reading quality by revenue per visit.
RevenueScope divides the work with GA4. Where GA4 is the tool for seeing "what happened," RevenueScope is the layer that adds "the meaning, with period-over-period attached" on top. It specializes in revenue-based KPIs like revenue, RPS, and ROAS, and returns the last 30 days against the prior 30 already calculated — so the work of re-stacking period-over-period every month simply disappears. And RevenueScope starts from a free sign-up.
FAQ#
Q. If I stop calculating period-over-period in Excel, can I stop looking at GA4?
No. GA4 remains effective as a tool for seeing "what happened." What you let go of here is only the prep part — exporting GA4 data every month and re-stacking the period-over-period by hand. Think of GA4 and the connected side as a complementary pair, each with its own strength.
Q. How is this different from automating with GAS or BigQuery?
Automation mechanizes the work of "building the report in its current shape," but it needs maintenance every time you want another axis. The connect approach does not build the report — AI reads the raw data itself, each time. So every read is current, and when you want a different axis, you just change how you ask.
Q. I have few sales yet. Is there any point in looking at period-over-period?
Yes. The period-over-period change in sessions [6], bounce rate, and average time on page is visible before any sales. RPS and CVR start from zero, but it is good to begin by being able to read "how visits moved" in period-over-period terms.
Summary#
The real nature of why the monthly GA4 aggregation is tiring was not the chart-building, but the prep in front of it. The cause is not how well you run it, but that GA4 does not put "monthly" or "period-over-period" front and center, so you export and re-stack every time. Change the approach from "build" to "connect," just once, and the period-over-period change comes back already calculated — the aggregation step itself disappears.
So even when you finish this article, it does not end at "just connect it." What remains is the work of turning the focus that the prep had been stealing toward the decision of which channel to invest in. Start for free — connect your own data and receive the gap versus last month with no manual math.
See which ads actually drive revenue, at a glance
Free up to 5,000 sessions/month, AI analyst included. No credit card required. Up and running in 5 minutes.
References#
- [1] Google Analytics Help "[GA4] Share and export reports" (2026)
- [2] Hagakure (Digipro) "Survey on GA4 adoption status" (2022)
- [3] Owly "Survey on Google Analytics 4" (2023)
- [4] Fujifilm Business Innovation "Survey on the actual use of analytics tools" (2024)
- [5] Model Context Protocol "Introduction" (2026)
- [6] Google Analytics Help "About Analytics sessions" (2026)